Stable isotope turnover rates and fractionation in captive California yellowtail (Seriola dorsalis): insights for application to field studies
←
→
Page content transcription
If your browser does not render page correctly, please read the page content below
www.nature.com/scientificreports
OPEN Stable isotope turnover rates
and fractionation in captive
California yellowtail (Seriola
dorsalis): insights for application
to field studies
Daniel J. Madigan1,2*, Owyn E. Snodgrass3, John R. Hyde3 & Heidi Dewar3
Stable isotope analysis (SIA) measurements from long-term captivity studies provide required
parameters for interpretation of consumer SIA data. We raised young-of-the-year (14–19 cm)
California yellowtail (Seriola dorsalis) on a low δ15N and δ13C diet (pellet aquaculture feed) for
525 days, then switched to a high δ15N and δ13C diet (mackerel and squid) for 753 days. Yellowtail
muscle was sequentially sampled from each individual after the diet switch (0 to 753 days) and
analyzed for δ15N and δ13C, allowing for calculation of diet-tissue discrimination factors (DTDFs)
from two isotopically different diets (low δ15N and δ13C: pellets; high δ15N and δ13C: fish/squid) and
turnover rates of 15N and 13C. DTDFs were diet dependent: Δ15N = 5.1‰, Δ13C = 3.6‰ for pellets and
Δ15N = 2.6‰, Δ13C = 1.3‰ for fish/squid. Half-life estimates from 15N and 13C turnover rates for pooled
yellowtail were 181 days and 341 days, respectively, but varied considerably by individual (15N: 99–239
d; 13C: 158–899 d). Quantifying DTDFs supports isotopic approaches to field data that assume isotopic
steady-state conditions (e.g., mixing models for diet reconstruction). Characterizing and quantifying
turnover rates allow for estimates of diet/habitat shifts and “isotopic clock” approaches, and
observed inter-individual variability suggests the need for large datasets in field studies. We provide
diet-dependent DTDFs and growth effects on turnover rates, and associated error around these
parameters, for application to field-collected SIA data from other large teleosts.
Fundamental understanding of fish biology, feeding behavior, population dynamics, and movement patterns has
expanded in recent years due to technological advances in tools such as electronic tags for animal t racking1,2,
chemical tracer analyses3, and ‘big data’ analysis4,5. However, knowledge gaps remain for all fish species6,7, which
can be addressed with evolving tools for more comprehensive, ecosystem-based understanding and manage-
ment of fish species. Stable isotope analysis (SIA) is one tool that has rapidly expanded in marine ecosystem
studies. Ecological studies using SIA rely on the fact that marine consumers reflect the isotopic composition of
the prey they consume, which varies with prey ecology, region, and environmental c onditions8,9. This premise
has allowed researchers to investigate diet, trophic dynamics, and movements of marine p redators8,10,11 with
15 13
SIA, most commonly of nitrogen (δ N) and carbon (δ C). More recently, the quantity of SIA data for marine
predators has grown to allow for global analyses of marine predator ecology and habitat use. For example, the
synthesis of thousands of SIA values across ocean basins has allowed for characterization of global trophic
geography in s harks12 and tunas13.
Underlying consumer SIA data are complex physiological and ecological isotopic dynamics, which ultimately
determine consumer SI values. Isotopic compositions of consumer tissues reflect those of diet, which guided early
applications of SIA to feeding ecology. Consumer tissue δ15N and δ13C increase systematically during trophic
transfer due to fractionation and re-routing dynamics of amino acids and other organic compounds during
digestion, assimilation, and tissue t urnover14. The resultant differences between consumer and diet SIA values,
1
Department of Organismic and Evolutionary Biology, Harvard University, Cambridge, MA 02138,
USA. 2Department of Integrative Biology, University of Windsor, Windsor, ON N9B 3P4, Canada. 3Fisheries
Resources Division, Southwest Fisheries Science Center, National Marine Fisheries Service (NMFS), National
Oceanic and Atmospheric Administration (NOAA), La Jolla, CA 92037, USA. *email: daniel.madigan@
stonybrook.edu
Scientific Reports | (2021) 11:4466 | https://doi.org/10.1038/s41598-021-83880-z 1
Vol.:(0123456789)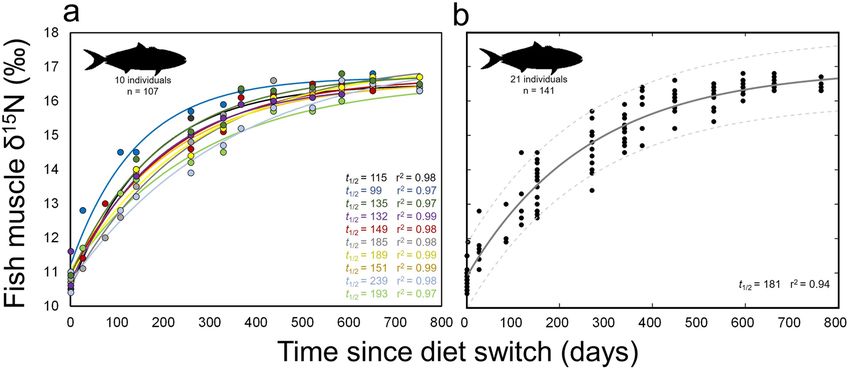
www.nature.com/scientificreports/
Figure 1. Schematic showing experimental design to quantify dynamics of δ15N and δ13C in captive California
yellowtail Seriola dorsalis. Sizes (cm) below x-axis show approximate changes in yellowtail fork length during the
phases of the experiment. Lines showing changes in yellowtail muscle δ15N (solid line) and δ13C (dashed line)
are theoretical changes based on typical isotopic turnover dynamics in teleosts.
represented by several equivalent terms (diet-tissue discrimination factors [DTDFs], trophic discrimination
factors [TDFs], or trophic enrichment factors [TEFs]), have been used for trophic level estimates and food web
reconstruction. DTDF estimates for δ15N (Δ15N) have generally been higher than those for δ13C (Δ13C), and an
early synthesis of DTDF values reported a widely used, multi-taxon mean of 3.4 (± 1.0 SD) for Δ15N and 0.4
(± 1.3 SD) for Δ13C10. Many early ecological studies applied these first multi-taxon DTDF estimates to estimate
diet and trophic position, but subsequent laboratory studies have provided many more taxon- or species-specific
DTDFs, demonstrating the importance of applying specific DTDF values due to substantial variability across
taxa, tissue types, and diet14,15. While statistical frameworks and software packages that reconstruct predator
diets using SIA (e.g. MixSIR, SIAR)16,17 are able to incorporate error around DTDF v alues18, mixing models are
better parameterized by laboratory studies that provide more accurate DTDF e stimates19.
Understanding isotopic turnover rates in predator tissues is required to quantify timing of diet shifts or ani-
mal movements. Following a shift to an isotopically different diet, predator tissue δ15N and δ13C values change
over time until reaching consistent values that reflect the new diet (i.e., steady-state conditions). These rates are
largely dictated by the physiological processes of new tissue synthesis (growth) and anabolic and catabolic ‘tissue
turnover’ processes (broadly referred to here as ‘metabolism’). Captive studies in fish have shown muscle isotopic
turnover rates as low as several days (young-of-the-year [YOY] winter flounder Pseudopleuronectes americanus20)
to months (summer flounder Paralichthys dentatus, arctic sculpin Myoxocephalus scorpioides21,22) to > 1 year
(mado Atypichthys latus, Pacific bluefin tuna Thunnus orientalis23,24). These differences are largely driven by fish
size and life-stage; since relative growth (proportion of new mass to initial mass over time) is a primary driver of
isotopic turnover dynamics, turnover rates will vary with relative growth rates ontogenetically (faster turnover
in younger fish) and inter-specifically (faster turnover in fish with high growth rates). Isotopic turnover rates
have most often been described with exponential fit models, allowing for calculation of half-life (t0.5) values for
comparison across studies25–27. Recent reviews and meta-analyses of laboratory-derived isotopic turnover rates
have reported predictable allometric relationships of slower turnover rates (higher t0.5) with increasing fish body
size25–27. Turnover rates are also tissue-dependent; more metabolically active ‘fast-turnover’ tissues (e.g. blood
plasma, liver) and ‘slow-turnover’ tissues (e.g. muscle, bone collagen) can reflect a shift in diet of large predatory
fish in timeframes of days/weeks or months/years, respectively28.
Laboratory-based experiments, under controlled or semi-controlled conditions, quantifying species- and
lifestage-specific isotopic turnover improve the understanding of stable isotope dynamics and have direct appli-
cations to wild SIA studies. Turnover rates and the time to steady-state allow researchers to put diet estimates in
temporal context by roughly demonstrating the dietary timeframes represented by SIA composition of various
tissues. Quantified turnover rates also allow applied ‘isotopic clock’ techniques29–32, which use isotopic endmem-
bers (of predator, diet, and/or region) and measured predator SIA values to estimate the timing since a shift in
diet and/or habitat. Measured SIA values in fish that recently migrated thus allow retrospective reconstructions
of large-scale movements, such as entire river migrations by lake sturgeon (Acipenser fulvescens)33 and trans-
Pacific migrations by Pacific bluefin t una34. However, accuracy of these migratory timeframes is maximized
with accurate species-specific isotopic turnover rates, which are best calculated from laboratory experiments.
The California yellowtail (Seriola dorsalis) is an ecologically and economically important teleost predator in
the California Current Ecosystem. At typical capture sizes (40 cm to > 100 cm), yellowtail are a relatively large-
sized, highly mobile, high trophic level predator in pelagic and coastal e cosystems35. The lack of experimentally-
derived DTDFs and turnover parameters for yellowtail limits the interpretation of SIA data for (1) temporal and
spatial patterns in trophic dynamics and (2) timing of movement patterns, as yellowtail are known to shift from
pelagic to coastal habitats with increasing size36,37. To calculate these isotopic parameters for this species, we
raised YOY yellowtail to steady-state on a low δ15N and δ13C diet for 525 days, then switched larger (~ 40 cm)
yellowtail to a high δ15N and δ13C diet and sequentially sampled muscle from individuals over 753 days (see
Fig. 1). This allowed for quantification of DTDFs in yellowtail, as well as isotopic turnover in individuals and
Scientific Reports | (2021) 11:4466 | https://doi.org/10.1038/s41598-021-83880-z 2
Vol:.(1234567890)www.nature.com/scientificreports/
Group Isotope Tissue n Mean (SD) C:N (SD) (mass)
Feed
δ13C – 10 − 22.6 (0.4) 7.0 (0.5)
Pellets
δ15N – 10 5.8 (0.1) 7.0 (0.5)
δ13C WM 6 − 19.7 (0.1) 3.2 (0)
Mackerel
δ15N WM 6 13.5 (0.1) 3.2 (0)
δ13C WM 6 − 17.9 (0.5) 3.4 (0)
Squid
δ15N WM 6 14.7 (0.3) 3.4 (0)
Fish/squid mean δ13C WM 12 − 19.0 (0.9) –
Weighted by mass δ15N WM 12 14.0 (0.8) –
DTDF
Yellowtail Mean SD Time in capt
Dietlow δ15N WM 21 10.9 (0.3) 3.6 (0.3) 5.1 0.3 525 d
Dietlow* δ13C WM 21 − 19.0 (0.1) 3.6 (0.3) 3.6* 0.1 525 d
Diethigh δ15N WM 10 16.5 (0.2) 3.4 (0.2) 2.6 0.2 > 595 d
Diethigh δ13C WM 10 − 17.7 (0.4) 3.4 (0.2) 1.3 0.4 > 595 d
Table 1. Mean δ15N, δ13C, and C:N ratio values of California yellowtail (Seriola dorsalis) muscle tissue, captive
feed, and calculated diet-specific DTDF values for pellet and fish/squid diet. δ13C values are arithmetically
lipid-corrected according to Logan et al.55. *The δ13C values of Dietlow (pellet diet) could not be corrected for
carbonate and or lipid due to unknown pellet composition; this DTDF is based on bulk pellet δ13C values.
across the study population. These isotopic parameters can be applied to field-collected SIA data for active, high
trophic level teleosts that currently lack laboratory-derived SIA data.
Results
Yellowtail diet δ15N and δ13C values. The δ15N and δ13C values of pellet feed (n = 10) were 5.8 ± 0.1‰
SD and − 22.6 ± 0.4‰, respectively. The δ15N and δ13C values of Pacific mackerel (n = 6) and market squid
(n = 6) were (mackerel) 13.5 ± 0.0‰ and − 19.7 ± 0.1‰ and (squid) 14.7 ± 0.3‰ and − 17.9 ± 0.5‰, resulting in
weighted mean fish/squid (weighted by % fish and % squid presented to yellowtail; 68% and 32% respectively)
diet δ15N and δ13C values of 14.0 ± 0.8‰ and − 19.0 ± 0.9‰ (Table 1).
Diet‑tissue discrimination factors. We calculated two DTDF values for δ15N and δ13C (Δ15N and Δ13C)
from captive yellowtail due to the demonstrated correlation between fish DTDF values and diet δ15N and δ13C
values (Caut et al. 2009). The two diets used here differed highly in δ15N and δ13C values (Table 1). For YOY yel-
lowtail fed pellet feed (low δ15N and δ13C diet) for 525 d, Δ15Nlow and Δ13Clow were 5.1 ± 0.3‰ and 3.6 ± 0.1‰,
respectively (n = 21) (Table 1). Individual yellowtail Δ15Nlow values ranged from 3.4–3.9‰ and Δ13Clow val-
ues from 4.6–5.7‰. For larger yellowtail fed fish/squid (high δ15N and δ13C diet) for 595–753 d, Δ15Nhigh and
Δ13Chigh were 2.6 ± 0.2‰ and 1.3 ± 0.4‰, respectively (Table 1). Individual yellowtail Δ15Nhigh values ranged from
2.3–2.9‰ and Δ13Chigh values from 0.7–2.0‰.
We compared the observed relationship between DTDF and diet δ15N and δ13C values with relationships
quantified previously in fishes by Caut et al. (2009) and Hussey et al. (2014). We used experimental diet δ15N and
δ13C values to calculate estimates of Δ15Nlow and Δ13Clow and Δ15Nhigh and Δ13Chigh from Caut et al. (2009) (Eqs. 6,
7), and of Δ15Nlow and Δ15Nhigh from Hussey et al. (2014) which only quantified the relationship for Δ15N (Eq. 8).
Calculated estimates were: Δ15Nlow = 4.2‰; Δ13Clow = 2.0‰; Δ15Nhigh = 2.1‰; Δ13Chigh = 1.2‰ (Caut et al. 2009);
15
Nlow = 4.4‰; Δ15Nhigh = 2.2‰ (Hussey et al. 2014). By modifying the constants in Eqs. 6 and 7 (Caut et al. 2009)
to fit results here, we provide predictive equations for DTDFs of yellowtail based on diet δ15N and δ13C values:
�15 Nyellowtail = −0.317(δ 15 Ndiet ) + 6.939 (1)
�13 Cyellowtail = −0.639(δ 13 Cdiet ) − 10.839 (2)
Time‑based δ15N and δ13C turnover. Pooled yellowtail δ15N values increased from 0–378 d, increasing
from 10.9 ± 0.3‰ to 15.8 ± 0.6‰ over this period (Fig. 2, Table 2). After 378 d, time-based increases in δ15N
were lower, reaching apparent steady-state at 595 d at 16.4 ± 0.2‰ (Fig. 2). δ15N values then remained consistent
to 753 d (16.4 ± 0.2‰). The exponential model fit grouped yellowtail data well (r2 = 0.94; Fig. 2) and provided a
time-based estimate of 15N t0.5 of 181 d (Fig. 2b) (see Table 3 for model parameters and 95% confidence intervals).
Individual yellowtail δ15N turnover rates were variable, with a range of individual t0.5 values of 99–239 d
(Fig. 2a). All individuals reached consistent, steady-state values by 595 d, and high individual t0.5 values were
driven by relatively low δ15N values at intermediate timesteps, resulting in exponential model fits that reached
asymptotic steady-state values late in the experiment for some individual fish (Fig. 2a). However, intra-individual
Scientific Reports | (2021) 11:4466 | https://doi.org/10.1038/s41598-021-83880-z 3
Vol.:(0123456789)www.nature.com/scientificreports/
Figure 2. Change of δ15N with time after diet switch in muscle of (a) individual and (b) grouped captive
California yellowtail Seriola dorsalis. (a) Points represent individual δ15N measurements and lines show
associated model fits, colored by individual. Values t1/2 is the half-life of 15N for each individual and r2 values
are shown for model fit to each individual. Data shown only for yellowtail that were in captive conditions for
enough time to reach steady-state with new diet. (b) Model fit (solid line) and 95% confidence bounds (dashed
lines) for all yellowtail sampled. Grouped data include fish that were removed from captivity or suffered
mortality during the experimental period.
n Time in captivity (d) WM δ15N (SD) WM δ13C (SD)
21 0 10.9 (0.3) − 19.0 (0.1)
9 1–99 11.9 (0.6) − 18.8 (0.2)
22 100–199 13.5 (0.7) − 18.4 (0.2)
12 200–299 14.6 (0.7) − 18.2 (0.2)
21 300–399 15.4 (0.6) − 18.0 (0.2)
12 400–499 16.0 (0.5) − 17.7 (0.2)
20 500–599 16.3 (0.3) − 17.6 (0.2)
10 600–700 16.5 (0.2) − 17.4 (0.2)
10 753 16.4 (0.2) − 17.5 (0.1)
Table 2. Mean stable isotope values and time in captivity for all California yellowtail (Seriola dorsalis) used
in this study. δ13C values are arithmetically-corrected for lipid content based on tissue-specific (fish muscle)
algorithms from Logan et al55. Note not all fish could be sampled at every sampling period, resulting in varying
sample size (n) across the experimental period.
Parameter (95% CI)
Isotope a λ c r2 t0.5 (d) (95% CI) t0.95 (d)
15
δ N − 6.0 (−6.4, -5.7) 0.0038 (0.0033, 0.0043) 16.9 (16.6, 17.2) 0.94 181 (160, 210) 784
δ13C − 2.0 (−2.3, -1.7) 0.0020 (0.0015, 0.0026) − 16.9 (−17.3, −16.6) 0.91 341 (265, 478) 1473
Table 3. Parameter estimates and calculated turnover rate metrics from time-based exponential fit models for
δ15N and δ13C values of muscle in California yellowtail (Seriola dorsalis). Estimated half-life (t0.5) and time for
95% isotope turnover (t0.95) (days) is shown for each isotope.
turnover dynamics were consistent with first-order exponential model predictions, with high exponential model
fits across individual yellowtail (r2 range 0.97–0.99, mean 0.98 ± 0.1; Fig. 2a) and higher r2 values for all individu-
als than for the single model fit across all yellowtail (r2 = 0.94; Fig. 2b).
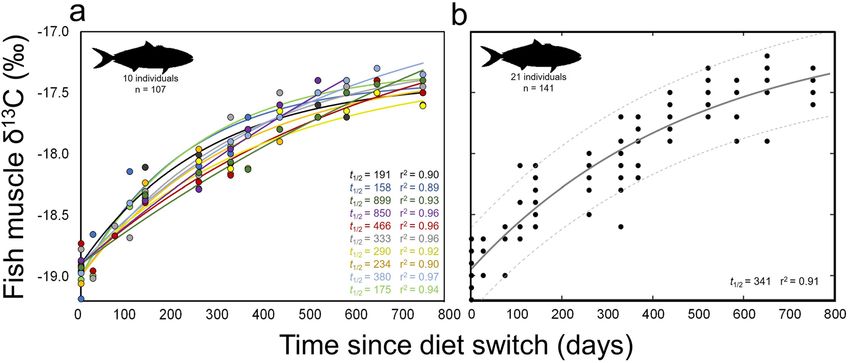
Pooled yellowtail muscle δ13C values also increased consistently throughout the experiment (Fig. 3 and
Table 2). δ13C values increased from 0–532 days, increasing from -19.0 ± 0.1‰ to − 17.6 ± 0.2‰ over this period
(Fig. 3). Subsequent δ13C values were generally consistent, reaching − 17.5 ± 0.1‰ at 753 d. Model fits showed
an asymptote at longer time periods than for δ15N both for individual yellowtail (Fig. 3a) and grouped data
Scientific Reports | (2021) 11:4466 | https://doi.org/10.1038/s41598-021-83880-z 4
Vol:.(1234567890)www.nature.com/scientificreports/
Figure 3. Change of δ13C with time after diet switch in muscle of (a) individual and (b) grouped captive
California yellowtail Seriola dorsalis. (a) Points represent individual δ13C measurements and lines show
associated model fits, colored by individual. Values t1/2 is the half-life of 13C for each individual and r2 values
are shown for model fit to each individual. Data shown only for yellowtail that were in captive conditions for
enough time to reach steady-state with new diet. (b) Model fit (solid line) and 95% confidence bounds (dashed
lines) for all yellowtail sampled. Grouped data includes fish that were removed from captivity or suffered
mortality during the experimental period.
(Fig. 3b). The exponential model fit grouped yellowtail data well (r2 = 0.91; Fig. 3b and Table 3) and provided a
time-based estimate of 13C t0.5 of 341 d (Fig. 3b; see Table 3 for model parameters and 95% confidence intervals).
Across individual yellowtail, turnover rates of δ13C were more variable than those of δ15N, with a range of
individual δ13C t0.5 values of 158–899 d (Fig. 3a). All individuals reached steady-state values by the end of the
experiment, though the dynamics of δ13C change at earlier timesteps resulted in exponential model fits that
reached asymptotic steady-state values late in the experiment, or not at all, in individual fish (Fig. 3a). As for
δ15N, intra-individual turnover of δ13C was fairly consistent with the first-order exponential model (r2 range
0.89–0.97, mean 0.93 ± 0.3; Fig. 3a); most individual model fits were better than the single model fit across all
yellowtail (r2 = 0.91; Fig. 3b).
Growth‑based δ13C and δ15N turnover. Yellowtail that remained in captive conditions for adequate time
periods for individual turnover estimates (n = 10) showed substantial but variable growth in captivity. Relative
growth in mass WR (see Eq. 13) by the end of the experimental period (753 d) ranged from 1.7–3.5 (mean
2.7 ± 0.5 SD). Growth rate constants for individual fish ranged from 0.0008 to 0.0023 d −1 (0.0017 ± 0.0005 d−1).
The model-estimated growth rate constant (kʹ; see Eq. 15) for the grouped population of yellowtail (0.0017 d−1)
was the same as the mean across individuals (0.0017 ± 0.0005 d−1).
Change in yellowtail δ15N and δ13C values were well described by exponential model fits to WR (Fig. 4,
Table 4). Model fit of WR to change in δ15N was slightly better (r2 = 0.96) than that for δ13C (r2 = 0.91) (Fig. 4,
Table 4). For δ15N, the relative growth in mass required for 50% turnover and 95% turnover was 1.14 and 1.77,
respectively (Fig. 4a, Table 4). For δ13C, the WR required for 50% turnover and 95% turnover was 1.15 and 1.82,
respectively (Fig. 4b, Table 4).
Relative proportion of isotopic turnover due to growth and metabolic processes. Sequential
sampling of individual yellowtail allowed for calculation of the proportion of isotopic turnover due to growth
(Pg) and proportion of turnover due to metabolic processes (Pm) (see Eqs. 19, 20) across individual fish and the
grouped population of captive fish. Overall, growth contributed more to turnover of 13C (Pg = 84%, Pm = 16%)
than 15N (Pg = 44%, Pm = 56%) for the grouped population of captive yellowtail. These proportional estimates
varied in individual yellowtail. Pg for turnover of 15N ranged from 26 to 45% (36 ± 8%), and Pg for turnover of
13
C ranged from 40 to 100% (65 ± 26%). Metabolic processes Pm contributed to the majority of 15N turnover in
all fish (55–74%, 64 ± 8%). For 13C turnover, Pm was more variable, contributing 0% to several fish, but to the
slight majority (51–60%) of 13C turnover in 4 of 10 fish (0–60%, 35 ± 26%). Growth rate kʹ of individual fish was
significantly correlated with Pg for turnover of both isotopes, with faster growth rates resulting in higher propor-
tion of turnover due to growth for 15N (linear regression, P = 0.02) and 13C (linear regression, P = 0.03) (Fig. 5).
Applicability to field data. Based on three metrics (variance, range, standard deviation), yellowtail muscle
δ15N values showed the lowest variability at the beginning (t = 0 d) and end (t = 753 d) of the diet switch experi-
ment (Fig. 6). Variability rapidly increased after the diet switch and was highest between 100–400 d (Fig. 6).
These temporal patterns of variability were less evident for δ13C, but δ13C values also were generally most con-
sistent at the beginning and end of the experimental period (Fig. 6).
Scientific Reports | (2021) 11:4466 | https://doi.org/10.1038/s41598-021-83880-z 5
Vol.:(0123456789)www.nature.com/scientificreports/
Figure 4. Isotopic change with fish growth for (a) δ15N and (b) δ13C in captive California yellowtail Seriola
dorsalis. Points represent individual measurements and lines show associated model fits (solid lines) and 95%
confidence intervals (dashed lines). Model equation and associated parameters (95% confidence intervals)
shown for both isotopes. G0.5 and G0.95 show the amount of relative growth by mass ( massfinal/massinitial) required
for 50% turnover and 95% turnover, respectively, of each isotope in yellowtail muscle.
Parameter (95% CI)
Isotope a λ c r2 G0.5 G0.95
δ15N − 10.2 (−29.1, 9.1) 5.242 (3.327, 7.156) 16.4 (16.2, 16.6) 0.96 1.14 1.77
δ13C − 20 (−68, 28) 5.0 (2.590, 7.407) − 17.6 (−17.6, −17.5) 0.91 1.15 1.82
Table 4. Parameter estimates and 95% confidence intervals for relative growth-based (WR) exponential fit
models for δ15N and δ13C values of muscle in California yellowtail (Seriola dorsalis). Estimated growth-based
half-life (G0.5) and growth required for 95% isotopic turnover (G0.95) is shown for each isotope.
Figure 5. Proportion of isotopic turnover in muscle due to growth (Pg) increases with growth rate in yellowtail
Seriola dorsalis. Points represent individual measurements of δ15N (filled circles) and δ13C (open circles) and
lines show associated linear fits (dark dashed lines) and 95% confidence intervals (light dashed lines). Positive
relationships were significant between Pg and kʹ for both δ13C (linear regression, P = 0.03) and δ15N (linear
regression, P = 0.02).
Scientific Reports | (2021) 11:4466 | https://doi.org/10.1038/s41598-021-83880-z 6
Vol:.(1234567890)www.nature.com/scientificreports/
Figure 6. Variability of muscle δ15N and δ13C with time across individual California yellowtail Seriola
dorsalis following a diet switch in captivity. Points represent individual measurements and dashed lines show
associated polynomial model fits (solid lines) for various metrics of variability: variance (black), range (grey)
and SD (white). Note that through the experimental period, variability was lowest at the beginning and end,
representing steady-state with low δ15N and δ13C diet (pellets) and high δ15N and δ13C diet (fish/squid),
respectively.
Figure 7. Bayesian mixing model diet estimates over time in captive California yellowtail Seriola dorsalis,
showing time (days) required for mixing models to accurately reflect diet switch in yellowtail muscle. Points
represent median diet proportion estimates and error bars show 95% credible intervals. Arrows show the
approximate time for yellowtail muscle to represent 50% new diet and 100% new diet. Note that ~ 520 days were
required for mixing model estimates to correctly show 100% of new diet, representing ~ 3 half-lives for 15N (181
d) and ~ 1.5 half-lives for 13C (341 d), as calculated from turnover rates in this experiment.
At the start of the diet switch, when yellowtail began feeding on 100% fish/squid, Bayesian mixing model
estimates showed 100% pellet diet at t = 0 (Fig. 7). After ~ 160 days of fish/squid diet, yellowtail muscle δ15N and
δ13C values resulted in mixing model estimates of 50% pellets, 50% fish/squid (Fig. 7). Approximately 520 days
were required for mixing model estimates to reflect 100% fish/squid diet (Fig. 7), representing ~ 3 15N half-life
periods and ~ 1.5 13C half-life periods.
Discussion
Species-specific turnover experiments provide crucial parameters for application to stable isotope ecology stud-
ies. We reared a large teleost in semi-controlled conditions (here, controlled diet with fluctuating temperature
and salinity) to provide DTDFs and isotopic turnover estimates, which are relatively rare due to the difficulty
of large fish husbandry and the timeframes required for such experiments. We demonstrate that DTDFs are
Scientific Reports | (2021) 11:4466 | https://doi.org/10.1038/s41598-021-83880-z 7
Vol.:(0123456789)www.nature.com/scientificreports/
diet-dependent in California yellowtail, similar to other fish reared on similar diets, and provide DTDF values
and predictive algorithms that allow for diet-dependent discrimination factors to be estimated for active large-
bodied teleosts. The relatively long turnover rates reported here (steady-state conditions after > 1 yr) demonstrate
the long timeframes required for wild fish to reach steady-state conditions with local diet. Finally, turnover rates
provide parameters for field-based estimates of diet shifts and movements, and growth-based models allow for
scaling of reported turnover rates with animal size and associated changes in relative growth rates.
Yellowtail Δ15N and Δ13C estimates were strongly influenced by diet. Δ15N and Δ13C were 5.1‰ and 3.6‰
for low δ15N and δ13C diet (pellets) and 2.5‰ and 1.3‰ for high δ15N and δ13C diet (fish/squid). Our Δ15N
and Δ13C values are different from means that have been reported in DTDF reviews: (Δ15N) 3.4‰10,38, 3.2‰39,
2.9‰40, 2.5‰41, and 2.0‰42 and (Δ13C) 0.4‰10,42 and 0.5‰40. However, taxon- and species specific DTDFs have
proven to be broad, and our values fit within the wide ranges of specific DTDFs reported across reviewed studies
(Δ15N = − 3.2–9.2‰ and Δ13C = − 8.8–6.1‰14). Δ13C values typically have been described as low, citing minimal
fractionation of 13C between trophic levels and thus being useful as tracking the source of productivity in the diet
of upper trophic level consumers. However, our Δ13C values of 3.6‰ and 1.3‰ suggest a much higher degree of
fractionation of 13C. However, our calculated Δ13Clow, from pellet diet, should be interpreted with caution as pellet
composition was unknown, pellet C:N was high (7.0 ± 0.5), and unknown pellet composition limited assessment
of the effects of carbonates and/or lipids and precluded appropriate arithmetic correction of pellet δ13C values.
Despite the wide ranges around reported DTDF means above14, those means often have been (and continue
to be) applied to field data in analyses such as mixing models, particularly when species-specific laboratory-
derived DTDFs are lacking, with application of Δ15N = 3.4‰ and Δ13C = 0.4‰10 being particularly c ommon14.
However, inappropriate application of DTDFs can substantially affect results and interpretations of field studies.
DTDFs are most commonly used in Bayesian mixing models (e.g. MixSIR, SIAR)16,17 which are highly sensitive
to inaccurate DTDFs, producing highly erroneous estimates when DTDFs vary by > 1‰ and potentially l ess14,43.
While many factors can influence DTDFs, including consumer physiological state, diet composition and quality,
consumer size, age, and tissue composition14, recent studies have demonstrated a strong negative relationship
between DTDFs and diet δ15N and δ13C values14,15. Our calculated DTDFs, while different from commonly
applied mean values, were similar to those estimated from predictive equations (based on diet δ15N and δ13C
values) in both Caut et al. (2009) and Hussey et al. (2014) (see Results). Yellowtail Δ15Nhigh and Δ13Chigh estimates
were also similar to those of Pacific bluefin tuna (Thunnus orientalis) (Δ15N = 1.9 ± 0.4‰; Δ13C = 1.8 ± 0.3) fed a
similar diet of California Current-sourced squid and sardine24. This both corroborates the importance of diet
δ15N and δ13C in determining DTDF and provides a slightly modified predictive equation (Results, Eqs. 1, 2),
calculated from our two DTDFs, that can be applied to field-collected yellowtail data and potentially to other
similar fish (e.g., large-bodied ectotherms) when species-specific estimates are not available.
Bayesian mixing models allow for multiple DTDFs to be entered as inputs. However, Caut et al. (2009) found
that > 70% of studies used a single DTDF even when diet resources had substantially different δ15N and δ13C
values. Our different DTDFs in the same yellowtail, when fed isotopically distinct diets, supports the assertion
that a single DTDF is inappropriate in such cases. Based on our results, we recommend using our yellowtail-
specific algorithm for field SIA data from yellowtail and potentially from similar fish. Since our algorithm is only
calculated from the two DTDFs determined here, the equations from Caut et al. (2009) and Hussey et al. (2014)
may also provide more robust and useful alternative and/or complementary DTDFs than static, mean DTDFs
when applying Bayesian mixing model approaches to field data.
Yellowtail muscle turnover rates of 15N (t0.5 = 181 d) and 13C (t0.5 = 341 d) were higher (i.e., isotopic turnover
in muscle took longer) than many values reported for teleosts, which have shown half-lives on the order of days
to weeks (see literature syntheses25–27). While the incorporation of prey into consumer tissue and associated iso-
topic fractionation is a complex process, influenced by growth rate, thermoregulation, environment, diet quality,
and nutrient routing, synthesis studies have shown a strong relationship between turnover rate and body size in
fish25–27. However, most fish in captive turnover experiments are relatively small (< 1 kg, and often less than 100
g24–26). Our turnover rates were similar to larger-bodied (> 1 kg) teleosts and chondrichthyans (e.g. leopard shark
Triakis semifasciata44; sandbar shark Carcharhinus plumbeus45; Pacific bluefin t una24; gag grouper Mycteroperca
microlepis46). In addition, our turnover rates were comparable to those that would be estimated from body size
alone for vertebrate ectotherm muscle (~ 100–200 d)26,27, suggesting that captive yellowtail turnover dynamics
were generally typical for ectothermic fish of their size, as well as the endothermic Pacific bluefin tuna.
Our results differed from the relatively consistent turnover rates of 13C and 15N in muscle that have been found
across several taxa, and are predicted by metabolic scaling theory26,27. In contrast, we found slower turnover
rates of yellowtail muscle 13C that were roughly 2 × those of 15N; similar dynamics were previously described in
large-bodied (> 5 kg) Pacific bluefin tuna and sandbar s harks24,45. It is possible that this was partially driven by
relative differences in yellowtail δ13C and δ15N endmember values, as the higher change of δ15N (~ 6‰) than
δ13C (~ 1.5‰) (Fig. 2, 3) would likely drive more rapid change in 15N turnover in early stages of the experiment.
Yellowtail were also fed a mixed fish/squid diet, and the possibility of intra-individual feeding variability (different
proportions of fish and squid) and the different δ13C values of fish and squid (−19.7 and −17.9‰, respectively)
could have driven different individual turnover rates and overall variability in turnover rates of δ13C. While
several other mechanisms exist that potentially drive differences between 13C and 15N turnover rates in muscle
(e.g., contributions of red blood cells, respiratory exchanges of C; Thomas and Crowther 2015), it is most likely
that the relative contributions of growth and metabolic processes drive these differences in active, large-bodied
fish. In larval and juvenile fish, muscle isotopic turnover is generally dominated by rapid growth20,22,47. This is well
demonstrated in bluefin tuna; larval (< 1 g) Atlantic bluefin Thunnus thynnus showed a 15N half-life of 2.5 days
with 100% turnover attributed to growth48, while sub-adult (> 4.5 kg) Pacific bluefin showed a 15N half-life of
167 days with 38% turnover attributed to growth24. In yellowtail here, growth contributed more to 13C turnover
(84%) than to 15N turnover (44%), and growth was also found to contribute more to turnover of 13C (59%) than
Scientific Reports | (2021) 11:4466 | https://doi.org/10.1038/s41598-021-83880-z 8
Vol:.(1234567890)www.nature.com/scientificreports/
15
N (38%) in large-bodied Pacific b luefin24. Turnover rates of individual yellowtail provide additional insight to
the relative importance of variable growth rates, as intra-specific differences in growth rate significantly affected
turnover rates of both 13C and 15N (Fig. 5).
It is reasonable that as fish size increases and relative growth decreases, metabolic processes will play a
greater role in isotopic turnover49,50. However, why this would differentially affect 15N and 13C is unclear, and
likely includes metabolic dynamics of tissue protein turnover, routing of amino acids and lipids into muscle tis-
sue proteins, and fractionation processes during catabolism. The isotopic dynamics of these processes are not
well enough described or understood to assess their relative influence on 15N and 13C turnover22,26,27. While the
processes underlying this result require further investigation, the implication is that δ15N and δ13C values of wild
large-bodied fish should be considered independently, as δ13C values will represent longer timeframes of past
resource use. This will influence both Bayesian mixing model diet reconstructions (as δ13C values will represent
less current diet inputs than will δ15N) and isotopic clock approaches (that apply specific turnover rates of 15N
and 13C to isotopic data to estimate time since diet shifts and/or migrations).
Though individual yellowtail growth rates in identical captive conditions varied (Wr = 2.7 ± 0.5;
kʹ = 0.0017 ± 0.0005 d−1), models of relative growth Wr versus change in δ15N and δ13C fit well (r2 = 0.96 and 0.91,
respectively). The similarity of the growth required for 50% isotopic turnover (G0.5) for 15N and 13C (14% and
15%, respectively) suggests that turnover dynamics of both isotopes are similarly influenced by growth. Since
time-based estimates of 15N turnover were substantially shorter than 13C, this reinforces the likelihood that
metabolic processes play a more influential role in turnover of muscle 15N in yellowtail of this size. Model fits
suggest that the relative growth in mass necessary for 95% turnover (G0.95) of 15N and 13C will occur with 77%
and 82% increase in growth by mass, respectively (Table 4). Since relationships of age and growth, and length
versus mass, have been described for California y ellowtail35,37, these estimates can be scaled to larger or smaller
yellowtail to estimate time-based estimates. In general, turnover rates will decrease with increasing yellowtail
size due to the decrease in relative growth rates with size. For example, based on relationships in Baxter et al.
(1960), the mass doubling times (Wr = 2) for a 1 kg, 2 kg, 4 kg, and 8 kg yellowtail are ~ 350, 550, 1000, and > 2000
d, respectively. These size-specific differences in relative growth will in turn change the time necessary for muscle
isotopic turnover.
Substantially less growth was required for turnover of 15N and 13C than in similarly sized Pacific bluefin
tuna with only slightly lower specific growth rates (0.0016 d−1) than yellowtail (0.0017 d−1), as 72% and 209%
increases in growth were required for 50% turnover of 15N and 13C, respectively, in Pacific bluefin tuna muscle24.
This again indicates the relative importance of metabolic processes in turnover of muscle 15N and 13C in active,
large-bodied fish. As regional endotherms, Pacific bluefin tuna have higher internal temperatures and conse-
quently higher metabolic demands than e ctotherms51, presumably leading to increased rates of the metabolic
functions that influence turnover of 13C and 15N. As such, growth-based turnover estimates here may be more
appropriately applied to other ectothermic teleosts, while those from Pacific bluefin may be more appropriate
for other endothermic fish (e.g., other Thunnus species, lamnid sharks, opah Lampris spp).
Our results lend insight into the application of various laboratory-derived isotopic parameters to wild fish.
First, our different DTDFs from diets of different isotopic composition strongly support other studies that call for
diet-based DTDFs14,15. Caut et al. (2009) found that > 33% of studies used Δ15N and Δ13C values that were > 2‰
different than estimated diet-dependent discrimination factors (DDDFs), which would render mixing model
results highly misleading. In the absence of specific DTDFs for the study species, estimated DDDFs from algo-
rithms provided in Caut et al. (2009) and Hussey et al. (2014) may provide a useful starting point.
Second, the variability of δ15N and δ13C observed at the start, middle, and end of the diet switch experiment
suggests that intra-specific variability may be lower for end-member isotopic parameters (DTDFs) than mid-
member parameters (turnover rates). Accordingly, applied DTDFs will be more reliable than turnover rates
in isotopic clock approaches. Isotopic clocks have been applied to large active teleosts with some s uccess31; in
one study, an isotopic clock applied to Pacific bluefin tuna suggested two ‘pulses’ of arrival in a new isotopic
environment34, and these results were later corroborated by an extensive electronic tagging study of juvenile
bluefin52. However, that isotopic clock used a bootstrapping technique incorporating the error around turnover
rates, was applied to a large sample size (n = 428 individuals), and showed wide variability of arrival time estimates
around peak arrival times34. Consequently, application of an isotopic clock to one or several individuals may
yield highly inaccurate results depending on prior isotopic turnover rates in those specific individuals (which
cannot be measured). As such, we suggest that the turnover rates here be used in analytical frameworks that
incorporate uncertainty and, if possible, be applied to large datasets.
Third, an ongoing question with Bayesian mixing model diet reconstructions is the time required for consum-
ers, and mixing model estimates, to reflect current feeding conditions. Our application of the Bayesian mixing
model MixSIR to yellowtail feeding on fish/squid showed that ~ 520 days were required to reflect this diet. How-
ever, contrary to expectations, this timeframe did not require 3–4 half-life periods for both isotopes and was not
limited by the isotope with slower turnover (13C), which would have required > 1000 days (≥ 3 half-lives of 13C)
to reflect current diet. The limiting isotope was that with more rapid turnover (15N), and accurate mixing model
estimates required ~ 3 half-life periods of that isotope. Thus while mixing model applications must continue to
consider the prior timeframes represented by diet estimate outputs, estimates may require less time to reflect
current feeding than expectations from turnover rates alone. Further analyses using simulated or lab-derived
data will further clarify these dynamics to constrain the timeframes represented by mixing model outputs.
The challenges of rearing active, fast-growing teleosts in captivity while tracking diet and isotopic turnover
make fully controlled conditions difficult to maintain. In this study, diet type, quantity, and ratios were main-
tained, but seawater temperature and salinity were dependent on local conditions (though temperature was
monitored, and relatively constant at ~ 18 °C). Individual fish grew at different rates despite uniform rearing
conditions; while variable fish size may have influenced turnover rates and DTDFs (due to physiological changes
Scientific Reports | (2021) 11:4466 | https://doi.org/10.1038/s41598-021-83880-z 9
Vol.:(0123456789)www.nature.com/scientificreports/
during growth), it also allowed for investigation of the relationship of growth and turnover rates (Fig. 4). DTDF
estimates are also complicated by the inability to fully characterize the nutritional and isotopic composition of
ingested prey. In particular, the uncertainty of biological sources of commercial pellet feed, which were unavail-
able, and the high C:N of pellet feed suggests that DTDFs from this diet should be interpreted with caution.
Analysis of fish and squid muscle excludes other ingested parts (e.g., bones containing calcium carbonate). How-
ever, field studies with omnivorous animals are subject to the same uncertainty due to mixed diet, making the
uncertainty around these reported estimates appropriate for field-collected data. Tracking turnover in individual
fish provided some quantification of expected uncertainty from a mixed diet, but the parameters provided here
should be interpreted and applied with the same considerations of uncertainty and variability that are inherent
to all isotopic ecology studies.
Laboratory studies using diet switches with captive animals provide species-specific isotopic parameters that
aid interpretation of wild data. Our calculated yellowtail DTDFs corroborate diet-dependence of DTDFs and the
importance of applying multiple DTDFs in mixing model approaches. Turnover rates demonstrated that intra-
specific variability of isotopic turnover can be substantial, contributing to the error reported around turnover
rate estimates. While quantitative framework now exists for predicting DTDFs based on diet and turnover rates
based on body size, the variability in those published relationships and the variation we observed here show that
species- and lifestage-specific studies still provide the most precise isotopic parameters to ecologists for targeted
species of study, especially for large-bodied animals for which fewer data exist. Future studies will both expand
the breadth of species for which important isotopic parameters are necessary, refining models that allow for
estimates of DTDFs and isotopic turnover based on animal type, diet, body size, and lifestage. This will continue
to improve interpretations of field data using stable isotope approaches.
Materials and methods
Ethics statement. All procedures used in these experiments were in accordance with protocol SW1401
of the SWFSC Animal Care and Use Committee. YOY California yellowtail were collected under California
Department of Fish and Wildlife Scientific Collection Permit #SC-12372. Experimental protocols were approved
by the National Oceanic & Atmospheric Administration Southwest Fisheries Science Center (NOAA SWFSC)
Animal Care & Use Committee. Reporting of methods and results were in compliance with ARRIVE guidelines
for animal r esearch53.
Collection and captive husbandry of yellowtail. YOY California yellowtail (14–19 cm) were collected
from offshore floating kelp mats near San Diego, CA, USA on September 12, 2012. Fish were caught using
unbaited sabiki bait rigs, then immediately transferred to an onboard flow-through holding tank. On land, fish
were transported in the holding tank on the trailered vessel to NOAA’s SWFSC Experimental Aquaria Facility
in La Jolla, CA where they were transferred via dipnet to holding tanks. Fish were first held in 300 × 150 × 90 cm
oval tanks (~ 3200 L) with flow-through, filtered local seawater at local ambient seawater temperature (~ 18 °C)
and reared on a diet of Bio-Oregon BioTrout feed pellets. Pellets were presented immediately to newly trans-
ferred fish and fish began feeding 0–7 days after capture. Yellowtail were fed pellets 6 days/week to apparent sati-
ation. After 525 days, the now larger yellowtail (42–50 cm) were transferred to a larger circular tank (diameter
3.7 m, capacity 9600 L) with the same filtered seawater at the same ambient temperatures (~ 18 °C) and tagged in
the dorsal musculature with uniquely numbered and colored Floy plastic spaghetti tags. Yellowtail were switched
to a diet of Pacific mackerel (Scomber japonicus) and market squid (Doryteuthis opalescens), both sourced off
the coast of southern California (McRoberts Sales Co.). Yellowtail were fed mackerel and squid (by mass: 62%
mackerel, 38% squid) 6 days/week to apparent satiation.
Yellowtail muscle was sampled at t = 0 (the day of diet switch), followed by sampling intervals ranging from
27 to 119 days (mean interval 60 ± 27 days) depending on perceived condition of yellowtail and conditions for
sampling. Samples were collected by lowering tank water levels, capturing yellowtail in a rubber knotless net,
then transferring fish to vinyl cradles. Biopsy punches (Cook Quick-Core G07821) were used to remove 0.1–0.2 g
of white muscle from the dorsal musculature. When possible, fork length (FL; cm) was measured at the time of
sampling. Muscle tissue was also collected from the diet (dorsal musculature from mackerel and mantle tissue,
with the outer membrane removed, from squid) throughout the study for SIA. Sampling continued until yel-
lowtail were removed due to poor condition, suffered natural mortality, or became too large to remain in the
holding tank (t = 753 days after diet switch, the endpoint of the study).
YOY yellowtail (13.7–18.8 cm, 15.7 cm ± 1.7; 0.02–0.08 kg; 0.04 kg ± 0.02) fed well on pellet diet, increas-
ing ~ threefold in length and ~ 40-fold in mass over 525 days. After 525 days, 21 similar-sized (42–50 cm FL,
46.0 cm ± 2.5; 1.0–2.2 kg, 1.7 kg ± 0.3) individual yellowtail were selected for the diet switch experiment to fish/
squid (Fig. 1). During the course of the diet switch experiment, 11 individual fish were removed from captive
conditions before reaching apparent isotopic steady-state due to poor physical condition, lack of feeding, or
natural mortality. A total of 10 yellowtail fed consistently in captivity for a long enough period to reach appar-
ent steady-state with new diet (595–753 days) allowing calculation of individual turnover rates in these fish.
This allowed for estimates of Δ15Nlow and Δ13Clow and population-wide isotopic turnover estimates from 21 fish
subjected to the diet switch, and Δ15Nhigh and Δ13Chigh and individual yellowtail turnover estimates from 10
individuals in captive conditions for 595–753 days that reached steady-state with new diet.
SIA of yellowtail and diet. Yellowtail dorsal muscle tissue and prey muscle tissue samples were immedi-
ately stored in cryovials at − 20 °C. Feed pellets were analyzed whole. All samples were then frozen at − 80 °C and
subsequently lyophilized and ground to a homogenous powder for isotope analysis. The δ13C and δ15N values of
all samples were determined at the University of Hawaii using an on-line C–N analyzer coupled with a Delta XP
Scientific Reports | (2021) 11:4466 | https://doi.org/10.1038/s41598-021-83880-z 10
Vol:.(1234567890)www.nature.com/scientificreports/
isotope ratio mass spectrometer. Replicate reference materials of atmospheric nitrogen and V-PDB were ana-
lyzed every 10 samples, and analytical precision was < 0.2‰ for δ13C and δ15N. Isotope ratios are described by:
δ q X = (RA /Rstandard − 1) × 1000, (3)
where q is the isotope of interest, X is the element of interest, RA is the ratio of the rare to the common isotope,
and Rstandard is the isotope standard Air or V-PDB. Isotope values are reported as per mille (‰).
Arithmetic corrections of δ13C values. While both chemical and arithmetic lipid extractions have been
shown to be effective methods to correct bias in δ13C values due to lipid-content, arithmetic corrections preserve
sample integrity and simplify sample preparation54. Since studies have noted effects of chemical lipid extraction
on δ15N54–56 and suggested separate treatment for δ15N and δ13C analyses, and biopsy samples did not always
provide adequate material for such treatment (especially from smaller yellowtail), we chose to arithmetically
correct for lipid content. δ13C values of yellowtail muscle and diet items (mackerel and squid) were arithmeti-
cally lipid-normalized based on mass C:N ratios using muscle- and organism type-specific lipid normalization
algorithms55. For yellowtail and mackerel, we used a muscle-specific lipid correction algorithm derived from a
suite of fish species:
δ13 C′ = P− (P ∗ F/ C : N) + δ13 Ctissue (4)
where δ13C’ is the arithmetically-corrected δ13C value, C:N is the C/N ratio by mass of the specific sample, and P
and F are parameter constants based on measurements by Logan et al.55. For squid, we used the same equation,
with parameters P and F derived from invertebrates which included shortfin squid Illex illecebrosus. Relatively low
C:N ratios in squid (3.4 ± 0) led to minimal differences in δ13C and δ13C’ in squid. Since pellet composition was
unknown and no appropriate arithmetic δ13C correction was available, bulk δ13C values are reported for pellets.
Calculating DTDF. We calculated two DTDFs (Δ15N and Δ13C), one for pellet diet and one for fish/squid
diet. For both DTDFs, Δ15N and Δ13C were calculated from the mean difference between yellowtail muscle and
respective diet δ15N and δ13C values when yellowtail were at isotopic steady-state. Δ15Nlow and Δ13Clow were cal-
culated before the diet switch, after yellowtail fed on pellets for 525 days. Δ15Nhigh and Δ13Chigh were calculated
after yellowtail that had reached steady-state with the fish/squid diet using the weighted (by proportion mass
in diet) mean δ15N and δ13C values of fish/squid diet. DTDF values were calculated according to the equation:
�diet = mean (δyellowtail −δdiet ) (5)
15 13
where Δdiet represents the diet- (‘low’ or ‘high’) and isotope-specific DTDF, δyellowtail is the δ N or δ C value of
yellowtail that reached steady-state with diet, and δdiet is the mean δ15N or δ13C value of the food (pellet or fish/
squid). For the fish/squid diet, δ13C values were arithmetically lipid-corrected55 and weighted by the proportional
mass of each item in the diet (62% and 38%, respectively). For Δ15Nlow and Δ13Clow, we assumed YOY yellowtail
had reached steady-state with pellet diet after 525 days. This was supported by the length of time (525 days)
and relative growth ( massfinal/massinitial = ~ 2 kg/0.05 kg = ~ 40) of yellowtail on pellet feed, both of which are
substantially higher than what is demonstrably necessary for small fish to reach steady-state with diet.
Since we calculated two different DTDFs that were diet-dependent, as has been previously demonstrated14,15,
we compared our experimentally-derived DTDF values to the diet-dependent DTDF algorithms reported by
Caut et al. 2009 (Δ15N and Δ13C) and Hussey et al. 2014 (Δ15N only), both of which used DTDFs for fish to
derive linear equations for diet-based estimates of DTDFs. We used the fish white muscle equation from Caut
et al. 2009 for Δ15N and Δ13C:
�15 N = −0.281(δ15 Ndiet ) + 5.879 (6)
�13 C = −0.248(δ13 Cdiet ) − 3.477 (7)
and the fish (muscle and/or whole) equation from Hussey et al. 2014 for Δ15N:
�15 N = −0.27(δ15 Ndiet ) + 5.92 (8)
and compared those estimated DTDFs to our experimentally-derived values.
Time‑based isotopic turnover. Sequential sampling of individual yellowtail allowed for quantification of
turnover rate in (1) all yellowtail that reached steady-state with new diet and (2) the pooled population of cap-
tive yellowtail. We used exponential fit models and to quantify yellowtail muscle tissue turnover rate of δ13C and
δ15N, as used previously24,57–60:
δt = ae− t + c, (9)
where δt is the stable isotope value at time t, a and c are parameters derived from the best fit, and λ is a data-
derived first-order rate constant. Parameters a and c represent specific parameters: a = difference (‰) between
initial and final steady-state values and c is the model-estimated final isotope steady-state value24,60. The isotope-
specific half-life (t0.5) was then calculated:
Scientific Reports | (2021) 11:4466 | https://doi.org/10.1038/s41598-021-83880-z 11
Vol.:(0123456789)www.nature.com/scientificreports/
t0.5 = ln (2)/ (10)
for different λ values derived for δ N and δ C, for both individual yellowtail and the grouped population. We
15 13
used a modified equation from Buchheister and Latour21 to calculate the time needed to obtain a given percent-
age (α) of complete turnover:
tα/100 = ln (1 − α/100)/ (11)
where tα/100 is the time needed to attain α% turnover and λ is the data-derived first-order rate constant.
Growth‑based isotopic turnover. Fish length (fork length or FL; cm) was recorded at t0, various time
steps throughout the experiment concurrent with tissue sampling, and tf. Direct measurements of yellowtail
mass (kg) were taken at t0. Some mass measurements were taken with FL during the experiment; however direct
measurements of mass during sampling were not always possible due to the difficulty of weighing large, active
fish and the priority to minimize stress on captive fish during sampling events. When only length was available
for individual yellowtail at specific timesteps, mass at time t (Wt) was estimated using the length–weight equa-
tion from Baxter 1960:
Wt = 7.747 × 10⁻⁸ (FLt mm)2.84 (12)
Relative gain in mass (WR, hereafter referred to as ‘relative growth’) was then calculated:
WR = Wf /Wi (13)
where Wf is the measured final mass and Wi is the initial mass estimate from SL. Using the equation from R
icker61
for Wf:
′
Wf = W i e k t (14)
where k’ is the group specific growth-rate constant, we derive k’:
k′ = ln (WR )/t (15)
and can obtain the growth rate constant k’ for individual fish using relative growth (WR) and time in captivity t.
Hesslein et al.62 describes the isotope value of a fish at time t (δt) as:
′
δt = δf + (δi −δf )e−(k + m)t
(16)
where δf is the final isotope value at steady-state with diet, δi is the initial isotope value before the diet switch,
m is the metabolic turnover constant. This is a modification of Eq. (3), where δf = c, (δi – δf) = a, and (k’ + m) = λ.
Thus we calculate λ from Eq. (3), k’ from Eq. (13), and use Eq. (14) to calculate the metabolic constant m based
on turnover rates of δ15N and δ13C24. We can also calculate the amount of relative growth needed to achieve α
percent turnover of δ13C and δ15N21,24:
Gα/100 = exp (ln (1 −α/100)/ ) (17)
and growth-based turnover can be calculated:
G0.5 = exp (ln (0.5)/ ) (18)
where G0.5 is the growth-based half-life and λ is the data-derived rate constant from growth-based model fits to
yellowtail muscle δ13C and δ15N. We estimated the proportion of isotopic turnover due to growth (Pg) and the
proportion of turnover due to metabolism (Pm) as the proportion of k’ and m, respectively, of the overall isotopic
turnover constant λ21,24,61:
Pg = k′ / (19)
Pm = m/ (20)
We applied Eqs. 13–20 to δ13C and δ15N values in yellowtail muscle tissue and report growth turnover rate
constants and overall estimated contribution of growth and turnover to observed δ15N and δ13C turnover in
captive yellowtail.
Applicability to field data. Typical applications of δ13C and δ15N data from field-collected animals include
approaches that assume isotopic steady-state with diet (e.g. Bayesian mixing models) and approaches that uti-
lize isotopic values after an assumed or inferred shift in diet and/or habitat (e.g. isotopic clock approaches).
Sequential sampling of individual yellowtail allowed for investigation of variability in δ13C and δ15N values at
steady-state with pellet feed, at various time intervals after a diet switch, and at steady-state with fish/squid diet.
Sequential sampling reduced the influence of individual variability in assessment of isotopic parameters. We
compared time after diet switch to three metrics of variability (variance, range, standard deviation) of δ13C and
δ15N throughout the experimental period to assess the robustness of approaches assuming steady-state and/or
changing δ13C and δ15N values in wild predators.
Scientific Reports | (2021) 11:4466 | https://doi.org/10.1038/s41598-021-83880-z 12
Vol:.(1234567890)You can also read