Station and train surface microbiomes of Mexico city's metro (subway/underground) - Nature
←
→
Page content transcription
If your browser does not render page correctly, please read the page content below
www.nature.com/scientificreports

 OPEN Station and train surface
 microbiomes of Mexico City’s
 metro (subway/underground)
 Apolinar Misael Hernández1, Daniela Vargas-Robles1,2, Luis David Alcaraz3 &
 Mariana Peimbert 1 ✉
 The metro is one of the more representative urban transportation systems of Mexico City, and it
 transports approximately 4.5 million commuters every day. Large crowds promote the exchange of
 microbes between humans. In this study, we determined the bacterial diversity profile of the Mexico
 City metro by massive sequencing of the 16S rRNA gene. We identified a total of 50,174 operational
 taxonomic units (OTUs) and 1058 genera. The metro microbiome was dominated by the phylum
 Actinobacteria and by the genera Cutibacterium (15%) (C. acnes 13%), Corynebacterium (13%),
 Streptococcus (9%), and Staphylococcus (5%) (S. epidermidis; 4%), reflecting the microbe composition
 of healthy human skin. The metro likely microbial sources were skin, dust, saliva, and vaginal, with no
 fecal contribution detected. A total of 420 bacterial genera were universal to the twelve metro lines
 tested, and those genera contributed to 99.10% of the abundance. The annual 1.6 billion ridership
 makes this public transport a main hub for microbe-host-environment interactions. Finally, this study
 shows that the microbial composition of the Mexico City metro comes from a mixture of environmental
 and human sources and that commuters are exposed to healthy composition of the human microbiota.

 Public transport systems provide the ideal environment for the transmission of microorganisms, as they carry a
 multitude of passengers, and their microbiomes, daily. The metro can assemble an extensive repository of bene-
 ficial bacteria, such as commensals and symbionts, or harmful bacteria, becoming a vehicle for the transmission
 of infectious diseases. The Mexico City metropolitan area has a population of 21.3 million people, which makes it
 the largest city in the Western Hemisphere. Mexico City’s metro has more than 4 million users every day, totaling
 1,647,475,013 users annually (https://metro.cdmx.gob.mx/) and is the second busiest metro of the American
 continent, after New York City’s, and the ninth busiest in the world1. It has been in use since 1969 and today has
 12 lines and 196 stations; it travels through a network of 226.5 km and operates 365 days of the year, covering a
 radius of around 10 km around the urban sprawl of Mexico City. The various lines were individually constructed
 at different points in history, which has led to differences in the infrastructure and the wagon type between lines;
 although all lines have pneumatic wheels, some also have iron wheels. Most of the lines go through different sec-
 tions, including underground, street level, and elevated above ground level, and are ventilated by extractors, fans,
 or open windows. The size of passenger influx differs by line and by the station, with a higher influx at terminal
 stations and transfer stations. Terminal stations connect the inner city to suburban areas, where most of the popu-
 lation lives. During this mass movement, passengers breathe the same air and touch the same surfaces, promoting
 a large-scale interchange of human and environmental microbiota. Several factors differentiate the metros of each
 city. In Mexico City, there are three rush hours per day: the commute to and from work and another peak at noon
 that seems to correspond to the schools’ schedule. The number of trips/person/days is 2.37, similar to London
 and Seville (2.31 and 2.33, respectively), but much lower than the New York and Paris averages (3.79 and 3.70,
 respectively)2.
 Previous studies have indicated that a significant proportion of metro surface bacteria come from the skin
 of passengers, so the lifestyle of these passengers is also important. Among the chemical and physical factors
 directly influencing the microbiome, the most obvious are temperature and humidity. However, there are many
 other important factors, such as differences in the ventilation systems, whether or not the trains are pneumatic,

 1
 Departamento de Ciencias Naturales. Unidad Cuajimalpa, Universidad Autónoma Metropolitana, Ciudad de México,
 México. 2Centro Amazónico de Investigación y Control de Enfermedades Tropicales Servicio Autónomo CAICET,
 Puerto Ayacucho, Venezuela. 3Departamento de Biología Celular, Facultad de Ciencias, Universidad Nacional
 Autónoma de México, Ciudad de México, México. ✉e-mail: marianapeimbert@gmail.com

Scientific Reports | (2020) 10:8798 | https://doi.org/10.1038/s41598-020-65643-4 1
www.nature.com/scientificreports/ www.nature.com/scientificreports

 Figure 1. Sampling diversity and location. The metro network, with each black dot representing a station and
 colored circles showing the sampling locations. The circles are colored according to the Shannon diversity index.
 Train diversity is also shown in colored circles.

 and pollution. Therefore, studies from other networks can be used for reference, but the local diversity will only be
 understood by directly studying the metros of Mexico City. Multiple studies have characterized the metro micro-
 biomes of various densely populated areas, such as New York City, Boston, Hong Kong, and Barcelona3–8. Mexico
 City is one of the most densely populated areas in the world (6,000 people/km2 in Mexico City; 9,800 people/km2
 in the Greater Mexico City area). However, Mexico City’s metro microbiome has been scarcely explored. Only
 one previous study has characterized the colony-forming units (CFU; N = 175 isolates) in the air of the metro
 transport system identifying three fungal genera and concluding that most bacteria were Gram-positive bacilli9.
 It has been estimated that humans can emit 106 particles per hour10,11. As a rough estimation, the 4 × 10⁶
 Mexico City metro users per day, with an average commuting time of 2.3 hours9, release a total of 9.2 × 10¹²
 particles in the metro every day. Additionally, the metro architecture favors the presence of multiple aerosol
 particles from other sources so that the metro can be thought of as a vast shared pool for the horizontal exchange
 of microbes from human-derived particles, soil, and plant debris. In previous work, the built environment was
 shown to be biologically different when inhabited by people, compared to empty spaces, and even the “cloud”
 of microbiomes can be used to distinguish the microbial signatures of individuals four hours after they have
 departed11,12. In this study, we revealed the bacterial diversity profile of the Mexico City metro with next genera-
 tion sequencing of the 16S rRNA gene. We took 47 samples from stations and trains, covering all 12 metro lines
 of Mexico City. This work is the first culture-independent investigation of a metro microbiome in Latin America.

 Results
 We studied the twelve Mexico City metro lines and analyzed 47 samples for this study (Fig. 1). The samples
 were taken from station turnstiles (N = 24) and train handrails (N = 23). We sequenced a total of 16.6 × 10⁶
 V3-V4 16S rRNA gene reads (4.98 Gb in total). The reads were merged into 5,788,162 sequences (avg = 460 bp)
 with a mean of 123,152.38 ± 28,371.93 sequences/sample. This work represents the largest published record of
 Mexico City’s metro microbiological diversity. The sequences were clustered into operational taxonomic units
 (OTUs; 97% identity 16S rRNA gene), recovering 50,174 OTUs (Supplementary Table S1). The OTUs were then
 homology-matched and annotated with reference databases being summarized as 1,058 distinct bacteria genera.
 Additionally, we detected 22,673 amplicon sequence variants (ASVs) and 1,252 bacterial genera (Supplementary
 Fig. 1; Table S2).
 Differences between observed and expected OTUs (Chao1) are less than 30% (Fig. 2). Moreover, we are con-
 fident of a comprehensive sampling of the metro’s diversity because differences between the observed genera and
 Chao1 diversity index are less than 10% (Fig. S3). The Simpson diversity index were slightly higher for the sta-
 tions when compared to trains (Supplementary Table S3). The most diverse station was Carrera, with a Shannon
 diversity index of H′ = 7.36, followed by Azteca (H′ = 7.35), Muzquiz (H′ = 7.31), Tacuba (H′ = 7.30), and Indios
 Verdes (H′ = 7.16); the lowest diversity was found on metro Line 1 (Insurgentes station; H′ = 4.10) (Fig. 1).
 The train with the highest diversity was found on Line 6 (H′ = 7.38), followed by Line 3 (H′ = 6.96), and line 5
 (H′ = 6.63). The lowest diversity train was found on Line 8 (H′ = 5.54). The average Shannon diversity (H′(average)
 = 6.52) from the stations (turnstiles) was higher than the average train (handrails) diversity (H′(average) = 6.24)
 (Fig. 2; Supplementary Table S3). We also calculated alpha diversity using amplicon sequence variants (ASVs),
 and observed lower diversity than the one calculated with OTUs (ASV H′(average) = 4.93 ± 0.74; Supplementary
 Fig. S1). The lower H′ diversity for ASVs was expected, considering the ASV counts (22,673) compared to the
 OTUs found (50,174).

Scientific Reports | (2020) 10:8798 | https://doi.org/10.1038/s41598-020-65643-4 2
www.nature.com/scientificreports/ www.nature.com/scientificreports

 Figure 2. OTUs richness and diversity of Mexico City’s metro. The surface microbiome diversity on the station
 entrance and the metro train. A total of 50,174 OTUs were observed, across 47 samples (*p < 0.05, **p < 0.01,
 Kruskal-Wallis test).

 Figure 3. Shared taxa between metro lines. All the train and station samples are merged into its source metro
 line. The histogram shows the number of shared elements for each intersection sets. The plots are ordered from
 higher to lower cardinal numbers. (A) Shared OTUs: of the 50,174 OTUs, 3,688 were found in all lines. (B)
 Shared genera: of 1,058 genera, 420 were found in all lines. The 420 genera represented 99.10% of the entire
 dataset. The gray bars show the number of taxa identified for each subway line. Sets smaller than 150 elements
 for OTUs, and sets smaller than 5 elements for genera, were excluded from the diagrams.

 We looked for relationships between microbial diversity and a multitude of factors like metro line numbers,
 station connectivity (regular, transfer, and terminal stations), station surroundings (bus terminals, work-related
 buildings, schools, hospitals), architectural structure (above ground, below ground stations), train wheels (metal-
 lic and pneumatic), train design (individual wagons or connected), temperature, relative humidity, geographi-
 cal zones, and passenger influx (Fig. S2). However, there were only statistically significant differences (p ≤ 0.01)
 between the surfaces of stations and trains. Stations showed significant larger OTU diversity than trains and had
 higher diversity dispersions (Fig. 2).
 Mexico City’s metro is highly diverse at the OTU level (50,174 OTUs). By merging the bacterial genera diver-
 sity by the metro line, we found that 420/1,058 genera were ubiquitous throughout the metro system (Fig. 3).
 Moreover, these 420 genera, representing 3,688 OTUs, constituted 99.10% of the whole dataset, expressed
 in sequence abundance. The other 638/1,058 genera contributed to just 0.9% of the overall richness. We are

Scientific Reports | (2020) 10:8798 | https://doi.org/10.1038/s41598-020-65643-4 3
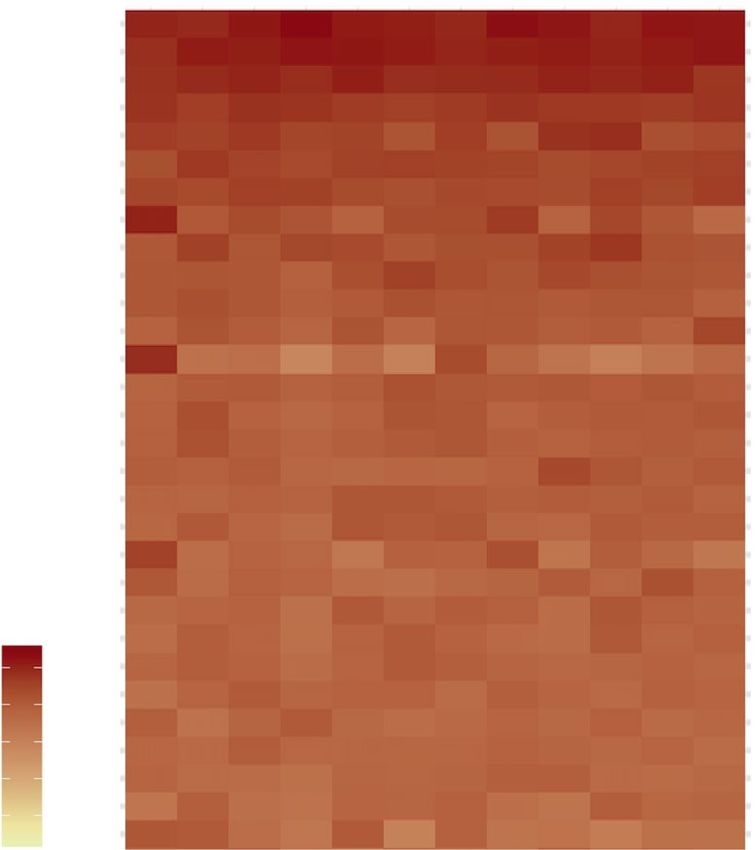
www.nature.com/scientificreports/ www.nature.com/scientificreports

 Figure 4. Phylogenetic profile of Mexico City’s metro surfaces. (A) Phylum abundance in all samples:
 Actinobacteria was the most abundant phylum followed by Firmicutes and Proteobacteria. (B) Genus
 abundance: Cutibacterium was the most abundant genus. (C) Heatmap of the 30 most abundant taxa, and their
 abundance in each sampled metro line. The unknown genera were classified into the higher known taxonomic
 rank, shown in different text colors. The asterisk indicates plants.

 confident this work has comprehensively described the Mexico City metro bacterial genera. It was surprising to
 find the presence of 420 genera in all of our samples (Fig. 3).
 The main phyla detected were Actinobacteria, Firmicutes, Proteobacteria, Cyanobacteria, Bacteroidetes,
 Chloroflexi, Fusobacteria, and Thermi (Fig. 4A), no differences were found using ASVs or OTUs nor Silva or
 Green genes databases in phyla assignments. There were multiple genera with low abundance (1,034 genera
www.nature.com/scientificreports/ www.nature.com/scientificreports

 Figure 5. Metro bacterial communities grouped into the sample types collected in this study: for train and
 station. (A) Community distances dendrogram using unweighted UniFrac distances. (B) Constrained analysis
 of principal coordinates (CAP) ordinations based on unweighted UniFrac distances for turnstiles and handrails
 at the OTU level. Significantly segregated (p = 0.001, Adonis) ellipses denote the 95% confidence interval of the
 points distribution by the station and train samples sample type.

 and unclassified to the genus level (N = 57 OTUs), but classified mainly to Actinobacteria (N = 45), Firmicutes
 (N = 4), Proteobacteria (N = 3), Chloroflexi (N = 2), Cyanobacteria (N = 2), and Gemmatimonadetes (N = 1)
 (Supplementary Table S6).
 To understand the interaction between people and metro surfaces, we observed and documented the behav-
 ior of 3098 passengers (see Methods). We observed that 78% (570/730) of people touched the station turnstiles
 directly with their hands, while the rest touched it with their clothes or carry-on items. The observation of train
 handrail use was complicated, since some people touch many handrails, some hold tight to just one, and others
 do not touch anything. However, we observed that the rate of direct contact with one of the station turnstile bars
 is significantly higher (median, 122 people/hour) than with one of the train handrails (median 22.9 people/hour,
 p = 0.001). Observations were made during rush hour (Fig. S6).
 We performed a source-tracking analysis to determine the possible environmental sources of the metro
 microbial communities. The tracked microbial environments were dust, skin, saliva, vaginal, stool, and soil. A
 mean of 34% of our data was matched by the source tracker algorithm14 (see Methods) to microbiota from dust,
 while skin (32%), saliva (13%), soil (4%), and vaginal matches were less prevalent (0.1%). No stool profiles were
 detected. The trains showed a higher level of skin microbiota than station (p = 1e-06, Student’s t-test), while sta-
 tions had a higher level of dust and soil than trains (p < 0.001). Saliva and vaginal matches to the source-tracking
 database were not distributed differentially between trains and stations. We did not detect significant differences
 in environmental sources between samples exposed to the external environment and completely subterraneous
 samples (Fig. 6; Supplementary Fig. S7).

 Discussion
 The richness of the microbiome of Mexico City’s metro was 50,174 OTUs (16S rRNA gene V3–V4), which is
 comparable to reports from other cities. The following comparisons were made by a raw contrast of the main
 findings for other subways. For example, in a study of the Hong Kong subway system, using similar methodo-
 logical procedures (16S rRNA gene V4), there were reported to be a total of 55,703 OTUs6. However, Shannon’s
 diversity index (H′) is two orders of magnitude larger in Mexico City’s metro (H′(average) = 6.38 ± 0.661) than
 the reported for Hong Kong subway (H′(average) = 4.13 ± 0.30715) and the Barcelona subway airborne bacteria
 (H′ ~ 1.5)8. Additionally, the inverse Simpson index of diversity (D(average) = 0.98 ± 0.004) is also higher than
 the Boston subway surface microbial diversity (D ~ 0.75, as estimated from a previous study4). The Shannon
 diversity is higher than that of some human microbiome systems15. Overall bacterial diversity found in Mexico
 City’s metro is similar to that of subways in other countries, with its source microbes derived mainly from dust,
 human skin, and oral taxa (Fig. 6)3,5–7. However, each city metro has different dominant taxa. Pseudomonas
 stutzeri, Stenotrophomonas maltophila, Enterobacter cloacae, and Acinetobacter are the most abundant species
 in New York City5. Methylobacterium is the dominant genus in Barcelona’s subway8. Neither Pseudomonas nor
 Methylobacterium, prevalent in the NYC and Barcelona subways, are among the most abundant genera found in
 this study (Fig. 4)5,8.
 In Mexico’s metro microbiome, the four most abundant genera were Cutibacterium (15%) (C. acnes 13%),
 Corynebacterium spp. (13%), Streptococcus spp. (9%), and Staphylococcus spp. (5%) (S. epidermidis, 4%). C.
 acnes (Basonym: Propionibacterium acnes16) on trains reached a similar relative abundance to that reported for

Scientific Reports | (2020) 10:8798 | https://doi.org/10.1038/s41598-020-65643-4 5
www.nature.com/scientificreports/ www.nature.com/scientificreports

 Figure 6. Source tracking comparison between stations and train microbiota. A source tracker algorithm was
 used to identify microbes to the genus level, using dust, soil, saliva, skin, feces, and vaginal samples as potential
 sources (***p < 0.001, Student’s t-test). Dots in the figure represent outliers from the boxplot quartiles.

 passengers’ hands after a metro trip (~29%)17. Similar taxa were observed in Mexico City’s metro and Hong Kong
 subway with a dominance of skin associated microbiota like Cutibacterium, Corynebacterium, Staphylococcus, and
 Streptococcus6. Despite the similarities with Boston and Hong Kong’s bacterial diversity, Mexico City metro has
 larger -diversity. It has been noted that microbial composition is driven by geography at the OTU level, when
 comparing the Hong Kong and United States OTU phylogenetic diversity of built environments6. Remarkably,
 three cultural contrasting subway systems share the same dominant bacterial genera, with similar ridership
 between Mexico City (world ninth) and Hong Kong (10th)1 and the lower ridership Boston subway (82th). The
 MetaSUB is a consortium working to develop sample collection, DNA/RNA isolation, and sequencing standard
 operating procedures to study global microbial diversity in mass transport systems18. This work began before the
 MetaSUB protocols were published. However, the sampling, DNA isolation, PCR programs, sequencing technol-
 ogies, and data processing are in line with the MetaSUB requirements. Further meta-analysis work could test the
 geographical and host effects in the transport system associated bacteria.
 Multiple factors affect the metro microbiome composition, such as the number of users, microenvironmental
 and climatic conditions, architecture, and even rush hours, and some studies have identified antibiotic resistance
 genes as morning or afternoon signatures17. In this work, no architectonic designs (subterranean, street level, or
 elevated trains, or rubber or ferrous wheels) affected microbial diversity or composition. The high frequency of
 surface interaction by users probably promotes the rapid exchange of microbes, preventing them from establish-
 ing and growing. Environmental variables (temperature and humidity) appear to be similar among sampled sites;
 additionally, the type of environment outside the train station (bus terminals, work-related buildings, schools,
 hospitals) did not modify the microbial diversity, suggesting the samples were independent of the station context.
 The higher diversity we found on the stations compared to trains may be explicable in a number of ways. The
 station turnstiles are exposed to the outside, which may explain the greater diversity and also why soil bacteria
 are more highly represented in these samples. Another relevant dissimilarity is the number of people who touch
 the bars, 122 people/hour for turnstiles, and 23 people/hour for handrails (Supplementary Fig. S6). Differences in
 usage may also explain the differences in microbial diversity and composition. Train handrails are usually touched
 with the hands, while station turnstiles are often touched by clothes, which favors the arrival of dust-associated
 taxa. Finally, the difference in material surfaces may also shape diversity, e.g., turnstiles are aluminum, while
 handrails are made of stainless steel. The effects in surface usage and material have been previously associated
 with changes in microbial diversity and composition4. The Actinobacteria phylum is highly represented (18,727
 OTUs; 37.31%) in Mexico City’s metro, and we were able to identify 160 known genera and 3,959 undescribed
 genus-level OTUs in this phylum. The leading genera were found to be Cutibacterium and Corynebacterium.
 Interestingly, Cutibacterium has been isolated from human skin and sometimes described as primary human
 pathogen19,20. We found a total of 2,341 OTUs classified as Cutibacterium, with 1,358 OTUs best matching
 C. acnes, and 105 OTUs best matching C. granulosum, as well as 878 unknown Cutibacterium species.
 Cutibacterium has been described in association with acne lesions and in surgical infections but has also been
 observed in healthy skin16,21. Further work of different species and strains of Cutibacterium is needed to under-
 stand its role in healthy skin and built environments.
 Corynebacterium has been described in soil, freshwater, marine, and host-associated environments22.
 Corynebacterium had more OTUs (4,238), albeit in lower abundances than Cutibacterium. The vast abundance
 of Cutibacterium and Corynebacterium could be due to the prolific host microenvironments of the sebaceous
 glands, with their secreted fatty acids and a low pH (~5) and O2 concentration23. The biotechnological poten-
 tial of detected Actinobacteria in the Mexico City’s metro is astounding. Actinobacteria are also known to be
 active members of micro-communities and act as symbionts to eukaryotes21. We detected 160 known genera
 of Actinobacteria, follow up projects could use this diversity to mine for new antibiotics and natural products,
 explore the potential for biomass decomposition from dust (which is mainly human skin debris in the metro),
 and explore their possible role in bioenergy production. It is also interesting that, together, Actinobacteria and
 Firmicutes represented almost 75% of the total described diversity (Fig. 4A). Firmicutes are represented by 154

Scientific Reports | (2020) 10:8798 | https://doi.org/10.1038/s41598-020-65643-4 6
www.nature.com/scientificreports/ www.nature.com/scientificreports

 known genera, with a high abundance of Streptococcus, Staphylococcus, Leuconostoc, Lactobacillus, Veillonella,
 Anaerococcus, and Bacillus.
 The fifth most abundant biological group in Mexico City’s metro was classified as chloroplasts (1,129 OTUs
 identified as the land plant Streptophyta). We were also able to identify unicellular algae (Stramenopiles and
 Chlorophyta). A second search matching chloroplasts OTUs to RDP’s seqmatch24 allowed a detailed classifica-
 tion of the plants (Supplementary Table S5). Plant identification allows us to detect plants rooted in the Mexican
 cultural identity, like maize and its wild relative teosintes (Zea), common bean (Phaseolus vulgaris), some edible
 plants like cucumber (Cucumis sativus), papaya (Carica papaya), lettuce (Lactuca sativa), sunflower (Helianthus
 annuus), and pea (Pisum sativum). In addition, we found recreative plants like coffee (Coffea arabica) and tobacco
 (Nicotiana tabacum) in our dataset. Other species included the most notorious introduced plant of Mexico City’s
 roadsides, Eucalyptus globulus, as well as firs (Abies), abele (Populus alba), pine (Pinus), red cedar (Juniperus
 virginiana), ornamental plants like cycads (Cycas taitungensis), and all common plants growing in the city or its
 surroundings. Some of these plant genera have local centers of diversity or are regularly consumed by Mexico’s
 population. It was unexpected to find a plant signal in our study. We employed a harsh cell lysis method based
 on physical bead-beating and detergent disruption of membranes (MoBio’s PowerSoil) to extract DNA from the
 surfaces and the deposited bioaerosols. Possible plant sources found in this study could be derived from plant
 debris, pollen, and plant-derived products. Studying macro species with metagenomic environmental DNA has
 allowed us to track rare species of vertebrates25, invading plant species26, and lotic communities27. Further work
 on metagenomic DNA degradation in the metro will be useful to determine the spatiotemporal dynamics of
 microbe transmission and DNA resilience of other taxa, such as the plant species we detected in the metro.
 The ubiquity of the 420 genera found in all the samples is probably indicating their success within the species pool
 of this built habitat. Mexico City’s metro is a place where feedback between millions of hosts and the shared environ-
 ment is shaping the host and environmental microbial communities’ dispersal, transmission, and feedback. Mexico
 City’s bacterial species pool has the metro as its playground. The species pool is defined as the microbes residing inde-
 pendently of their hosts, capable of colonizing and interacting with its abiotic environment, other inhabitants, and
 hosts28. The microbial species pool had also been defined in the microbiome context as microbes residing outside the
 host at sometimes in their life cycle, with the possibility to colonize its hosts or the interaction with other microbes
 with colonizing capabilities28. Species pools can be a part of any given community, and their success is measured by
 the similarity of species within a community, their frequency, dispersal abilities, and dormancy capabilities29. So, if
 similar organisms dominate a community structure, they have succeeded surpassing abiotic and biotic filtering to
 be part of that community29. The functional and environmental selection for a habitat has been studied extensively
 by botanists. We can think about a forest and “forest species” let us say that pine species dominate the forest, we
 can think about the pine species pool success in a hypothetical forest. The human oral microbiome is reflecting the
 success of the Streptococci species pool. Streptococci are responsible for the health and disease of their hosts within
 the oral cavity30,31. More dramatically, the success, based on the species similarity and richness of the Lactobacillus
 pool in the human vaginal microbiome, is undeniable32. The species pool is involved in the dispersal of microbes
 between their hosts and the environment, and it is shaped by the host and environmental feedback (i.e., immune
 system responses, host population density, continuous dispersal) that can actively shape the microbial community28.
 Further work could explore the diversity of Mexico City’s microbial pool and its impact on human health. The
 species pool could be used to introduce microbiota to humans during the first years of life, to train and mature
 the immune system a process that has been observed with newborn babies who have extensive variation in their
 skin microbiomes during the first years that subsequently stabilized33. It has been stated that humans living in
 developed countries are reducing their microbiota diversity, compared to non-urban and non-industrialized
 lifestyles34. So, studying the species pool transmission, resilience, and feedback with the millions of ridership
 in urban transportation systems will help to understand human-microbe interactions, especially in the urban
 context. Previous reports, have shown that dispersal and transmission of microbes of human individuals sharing
 their home share more microbes, even between genetic twins35. This is consistent in other animal microbiomes
 like fishes36. Host dissemination and acquisition of microbes could be beneficial to the establishment of symbiotic
 interactions at the community, microbiome-level where the interactions sustain the mutualistic bacteria and
 prevent potential pathogens and cheaters, at least in a theoretical model37. The Mexico City’s metro is a venue for
 microbiome transmission city-wide scale, with an annual ridership of 1.6 billion users, it will be a fertile ground
 for future testing of metacommunity theory into microbiomes of built environments.

 Materials and Methods
 Sampling. Station turnstiles from the entrance and vertical handrails inside the train were sampled with
 sterile cotton swabs between April 27th to May 5th, 2016. Each swab was used to sample 3 different bars, cov-
 ering approximately 300 cm2 (100 cm2 from each bar). Before sampling, swabs were moistened with transport
 media (Tris 20 mM, EDTA 10 mM pH 7.5). Samples were kept on ice during transport and stored at −80 °C until
 DNA extraction. Turnstiles from 24 stations were sampled. A total of 24 samples were collected from train hand-
 rails, two trains for each metro line. The library of a sample did not meet the quality criteria. Therefore only 23
 train samples are reported. Sampling permits were granted by the metro “User Support Manager” (Gerencia de
 Atención al Usuario, del Sistema de Transporte Colectivo).

 Metadata. Temperature and relative humidity were recorded for the sampled site. Information about the train
 building architectural design (underground, elevated or street level), train wheel type (rubber tires or steel wheels),
 and station information, such as climate zone, type of station (way, transfer, or terminal station), train environ-
 mental exposure level (open or subterraneous space) was recorded. Additionally, the environmental context of the
 exterior of the metro stations (office buildings, bus station, market, park, or plaza) was also collected. Passenger

Scientific Reports | (2020) 10:8798 | https://doi.org/10.1038/s41598-020-65643-4 7
www.nature.com/scientificreports/ www.nature.com/scientificreports

 influx statistical data were obtained from the metro office reports, “Sistema de Transporte Colectivo: Cifras de
 Operación” (https://www.metro.cdmx.gob.mx/operacion/cifras-de-operacion) (Supplementary Table S6).

 Passenger behavior observations. Frequency of contact with train handrail and station turnstile bars
 was determined by counting the number of users touching a specific bar within an hour (a total of 3002 people
 among 8 turnstiles and 96 people among 9 handrails). Additionally, a total of 52 turnstiles in six different stations
 were observed for 10 minutes. Also, a total of 32 handrail bars were observed during the whole train route (22 to
 39 minutes) in 8 different lines. The total number of touches per turnstile bar was averaged and were extrapolated
 to touches per hour.

 Amplicon generation and next generation sequencing. Metagenomic DNA was obtained using the
 MoBio PowerSoil Kit (MoBio Laboratories, Solana Beach, CA), with the small modifications suggested by MoBio
 for low biomass samples. Briefly, swabs were vortexed in a 1.5 mL tube with 300 μL of transportation buffer (Tris
 20 mM, EDTA 10 mM pH 7.5). Then, 125 μL of the sample, 30 μL of C1 solution, and 50 μL phenol: chloroform 1:1
 were mixed in the bead tube. The following steps followed the manufacturer’s instructions. We used PCR prim-
 ™ ®
 ers for the V3–V4 region of the 16S rRNA gene38, following MiSeq Illumina protocol with 5′ overhangs for
 sequencing library preparation (341 F and 805 R) with an expected amplicon size of 464 bp38. Each PCR was done
 ™
 in triplicate with a reaction mixture of 25 μL including 0.2 μL Phusion DNA polymerase , 5 μL Buffer 5×, 2.5 μL
 dNTP (3 mM), 1 μL forward primer (5 pmol/μL), 1 μL reverse primer (5 pmol/μL), 2 μL DNA, and 13.3 μL water.
 The PCR reaction was initiated at 98 °C, 30 s, followed by 35 cycles of 92 °C for 10 s, 53 °C for 30 s, and 72 °C for
 40 s, the reaction finished at 72 °C for 5 min. Sterile swabs were used for negative controls. PCR amplicons were
 ™
 purified using the High Pure PCR Product Purification Kit of ROCHE (Roche Diagnostics Gmb, Mannheim,
 ™ ®
 Germany). Sequencing was performed using a MiSeq Illumina (2 × 300 bp) platform at the Biotechnology
 Institute of the Universidad Nacional Autónoma de México (UNAM).

 Sequence processing. We used a previously reported protocol for 16S rRNA gene amplicons analysis39,
 which is detailed at GitHub (https://genomica-fciencias-unam.github.io/SOP/). Briefly, pair end reads were
 merged, using a minimum of 470 bp, a 15 bp of minimum overlapping, and with a quality threshold of 0.95 using
 PANDASEQ40. Sequence clustering into OTUs was performed at 97% identity with cd-hit-est41. Cd-hit-est is an
 included OTU picking software in the popular QIIME scripts42, which we have previously tested as a reasonable
 option when picking de novo OTUs39. Representative sequences and OTU tables were built with QIIME (v 1.9)42.
 The taxonomy assignment was completed with parallel BLAST+43 against the Greengenes database44. Best match-
 ing species are suggested with sequence identity >90% and e-values
www.nature.com/scientificreports/ www.nature.com/scientificreports

 8. Triadó-Margarit, X. et al. Bioaerosols in the Barcelona subway system. Indoor Air 27, 564–575 (2017).
 9. Hernández-Castillo, O. et al. Aerobiological study in the Mexico City subway system. Aerobiologia (Bologna). 30, 357–367 (2014).
 10. Meadow, J. F. et al. Humans differ in their personal microbial cloud. PeerJ 3, e1258 (2015).
 11. Bhangar, S. et al. Chamber bioaerosol study: human emissions of size-resolved fluorescent biological aerosol particles. Indoor Air 26,
 193–206 (2016).
 12. You, R., Cui, W., Chen, C. & Zhao, B. Measuring the short-term emission rates of particles in the ‘personal cloud’ with different
 clothes and activity intensities in a sealed chamber. Aerosol Air Qual. Res. 13, 911–921 (2013).
 13. Love, M. I., Huber, W. & Anders, S. Moderated estimation of fold change and dispersion for RNA-seq data with DESeq2. Genome
 Biol. 15, 550 (2014).
 14. Knights, D. et al. Bayesian community-wide culture-independent microbial source tracking. Nat. Methods 8, 761–763 (2011).
 15. Li, K., Bihan, M., Yooseph, S. & Methé, B. A. Analyses of the microbial diversity across the human microbiome. PLoS One 7, e32118
 (2012).
 16. Scholz, C. F. P. & Kilian, M. The natural history of cutaneous propionibacteria, and reclassification of selected species within the
 genus Propionibacterium to the proposed novel genera Acidipropionibacterium gen. nov., Cutibacterium gen. nov. and
 Pseudopropionibacterium gen. nov. Int. J. Syst. Evol. Microbiol. 66, 4422–4432 (2016).
 17. Kang, K. et al. The environmental exposures and inner- and intercity traffic flows of the metro System may contribute to the skin
 microbiome and resistome. Cell Rep. 24, 1190–1202. e5 (2018).
 18. The MetaSUB International Consortium. The metagenomics and metadesign of the subways and urban biomes. Microbiome 24,
 1–14 (2016).
 19. Renz, N., Mudrovcic, S., Perka, C. & Trampuz, A. Orthopedic implant-associated infections caused by Cutibacterium spp.–A
 remaining diagnostic challenge. PloS one 13, 8 (2018).
 20. Dréno, B. et al. Cutibacterium acnes (Propionibacterium acnes) and acne vulgaris: a brief look at the latest updates. Journal of the
 European Academy of Dermatology and Venereology 32, 5–14 (2018).
 21. Piwowarek, K., Lipińska, E., Hać-Szymańczuk, E., Kieliszek, M. & Ścibisz, I. Propionibacterium spp.—source of propionic acid,
 vitamin B12, and other metabolites important for the industry. Appl. Microbiol. Biotechnol. 102, 515–538 (2018).
 22. Lewin, G. R. et al. Evolution and ecology of Actinobacteria and their bioenergy applications. Annu. Rev. Microbiol. 70, 235–254
 (2016).
 23. Grice, E. A. & Segre, J. A. The skin microbiome. Nat. Rev. Microbiol. 9, 244–253 (2011).
 24. Cole, J. R. et al. Ribosomal Database Project: Data and tools for high throughput rRNA analysis. Nucleic Acids Res. 42, D633–D642
 (2014).
 25. Franklin, T. W. et al. Using environmental DNA methods to improve winter surveys for rare carnivores: DNA from snow and
 improved noninvasive techniques. Biol. Conserv. 229, 50–58 (2019).
 26. Gantz, C. A., Renshaw, M. A., Erickson, D., Lodge, D. M. & Egan, S. P. Environmental DNA detection of aquatic invasive plants in
 lab mesocosm and natural field conditions. Biol. Invasions 20, 2535–2552 (2018).
 27. Seymour, M. et al. Acidity promotes degradation of multi-species environmental DNA in lotic mesocosms. Commun. Biol. 1, 4
 (2018).
 28. Miller, E. T., Svanbäck, R. & Bohannan, B. J. M. Microbiomes as metacommunities: Understanding host-associated microbes
 through metacommunity ecology. Trends Ecol. Evol. 33, 926–935 (2018).
 29. Zobel, M., van der Maarel, E. & Dupré, C. Species pool: the concept, its determination and significance for community restoration.
 Appl. Veg. Sci. 1, 55–66 (1998).
 30. Belda-Ferre, P. et al. The oral metagenome in health and disease. ISME J. 1, 46–56 (2011).
 31. Alcaraz, L. D. et al. Identifying a healthy oral microbiome through metagenomics. Clin. Microbiol. Infect. 18(Suppl 4), 54–7 (2012).
 32. Gajer, P. et al. Temporal dynamics of the human vaginal microbiota. Sci. Transl. Med. 4, 132 (2012).
 33. Palmer, C., Bik, E. M., DiGiulio, D. B., Relman, D. A. & Brown, P. O. Development of the human infant intestinal microbiota. PLoS
 Biol. 5, 1556–1573 (2007).
 34. Clemente, J. C. et al. The microbiome of uncontacted Amerindians. Sci. Adv. 1, e1500183 (2015).
 35. Rothschild, D. et al. Environment dominates over host genetics in shaping human gut microbiota. Nature 555(7695), 210–215
 (2018).
 36. Burns, A. R. et al. Interhost dispersal alters microbiome assembly and can overwhelm host innate immunity in an experimental
 zebrafish model. Proc. Natl. Acad. Sci. USA 114, 11181–11186 (2017).
 37. Pillai, P., Gouhier, T. C. & Vollmer, S. V. The cryptic role of biodiversity in the emergence of host-microbial mutualisms. Ecol. Lett.
 17, 1437–1446 (2014).
 38. Illumina. 16s metagenomic sequencing library preparation. https://support.illumina.com/downloads/16s_metagenomic_
 sequencing_library_preparation.html (2013).
 39. Alcaraz, L. D. et al. Marchantia liverworts as a proxy to plants’ basal microbiomes. Sci. Rep. 8, 12712 (2018).
 40. Masella, A. P., Bartram, A. K., Truszkowski, J. M., Brown, D. G. & Neufeld, J. D. PANDAseq: paired-end assembler for illumina
 sequences. BMC Bioinformatics 13, 31 (2012).
 41. Huang, Y., Niu, B., Gao, Y., Fu, L. & Li, W. CD-HIT Suite: a web server for clustering and comparing biological sequences.
 Bioinformatics 26, 680–2 (2010).
 42. Caporaso, J. G. et al. QIIME allows analysis of high-throughput community sequencing data. Nat. Methods 7, 335–6 (2010).
 43. Camacho, C. et al. BLAST+: Architecture and applications. BMC Bioinformatics 10, 421 (2009).
 44. DeSantis, T. Z. et al. Greengenes, a chimera-checked 16S rRNA gene database and workbench compatible with ARB. Appl. Environ.
 Microbiol. 72, 5069–72 (2006).
 45. Callahan, B. J., Sankaran, K., Fukuyama, J. A., McMurdie, P. J. & Holmes, S. P. Bioconductor Workflow for Microbiome Data
 Analysis: from raw reads to community analyses. F1000Research 5, 1492 (2016).
 46. Yilmaz, P. et al. The SILVA and “All-species Living Tree Project (LTP)” taxonomic frameworks. Nucleic Acids Research 42,
 D643–D648 (2013).
 47. McMurdie, P. J. & Holmes, S. phyloseq: An R package for reproducible interactive analysis and graphics of microbiome census data.
 PLoS One 8, e61217 (2013).
 48. Wickham, H. Ggplot2: elegant graphics for data analysis. (Springer (2016).
 49. R Core Team. R: A language and environment for statistical computing. (2013).
 50. Oksanen, J. et al. The vegan package. Community ecology package. 10, 631–7 (2007).
 51. Marotz, C. et al. DNA extraction for streamlined metagenomics of diverse environmental samples. Biotechniques 62, 290–293
 (2017).
 52. Dominguez-Bello, M. G. et al. Partial restoration of the microbiota of cesarean-born infants via vaginal microbial transfer. Nat. Med.
 22, 250–3 (2016).

 Acknowledgements
 This work was supported by the Secretary of Science, Technology, and Innovation of Mexico City SECITI
 102/2017, Autonomous Metropolitan University, and National Council of Science and Technology Graduate

Scientific Reports | (2020) 10:8798 | https://doi.org/10.1038/s41598-020-65643-4 9
www.nature.com/scientificreports/ www.nature.com/scientificreports

 fellowship (A.M.H.). A.M.H. is a doctoral student of Posgrado de Ciencias Naturales e Ingeniería, Universidad
 Autónoma Metropolitana.

 Author contributions
 A.M.H. and M.P. conceived the project. A.M.H. collected the samples and performed metagenomic DNA
 extraction and library preparations for sequencing. A.M.H., D.V.R., L.D.A. and M.P. analyzed the data and wrote
 the paper.

 Competing interests
 The authors declare no competing interests.

 Additional information
 Supplementary information is available for this paper at https://doi.org/10.1038/s41598-020-65643-4.
 Correspondence and requests for materials should be addressed to M.P.
 Reprints and permissions information is available at www.nature.com/reprints.
 Publisher’s note Springer Nature remains neutral with regard to jurisdictional claims in published maps and
 institutional affiliations.
 Open Access This article is licensed under a Creative Commons Attribution 4.0 International
 License, which permits use, sharing, adaptation, distribution and reproduction in any medium or
 format, as long as you give appropriate credit to the original author(s) and the source, provide a link to the Cre-
 ative Commons license, and indicate if changes were made. The images or other third party material in this
 article are included in the article’s Creative Commons license, unless indicated otherwise in a credit line to the
 material. If material is not included in the article’s Creative Commons license and your intended use is not per-
 mitted by statutory regulation or exceeds the permitted use, you will need to obtain permission directly from the
 copyright holder. To view a copy of this license, visit http://creativecommons.org/licenses/by/4.0/.

 © The Author(s) 2020

Scientific Reports | (2020) 10:8798 | https://doi.org/10.1038/s41598-020-65643-4 10
You can also read