Status and Trend of the Main Allergenic Pollen Grains and Alternaria Spores in the City of Rome (2003-2019)
←
→
Page content transcription
If your browser does not render page correctly, please read the page content below
sustainability

Article
Status and Trend of the Main Allergenic Pollen Grains and
Alternaria Spores in the City of Rome (2003–2019)
Alessandro Di Menno di Bucchianico 1,2, * , Raffaela Gaddi 1 , Maria Antonia Brighetti 2 , Denise De Franco 2 ,
Annarosa Miraglia 2 and Alessandro Travaglini 2

                                           1   ISPRA—Italian Institute for Environmental Protection and Research, Via Brancati 48, 00144 Rome, Italy
                                           2   PhD Program in Evolutionary Biology and Ecology, Department of Biology, University of Rome Tor Vergata,
                                               00133 Rome, Italy
                                           *   Correspondence: alessandro.dimenno@isprambiente.it

                                           Abstract: Today a large part of the European population is exposed to levels of air pollution exceeding
                                           the standards recommended by the World Health Organization. Moreover, air pollution and the
                                           seasonal emission of allergenic pollen are progressively affecting human health and can cause severe
                                           allergic reactions, particularly when air pollution combines with pollen allergen peaks. Unlike
                                           atmospheric pollutants of anthropogenic origin, pollen sources have a pulsating trend that leads
                                           to high values in the flowering period and values close to, or equal to, zero in the rest of the year.
                                           This aspect makes essential the definition of data coverage standards for the main allergenic taxa.
                                           For air quality assessment detailed classification criteria for monitoring stations are defined by
                                           international standards, not the same from the European Standards for the Sampling and analysis of
                                           airborne pollen grains and fungal spores. This paper describes the status and the air concentration
                                           trends of the main allergenic pollen and the Alternaria spore measured in Rome from 2003 to 2019
                                           by the Aerobiological Monitoring Center of Tor Vergata (Rome) and calculated by the Seasonal
Citation: Di Menno di Bucchianico,         Kendall test with the open-source OpenAir R package. The analysis was carried out on the daily
A.; Gaddi, R.; Brighetti, M.A.; De         concentrations of the most widespread allergenic taxa in Italy: Asteraceae, Betulaceae, Corylaceae,
Franco, D.; Miraglia, A.; Travaglini, A.   Cupressaceae/Taxaceae, Poaceae, Oleaceae, Urticaceae and the Alternaria spores.
Status and Trend of the Main
Allergenic Pollen Grains and               Keywords: pollen; atmospheric pollution; urban areas; allergy; pollen concentration
Alternaria Spores in the City of Rome
(2003–2019). Sustainability 2023, 15,
6150. https://doi.org/10.3390/
su15076150
                                           1. Introduction
Academic Editors: Assunta                        The lower troposphere of temperate zones is often rich in airborne pollen, this is
Florenzano, Eleonora Clò, Gabriel          particularly true in Italy due to the remarkable plant biodiversity that characterizes this
Servera-Vives and Anna Maria               territory. In every season we find blooms of anemophilous species whose pollen and
Mercuri                                    spores, often allergenic, are released in large quantities and are dispersed in the air. This
Received: 30 December 2022                 phenomenon is significantly reduced only in the coldest winter periods. Throughout the
Revised: 19 March 2023                     developed world, pollinosis, i.e., pollen allergies, are continuously increasing and are
Accepted: 21 March 2023                    increasing more in urban areas also due to the synergistic effect, on human health, between
Published: 3 April 2023                    the allergens present in pollen grains and atmospheric pollution [1–6].
                                                 Allergic diseases affect over a billion people worldwide [7] and the role of pollen in
                                           the pathogenesis of these diseases is now well established. In fact allergic diseases, such as
                                           asthma and rhinitis, affect from 5 to 30% of the inhabitants of industrialized countries [8].
Copyright: © 2023 by the authors.          To date, however, it is not fully understood the mechanism of the interaction between
Licensee MDPI, Basel, Switzerland.         pollen allergens and air pollutants and further research will be needed to clarify the process
This article is an open access article
                                           by which biological pollutants can cause symptoms in exposed population.
distributed under the terms and
                                                 Pollen and allergies are a recurring theme every spring. In fact, every year, in the
conditions of the Creative Commons
                                           different seasons, periodic environmental alarms are raised, such as high levels of PM10
Attribution (CC BY) license (https://
                                           in winter or ozone in summer. Nevertheless in Italy the allergenic pollen season is spread
creativecommons.org/licenses/by/
                                           from January (Cupressaceae) to November (Ambrosia), (see ahead Table 1).
4.0/).

Sustainability 2023, 15, 6150. https://doi.org/10.3390/su15076150                                      https://www.mdpi.com/journal/sustainability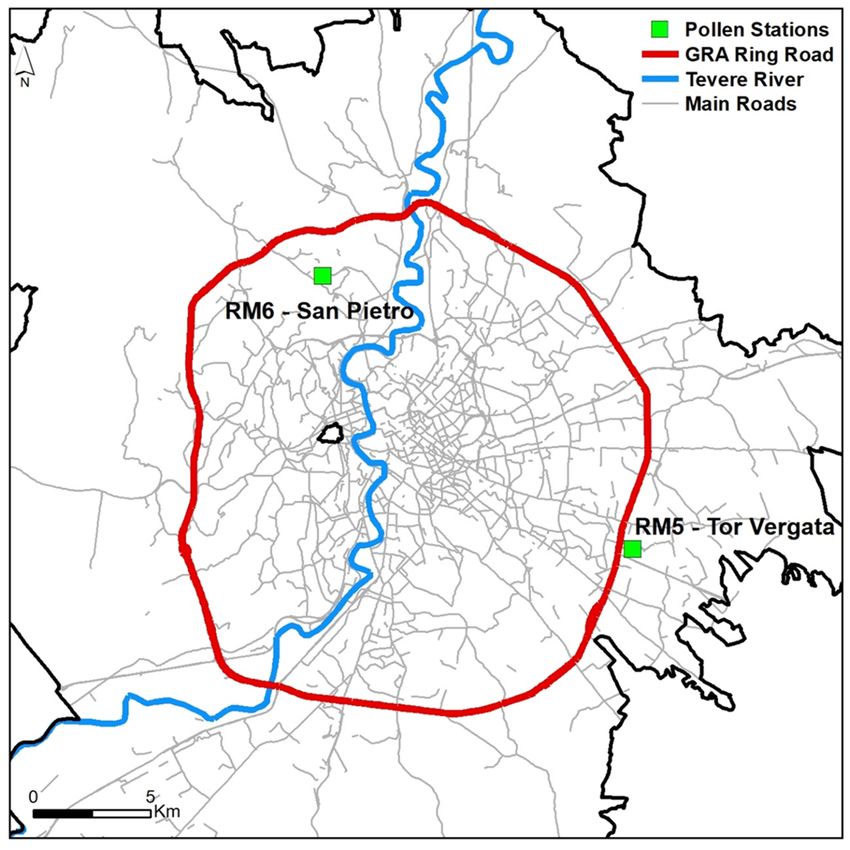
Sustainability 2023, 15, 6150 2 of 15
Table 1. Average pollen and sporulation seasons and allergenicity for main allergenic taxa in Italy
(X: moderate, XX: medium, XXX: intense).
Betulaceae Asteraceae Corylaceae Cupressaceae/Taxaceae
Allergenicity Very High Allergenicity Very High Allergenicity Very High Allergenicity Very High
Jan. Jan. Jan. XX Jan. XX
Feb. X Feb. Feb. XXX Feb. XXX
Mar. XX Mar. Mar. X Mar. XXX
Pollen Calendar (Italy)
Pollen Calendar (Italy)
Pollen Calendar (Italy)
Pollen Calendar (Italy)
Apr. XX Apr. Apr. XXX Apr. XX
May X May May X May X
Jun. Jun. Jun. Jun.
Jul. Jul. X Jul. Jul.
Aug. Aug. XXX Aug. Aug.
Sep. Sep. XX Sep. Sep.
Oct. Oct. Oct. Oct.
Nov. Nov. Nov. Nov.
Dec. Dec. Dec. X Dec. X
Poaceae Oleaceae Urticaceae Alternaria spore
Allergenicity Very high Allergenicity Very high Allergenicity Very high Allergenicity Very high
Jan. Jan. Jan. Jan.
Feb. Feb. XX Feb. Feb.
Mar. X Mar. XXX Mar. X Mar.
Sporulation Calendar (Italy)
Pollen Calendar (Italy)
Pollen Calendar (Italy)
Pollen Calendar (Italy)
Apr. XX Apr. XX Apr. XXX Apr.
May XXX May XXX May XXX May X
Jun. XX Jun. XX Jun. XX Jun. XX
Jul. XX Jul. Jul. XX Jul. XX
Aug. X Aug. Aug. XXX Aug. XXX
Sep. X Sep. Sep. XXX Sep. XXX
Oct. X Oct. Oct. X Oct. XX
Nov. Nov. Nov. Nov. X
Dec. Dec. Dec. Dec.
In recent years, the recorded cases of pollen allergies in urban centers of Italy and
Europe have been increasing [5,8]. This evidence cannot be explained only by genetic
factors but the trend of allergenic pollen concentrations in the air must be investigated
which, linked to green management and rapid urbanization, increases the number of people
exposed to air pollution.
In recent years, the interest of scientific research for the monitoring of pollen, spores
and other bioaerosols has increased due to the growing awareness of the importance of
respiratory diseases. Furthermore, the role of climate change on the future worldwide
distribution of bioaerosols and consequently on human health has influenced the growth
of interest in this topic.
A review conducted in Scopus has in fact highlighted that the number of publica-
tions containing terms such as “pollen allergies” and “pollen predictions” is constantly
increasing [9].
It is therefore increasingly clear that aerobiological monitoring is an integral part of
the assessment of air quality, in line with a significant number of epidemiological studies
Sustainability 2023, 15, x FOR PEER REVIEW 3 of 15
Sustainability 2023, 15, 6150 3 of 15
which show how the interaction between air pollutants and allergens can increase the risk
which show
of disease how
and thethe interactionofbetween
aggravation symptoms air pollutants
[10]. and allergens can increase the risk
of disease and the aggravation of symptoms [10].
Aerobiology research has been working for years for the monitoring and assessment
of airAerobiology
quality linked research has been
to pollutants working for years
of anthropogenic for and
origin, the monitoring and assessment
at the same time also carries
of air quality linked to pollutants of anthropogenic origin, and
out the analysis and evaluation of allergenic pollen sampled by Aerobiological at the sameMonitoring
time also
carries
Networks. out the analysis and evaluation of allergenic pollen sampled by Aerobiological
Monitoring
The issuesNetworks.
of interest to the scientific community and citizens are many and strongly
The issues of
linked to each other, interest to the to
in addition scientific community
the relationship and citizens
between pollen are
andmany
human and strongly
health, the
linked to each other, in addition to the relationship between pollen and
relationship between pollen and climate change will be deepened in the near future and human health, the
relationship between pollen and climate change will be deepened in the near future and a
a more modern, and informed, design will be supported. The aim must not be simply the
more modern, and informed, design will be supported. The aim must not be simply the
reduction of allergic reactions, but more generally to contribute to the citizen s well-being
reduction of allergic reactions, but more generally to contribute to the citizen’s well-being
and awareness growth.
and awareness growth.
The purpose of this study was to evaluate the presence of monotonic trends of air
The purpose of this study was to evaluate the presence of monotonic trends of air
concentration of the main allergenic taxa in the city of Rome from 2003 to 2019: Asteraceae
concentration of the main allergenic taxa in the city of Rome from 2003 to 2019: Asteraceae
(a family that include the Ambrosia and Artemisia genera), Betulaceae (main genera: Alnus
(a family that include the Ambrosia and Artemisia genera), Betulaceae (main genera: Alnus
and Betula), Corylaceae (which includes the genera Carpinus, Corylus and Ostrya), Cupres-
and Betula), Corylaceae (which includes the genera Carpinus, Corylus and Ostrya), Cupres-
saceae/Taxaceae (counted together in aerobiological monitoring), Poaceae (which includes
saceae/Taxaceae (counted together in aerobiological monitoring), Poaceae (which includes
many herbaceous allergenic plants widespread in Italy), Oleaceae (main genera: Fraxinus
many herbaceous allergenic plants widespread in Italy), Oleaceae (main genera: Fraxinus
and Olea),
and Olea), Urticaceae
Urticaceae (main
(main genera:
genera: Parietaria
Parietaria and Urtica) and
and Urtica) and the
the Alternaria
Alternaria spore
spore [11–17]
[11–17]
and chapter S1 in Supplementary
and chapter S1 in Supplementary Materials. Materials.
The assessment
The assessment of of aa possible
possible presence
presence of of an
an increasing
increasing or
or decreasing
decreasing trend
trend of
of specific
specific
allergenic taxa
allergenic taxa can
can provide
provide aa useful
useful tool
tool for
for interpreting
interpreting symptoms
symptomsin inatopic
atopicsubjects.
subjects.
2. Materials
2. and Methods
Materials and Methods
homogeneous pollen
This paper compares homogeneous pollen concentration
concentration time
time series of data collected
in Rome and describes the status and trend of the main allergenic taxa present in the study
during the
area during the years
years from
from 2003
2003 to
to 2019
2019 [18–22].
[18–22].
Pollen samples were collected and measured
Pollen samples were collected and measured inin two
two sampling
sampling sites
sites by by
thethe Aerobio-
Aerobiologi-
logical
cal monitoring
monitoring center
center of Vergata
of Tor Tor Vergata
(see (see Figure
Figure 1). 1).
1. Aerobiological
Figure 1. Aerobiological Monitoring
Monitoring stations
stations of
of Tor Vergata center
center (red
(red line:
line: Great Ring Road of
Rome; blue line: Tiber river).
The spatial and temporal comparability of the data obtained in the two sites was
calculated through the Pearson correlation analysis of daily concentrations.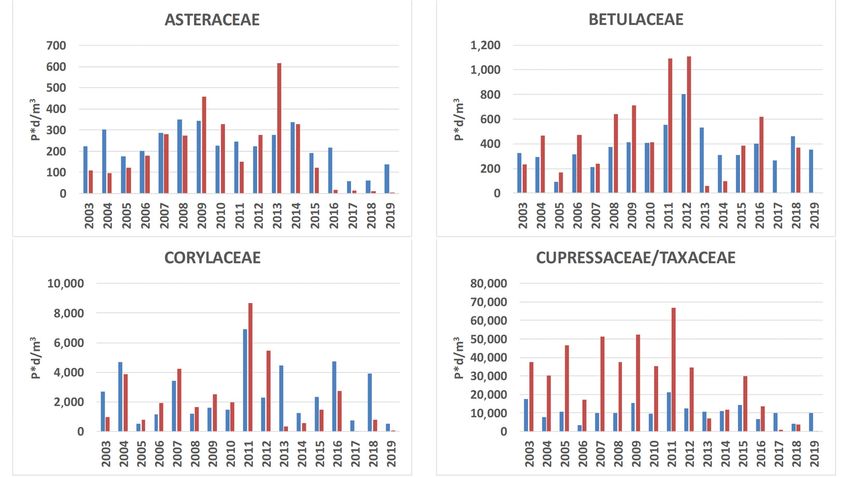
Sustainability 2023, 15, 6150                                                                                           4 of 15

                                      Temporal trends of pollen and spores were realized using the Seasonal Kendall test in
                                R software (R version 4.1.3, developed by R Core Team) [23,24].
                                      Statistical analysis allowed to highlight the trends in the levels of allergenic species
                                and how the distribution of peaks changes over time in order to link them to meteorological
                                parameters and the flowering calendar.
                                      The seasonally adjusted Kendall test is a non-parametric statistical hypothesis test
                                aimed to evaluate the existence of a trend or an increasing or decreasing monotonous trend
                                given a sufficiently large sample of data.
                                      The first version of the test proposed by Mann in 1945 [25] extended the analysis of
                                the significance of the Kendall τ correlation coefficient [26]—a test developed to evaluate
                                the association between any two variables regardless of the distribution of the data—if one
                                of the variables was time.
                                      The Mann-Kendall test was modified to take into account the effects due to season-
                                ality; the latter test is known as Seasonal Kendall Test (SK) or Kendall test corrected for
                                seasonality [27,28].
                                      It has been shown that among the various parametric and non-parametric tests avail-
                                able for trend analysis, the SK is among those that obtain the best performance, compared
                                to other tests, evaluated through the use of fictitious time series [29].
                                      It is able to predict the existence of a statistically significant trend by keeping the
                                error percentage below the predetermined value, and at the same time, to identify weak
                                statistically significant trends where actually present in the fictitious series. As this is a
                                non-parametric test, it is independent of the hypothesis of normality of the data. This
                                method is robust in case of anomalous (outliers) and missing data and characterized by a
                                relatively simple implementation [30]. Furthermore, when applied to historical series of air
                                pollution data, identifying and removing the seasonal component (seasonal adjustment)
                                can improve the estimation of background trends, reducing the uncertainty associated with
                                the estimate [31].
                                      In any case, trend analysis cannot disregard the availability of sufficiently long time
                                series, in order to reduce the influence of years with atypical weather conditions that can
                                mask an existent trend.
                                      It has been shown that the uncertainty in determining the existence of a statistically
                                significant trend in a series of air quality data increases exponentially with decreasing
                                length of the series. To be able to appreciate very small decreasing or increasing trends,
                                it is necessary to have datasets that are approximately 15 years long. With shorter series
                                the trend becomes appreciable if it is more significant but the series must be at least seven
                                years long. The normalization of data for the effects of meteorology allows to reduce the
                                uncertainty associated with the estimate and therefore to appreciate the existence of a trend
                                of the same order of magnitude starting from relatively less extensive data series [32].

                                2.1. The Monitoring Stations
                                     The pollen and spore concentration data for Rome were provided by the Aerobiological
                                Monitoring Center of the Tor Vergata University of Rome (Station code: RM5).
                                     The Tor Vergata Aerobiological Monitoring Center began its activity in 1996. The
                                volumetric sampler VPPS 2000, located approximately 15 m above the ground on the roof
                                of the Faculty of Mathematical, Physical and Natural Sciences, was installed a few years
                                after the purchase of the meteorological station of the Botanical Garden (1991).
                                     At the same time, a cognitive study of the flora of the Campus territory was carried
                                out, before its transformation.
                                     Soon the activity of the monitoring center was made available to the doctors of the
                                university and of the city.
                                     In 1999 the Center installed another monitoring station, 18 m above the ground on the
                                roof of the S. Pietro Fatebenefratelli Hospital research center (Station code: RM6) in the
                                northern zone of Rome.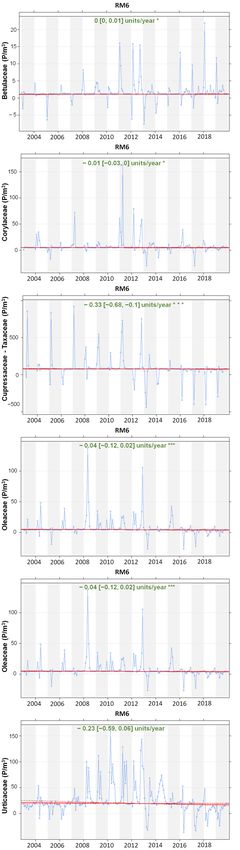
Sustainability 2023, 15, x FOR PEER REVIEW 5 of 15
Sustainability 2023, 15, 6150 5 of 15
In 1999 the Center installed another monitoring station, 18 m above the ground on
the roof of the S. Pietro Fatebenefratelli Hospital research center (Station code: RM6) in
the northern zone of Rome.
Around
Around the stations(see
the two stations (seeFigure
Figure2)2)the
the vegetational
vegetational picture
picture is heterogeneous:
is heterogeneous: ev-
evergreen anddeciduous
ergreen and deciduoussclerophyllous
sclerophyllouswoods
woodson onthe
theright
rightbank
bankofof the
the Tiber
Tiber River, semi-
semi-
natural
naturalmeadows
meadowstowards
towardsthetheeastern
easternpart
partofof
thethe
city, upup
city, to deciduous
to deciduousbroadleaf woods
broadleaf on
woods
the Alban hills and the Simbruini mountains [33].
on the Alban hills and the Simbruini mountains [33].
Figure2.2. Tor
Figure TorVergata
VergataCenter
Center(RM5)
(RM5)and
andS.S.Pietro
PietroHospital
Hospital(RM6),
(RM6),Rome
Rome(Source:
(Source:Department
Department of
of
Biology, University of Tor Vergata).
Biology, University of Tor Vergata).
2.2.
2.2.Instrumental
InstrumentalDescription
Description
For
Forthethepollen
pollenmonitoring
monitoringaavolumetric
volumetricsampler-type
sampler-typeHirst
Hirst[34],
[34],recommended
recommendedby bythe
the
International
InternationalBiological
BiologicalProgram
Program[35],[35],Model
Model20002000VPPS
VPPSLanzoni
Lanzoni[36],
[36],was
wasused.
used.
The
TheHirst
Hirstdevice
devicesamples
samples ambient
ambient air air by
by aavolumetric
volumetric suction
suction system,
system, particles
particles con-
con-
tained in
tained in the sampled air are deposited by impaction on a sampling surface
air are deposited by impaction on a sampling surface and then ex- and then
examined
amined with withananoptical
opticalmicroscope
microscopein inorder
order to
to identify
identify and count the pollen
pollen and
and fungal
fungal
spores
sporesperperarea.
area.
The
The data
data acquisition
acquisition waswas made
made following
following the the procedure
procedure described
described inin the
the UNI
UNI EN EN
Standard
Standard 16868:2019
16868:2019 [37]
[37] and
and reported
reported in in the
the Management
Management and and quality
quality manual
manual of of the
the
R.I.M.A. Italian Monitoring Network in Aerobiology (Manuale di gestione
R.I.M.A. Italian Monitoring Network in Aerobiology (Manuale di gestione e qualità della e qualità della
Rete
ReteItaliana
ItalianadidiMonitoraggio
Monitoraggioin inAerobiologia)
Aerobiologia)[38].[38].
The
The pollen and spores data of the
pollen and spores data of the considered
considered taxataxa were
were expressed
expressed asas daily
daily concentra-
concentra-
tion in Pollen/m 3 (P/m3 ) or Spore/m3 [39].
tion in Pollen/m3 (P/m3) or Spore/m3 [39].
The
TheHirst
Hirstdevice
devicesamples
samplesambient
ambientair airby
byaavolumetric
volumetriclow-volume
low-volumesystem
system[10 [10L/min]
L/min]
and
and pollen grains are collected on a moving acceptor surface. Samples are identifiedand
pollen grains are collected on a moving acceptor surface. Samples are identified and
counted
countedby byoptical
opticalmicroscopy
microscopy[37,40–43].
[37,40–43].
3. Results and Discussion
3. Results and Discussion
3.1. Pollen Time Series in Rome
3.1. Pollen Time Series in Rome
A first assessment that can be extrapolated from the analysis of the data from 2003
to 2019A first assessment
concerns that can be extrapolated
the predominant allergenic taxa from in the
the analysis of the
study area. Indata
this from
sense,2003
both to
2019 concerns the predominant allergenic taxa in the study area. In
considered monitoring stations showed the analyzed taxa in the same order of presence this sense, both con-
sidered
even monitoring
if with differentstations showed
quantity, due tothetheanalyzed taxa in the same
specific characteristics order
of the of presence
sampling sites.even
if with
Thedifferent
allergenicquantity, due to the the
taxon presenting specific characteristics
highest of the sampling
average concentration in thesites.
air in Rome
area isThe allergenic taxon presenting
Cupressaceae/Taxaceae (whose thepollen
highest average
grains are concentration
counted together) in the air inrespec-
with, Rome
area isfor
tively Cupressaceae/Taxaceae
stations RM5 and RM6, (whose
36%pollen
and 63% grains are average
of the counted total
together) with, respec-
concentration for
tively for stations RM5 and RM6, 36% and 63% of the average total concentration
the entire period. Second, for average air concentration, Urticaceae with, respectively for for the
entire period. Second, for average air concentration, Urticaceae with, respectively
stations RM5 and RM6, 27% and 18% of the total; third taxon, for average presence, Poaceae for sta-
tions respectively
with, RM5 and RM6, for 27% and RM5
stations 18% ofand theRM6,
total;16%
thirdandtaxon,
8% for average
of the total; presence, Poaceae
fourth taxon, for
with, respectively
average for stations
presence, Oleaceae RM5
with, and RM6,for
respectively 16% and 8%
stations of the
RM5 andtotal;
RM6,fourth
10% andtaxon,5% for
of
average
the total, presence,
followed by Oleaceae with, respectively
Corylaceae, Betulaceae and, for stations RM5 and RM6,
lastly, Asteraceae 10%than
with less and 1% 5%at of
the total,
both followed
stations (see the bypie
Corylaceae, Betulaceae
charts in Figure 3). and, lastly, Asteraceae with less than 1% at
both stations (see the pie charts in Figure 3).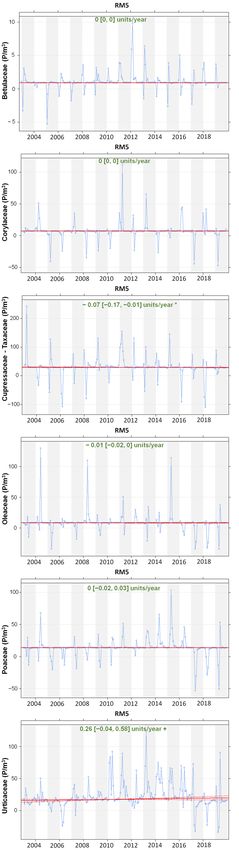
entire period. Second, for average air concentration, Urticaceae with, respectively for
                                   tions RM5 and RM6, 27% and 18% of the total; third taxon, for average presence, Poa
                                   with, respectively for stations RM5 and RM6, 16% and 8% of the total; fourth taxon
                                   average presence, Oleaceae with, respectively for stations RM5 and RM6, 10% and 5
   Sustainability 2023, 15, 6150   the total, followed by Corylaceae, Betulaceae and, lastly, Asteraceae with6 ofless
                                                                                                                   15 than 1

                                   both stations (see the pie charts in Figure 3).

                                                                            ROME RM5 2003-2019

Sustainability 2023, 15, x FOR PEER REVIEW                                                                                                    7
                                      BETULACEAE RM5       ASTERACEAE RM5              CORYLACEAE RM5   CUPRESSACEAE/TAXACEAE RM5

                                      POACEAE RM5          OLEACEAE RM5                URTICACEAE RM5

                                                                            ROME RM6 2003-2019

                                      BETULACEAE RM6       ASTERACEAE RM6              CORYLACEAE RM6   CUPRESSACEAE/TAXACEAE RM6

                                      POACEAE RM6          OLEACEAE RM6                URTICACEAE RM6

                                    Figure
                                   Figure 3. 3. Average
                                             Average     pollen
                                                     pollen      concentration
                                                            concentration         in the
                                                                          in the two     two aerobiological
                                                                                      aerobiological monitoringmonitoring
                                                                                                                stations, RM5stations,
                                                                                                                               (top) andRM5 (top
                                    RM6(bottom),
                                   RM6    (bottom),
                                                  for for the period
                                                      the period      2003–2019.
                                                                 2003–2019.

                                        The simple graphic evaluation of the time series is the first step in the evaluation
                                          The simple graphic evaluation of the time series is the first step in the evaluati
                                   of the possible variations over time of the concentrations of a pollutant in the air (see
                                    the possible
                                   Figure  4). Whatvariations      overfrom
                                                      can be deduced     time  ofrepresentation
                                                                             this the concentrations      ofconcentration
                                                                                                 is that the a pollutant in   theare
                                                                                                                           levels air (see F
                                    4). What
                                   clearly basedcan     be different
                                                   on the   deduced     from
                                                                     pollen    this [44,45],
                                                                            seasons  representation     is that
                                                                                             characteristic       the
                                                                                                            of each    concentration
                                                                                                                    taxon, which are level
                                    clearly regularly
                                   repeated   based oninthe      different pollen
                                                             the considered          seasons [44,45], characteristic of each taxon, w
                                                                             years (2003–2019).
                                    are For  all the taxa,
                                         repeated          the temporal
                                                      regularly    in thecorrespondence  between
                                                                          considered years         the peak concentrations recorded
                                                                                               (2003–2019).
                                   in the sampling stations throughout the period is very good, which indicates that the two
                                   sampling sites respond to the same meteorological and climatic conditions. On the other
                                   hand, some evident differences emerge in the recorded concentration values, this can be
                                   explained by the botanical biodiversity that characterizes the neighbourhoods of the two
                                   sampling points [46].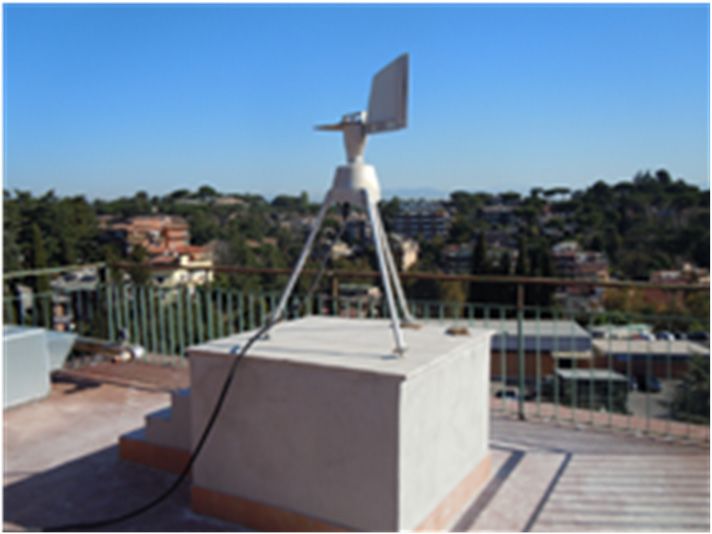
Sustainability 2023, 15, x FOR PEER REVIEW 7 of 15
Sustainability 2023, 15, 6150 7 of 15
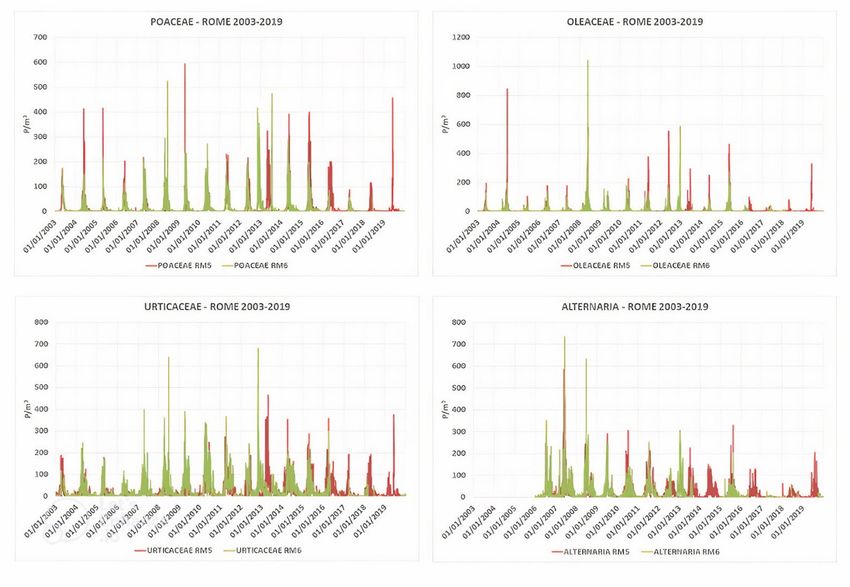
Figure 4. Daily pollen and spore concentration from Tor Vergata Center (RM5, in red) and S. Pietro
Figure 4. Daily pollen and spore concentration from Tor Vergata Center (RM5, in red) and S. Pietro
Hospital (RM6, in green) in the period 2003–2019.
Hospital (RM6, in green) in the period 2003–2019.
From the mere evaluation of these time series, however, it is not possible to understand
For allinthe
whether, thetaxa,
period the temporalthe
considered, correspondence between
concentration has the trend,
significant peak but
concentrations
only obtain rec-
indications
orded on the phase
in the sampling correlation
stations between the
throughout the concentration
period is very values
good,detected
whichover time. that
indicates
The calculation of the correlation matrix between the variables observed for
the two sampling sites respond to the same meteorological and climatic conditions. On the period
the other hand, some evident differences emerge in the recorded concentration values,
this can be explained by the botanical biodiversity that characterizes the neighbourhoods
of the two sampling points [46].
From the mere evaluation of these time series, however, it is not possible to under-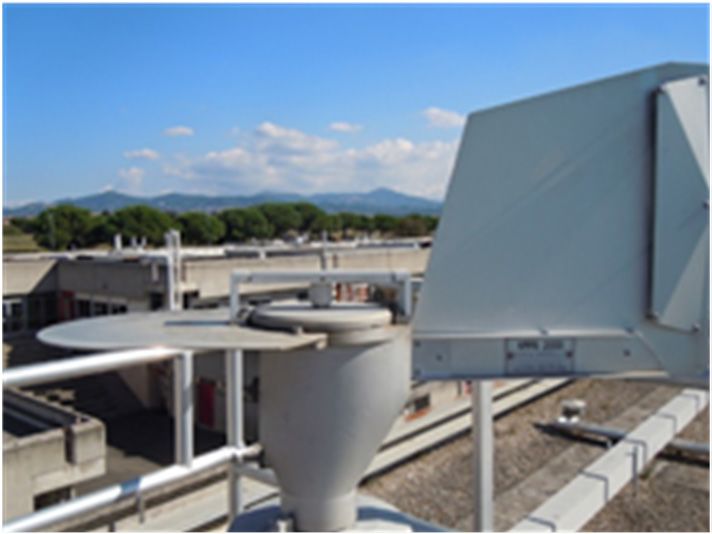
Sustainability 2023, 15, 6150                                                                                                                 8 of 15

                                   2003–2019 (expressed as Pearson’s coefficient of the pairs of daily averages) revealed that all
                                   the taxa showed statistically significant correlations (p < 0.001) between the two sampling
                                   sites (Tor Vergata Center, RM5 and S. Pietro Hospital RM6), this indicates a good spatial
                                   representativeness for the urban area of Rome.
                                         This indicates a good spatial representativeness of the two sites considered for the
                                   urban area of Rome [see Table S1 and Figure S1 in Supplementary Materials].
                                         In contrast, the different taxa, both in the same station and between the two sam-
                                   pling sites, showed a minimal correlation, with the exception of the pairs: Cupressaceae/
                                   Taxaceae—Betulaceae; Corylaceae—Urticaceae; Poaceae—Oleaceae and Oleaceae—Urticaceae.
                                   This result can be mainly attributed to the different extension and timing of the pollen sea-
                                   sons, outside of which the emissions of pollen grains into the air tends to zero. The pairs of
                                   taxa showing a greater correlation in daily values are those with more overlapping pollen
                                   seasons (see Table 2), where atmospheric stability variations represent a significant driver of
                                   concentrations in the air as for other atmospheric contaminants.

                                   Table 2. Kendall trend test results for the main allergenic taxa in Rome (2003–2019).

                                                 Kendall Trend Test Results (2003–2019)
                                                                                                 Statistical Significance
            Taxon               Station Code        Station Name
                                                                           P Stars       p      Dy (P m3 y−1 )      Significance        Trend
                                   RM5           Roma Tor Vergata                      0.31        −0.00029              No           Decreasing
          Betulaceae
                                   RM6             Roma S. Pietro             *        0.03         0.00234              Yes          Increasing
                                   RM5           Roma Tor Vergata            ***       0.00        −0.01673              Yes          Decreasing
          Asteraceae
                                   RM6             Roma S. Pietro             **       0.00        −0.01587              Yes          Decreasing
                                   RM5           Roma Tor Vergata                      0.76         0.00030              No           Increasing
         Corylaceae
                                   RM6             Roma S. Pietro             *        0.02        −0.00804              Yes          Decreasing
                                   RM5           Roma Tor Vergata             *        0.03        −0.06714              Yes          Decreasing
  Cupressaceae/Taxaceae
                                   RM6             Roma S. Pietro            ***       0.00        −0.33262              Yes          Decreasing
                                   RM5           Roma Tor Vergata                      0.92         0.00163              No           Increasing
           Poaceae
                                   RM6             Roma S. Pietro                      0.10        −0.04692              No           Decreasing
                                   RM5           Roma Tor Vergata                      0.17        −0.00711              No           Decreasing
           Oleaceae
                                   RM6             Roma S. Pietro            ***         0         −0.04490              Yes          Decreasing
                                   RM5           Roma Tor Vergata             +        0.10         0.26481              No           Increasing
          Urticaceae
                                   RM6             Roma S. Pietro                      0.17        −0.22694              No           Decreasing
                                   RM5           Roma Tor Vergata            ***         0         −0.52906              Yes          Decreasing
          Alternaria
                                   RM6             Roma S. Pietro            ***         0         −0.71389              Yes          Decreasing
                                   P star meaning: *** when p ≤ 0.001; ** when 0.001 < p ≤ 0.01; * when 0.01 < p ≤ 0.05; + when 0.05 < p ≤ 0.1; Empty
                                   space when 0.1 < p ≤ 1.

                                         It is important to remember that, in aerobiology, there is no universally recognized
                                   definition of pollen season and the different calculation criteria used to obtain the start and
                                   end dates of a season (and consequently its duration) can influence the results [44].
                                         In this work, when we talk about the season or sporulation pollen of a taxon, we are
                                   referring to the start and end dates calculated according to Jäger et al. [11], i.e., the most
                                   widely used criterion in Italian monitoring stations: pollen (or sporulation) season starts
                                   the first day with a count greater than 1% of the Annual Pollen Integral and it ends when
                                   95% of the Annual Pollen Integral is attained.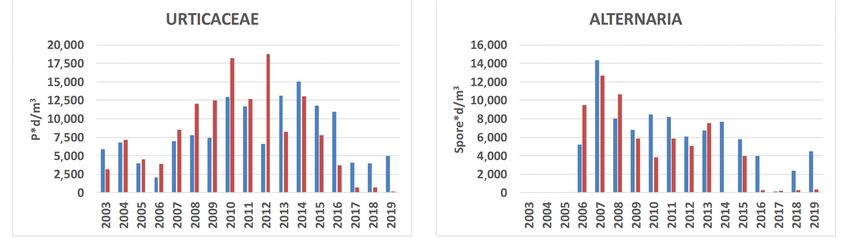
Sustainability 2023, 15, 6150 9 of 15
Sustainability 2023, 15, x FOR PEER REVIEW 9 of 15
3.2. Pollen Trends in Rome
In order to represent the aerobiological data in a homogeneous and comparable way
In order to represent the aerobiological data in a homogeneous and comparable way
in space and time, as for the other parameters describing air quality, indicators shared and
in space and time, as for the other parameters describing air quality, indicators shared and
adopted by the entire monitoring network are required.
adopted by the entire monitoring network are required.
In the activities of information to the public about the results of aerobiological mon-
In the activities of information to the public about the results of aerobiological moni-
toring, ininthe
itoring, the absence
absence of of national
national or or European
European regulatory
regulatory references,
references, production
production indica-
indicators,
tors, such as Annual Pollen Integral and sporulation integral, are adopted
such as Annual Pollen Integral and sporulation integral, are adopted as indicators of the as indicators of
the presence in air of allergenic
presence in air of allergenic pollen. pollen.
AnnualPollen
Annual PollenIntegral
Integralofof a Taxon
a Taxon (APIn)
(APIn) is the
is the annual
annual sumsum of daily
of the the daily concentra-
concentrations
of airborne pollen recorded for a given pollen taxon. The Annual Pollen Integral isisaa
tions of airborne pollen recorded for a given pollen taxon. The Annual Pollen Integral
parameter that
parameter that depends
depends on on the
the quantity
quantityofofairborne
airbornepollen
pollenofofthethe
taxon considered
taxon considered in the
in
monitoring area, on the duration and intensity of the pollen season.
the monitoring area, on the duration and intensity of the pollen season. The unit of The unit of measure-
ment of the Annual
measurement Pollen Integral
of the Annual is Pollenis*Pollen
Pollen Integral day/m*3.day/m3 .
Annual Spore
Annual Spore Integral
Integral (ASIn)
(ASIn) isis the
theannual
annual sumsumof ofthe
thedaily
dailyconcentrations
concentrations of of the
the
airbornespores
airborne sporesregister
registerforforaagiven
givenplant
plantor orfungal
fungaltaxon.
taxon. The
The Annual
Annual Integral
Integral is
is aa param-
param-
eterof
eter ofwhich
whichdepends
dependson onthe
thequantity
quantityof ofairborne
airbornespores
sporesof ofthe
thetaxon
taxonconsidered
consideredin inthe
the
monitoring area, on the duration and on the pollen season. The unit
monitoring area, on the duration and on the pollen season. The unit of measurement of the of measurement of
the integral of annual sporulation is Spore
integral of annual sporulation is Spore * day/m [47]. * day/m
3 3 [47].
Generally,the
Generally, the simple
simple observation
observation of of the
thevariations
variationsofofthe theAnnual
Annual Pollen
Pollenor or
Spore In-
Spore
tegral [48]
Integral [48]does
doesnotnotallow
allowto toevaluate
evaluatewithwith certainty
certainty the existence of significant
significant variations
variations
ofthe
of theconcentrations
concentrationsover overtime
time(see
(seeFigure
Figure5). 5).
Figure 5. Cont.
Sustainability 2023, 15, x FOR PEER REVIEW 10 of 15
Sustainability 2023, 15, 6150 10 of 15
Sustainability 2023, 15, x FOR PEER REVIEW 10 of 15
Figure 5. Annual Pollen and Spore Integral in the two aerobiological monitoring stations, RM5 (blue
Figure
bar) and RM6 Annual
5. (red bar)Pollen and
for the Spore2003–2019.
period Integral in the two aerobiological monitoring stations, RM5 (blue
bar) and RM6 (red bar) for the period 2003–2019.
Figure 5. Annual Pollen and Spore Integral in the two aerobiological monitoring stations, RM5 (blue
Scientific works on the trend of pollen indicators are generally addressed to the an-
bar) and RM6 (red
Scientific worksbar)on
forthe
thetrend
periodof2003–2019.
pollen indicators are generally addressed to the antici-
ticipation or postponement of phenological indicators (start or end of the pollen season)
pation or postponement of phenological indicators (start or end of the pollen season) [49,50].
[49,50]. However,
Scientific production
works on indicators
the trend are just as important for evaluating the effects the of an-
However, production indicators areofjust pollen indicators
as important forare generally
evaluating addressed
the effects oftoairborne
airborne allergenic
ticipation pollens pollens
or postponement on human health. In this sense the evaluation of the seasonal
allergenic on humanof phenological
health. In this senseindicators (start or end
the evaluation of the ofseasonal
the pollen or season)
annual
or annual integrals,
[49,50]. However, representing
production these as average values, does not represent the best tool of
integrals, representing these asindicators
average values, are justdoes as important
not represent for evaluating
the best tool theforeffects
under-
for understanding
airborne allergenic the impact on the respiration of
In atopic subjects. As for pollutants of
standing the impactpollens on the on human
respiration health.
of atopic this sense
subjects. thefor
As evaluation
pollutants of of
theanthropic
seasonal
anthropic
or annualorigin, for a more accurate evaluation of the values,
temporal variations of the concen-
origin, for integrals,
a more accurate representing
evaluation these of asthe average
temporal variations does notofrepresent the best tool
the concentrations it
trations it seems
for understanding useful to rely on the concentrations with the shorter available formediation
seems useful to relythe onimpact on the respiration
the concentrations with the of atopic
shortersubjects.
available Asmediationpollutants
period, of
period,
whichwhich
anthropic is currently,
origin,
is currently, for for
forapollen
morepollen
andand
accuratespores, spores,
evaluation the of
the daily dailytheaverage
average temporal concentration.
variations of the concen-
concentration.
If treated
trations it with
If treated seems adequate
with useful toaggregation
adequate relyaggregation criteria,
on the concentrations pollen
criteria, dailydaily
with
pollen concentration
the shorter data data
available
concentration can be
mediation
can be
processed
processed like
period, which air quality
like air data,
quality data,
is currently, calculating
forcalculating
pollen andthethe Temporal
Temporal
spores, trends
the dailytrends of the main
of the main
average allergenic pol-
allergenic pollen
concentration.
len sampled
sampled in
inRome,
If treated Rome,with using
using the
theSeasonal
adequate Seasonal
aggregation Kendall
Kendall test.
test. pollen daily concentration data can be
criteria,
For the
processed period
For thelike periodfrom 2003–2019
from 2003–2019
air quality we considered
we considered
data, calculating 77pollen
the Temporal pollentrendsfamilies
families andmain
and
of the theAlternaria
the Alternariaspore
allergenic pol-
sporeand,
and, in in this
this period,
period, the the analysis
analysis of
len sampled in Rome, using the Seasonal Kendall test. of concentration
concentration trends
trends showed
showed a a slight
slight but but statisti-
statistically sig-
callynificant
significant increase
increase of of Betulaceae
Betulaceae in the inRM6the RM6
station station
(0.01
For the period from 2003–2019 we considered 7 pollen families and the Alternaria < (0.01
p ≤ < p
0.05),≤ 0.05),
a a statistically
statistically significant
significant
decrease
spore and, decrease
in inboth
thisin both stations
stations
period, for for Asteraceae
theAsteraceae
analysis ≤ 0.001 (p ≤for
of(pconcentration 0.001
the for the
RM5
trends RM5 station,
station,
showed 0.001
a slight < p0.001
but < for
≤ 0.01
statisti-
p ≤ 0.01
the
callyfor
RM6 the RM6
station) and
significant station)
increase and Cupressaceae/Taxaceae
Cupressaceae/Taxaceae
of Betulaceae in the(0.01 (0.01 <
p ≤ 0.05(0.01
RM6< station p ≤ 0.05
for the< pRM5for the RM5
station,
≤ 0.05), sta-
p ≤ 0.001
a statistically
tion,for
p ≤the0.001
significant RM6 for the RM6
station);
decrease in station);
a statistically
both stationsa statistically
significant
for Asteraceaesignificant
decrease decrease
(p ≤of0.001
Corylaceae
for theof Corylaceae
(0.01 p ≤ (0.01
RM5Sustainability
Sustainability 2023, 2023, 15, 6150
15, x FOR PEER REVIEW 11 of 15
11 of 15
Figure 6. Cont.Sustainability
Sustainability 2023, 2023, 15, 6150
15, x FOR PEER REVIEW 12 of 15
12 of 15
Figure 6. Kendall
Figure trendtrend
6. Kendall test results for allergenic
test results pollen
for allergenic and Alternaria
pollen in theintwo
and Alternaria the aerobiological
two aerobiological
monitoring stations, RM5 (on the left) and RM6 (on the right) for the period 2003–2019.
monitoring stations, RM5 (on the left) and RM6 (on the right) for the period 2003–2019.
4. Conclusions
4. Conclusions
Pollen
Pollen grains grains and spores
and spores are part
are part of the ofairborne
the airborne particulate
particulate matter
matter and theandaerobio-
the aerobio-
logical
logical monitoring
monitoring networks,
networks, in sense,
in this this sense, are peculiar
are peculiar speciation
speciation networks
networks for particulate
for particulate
mattermatter
and, and,
as forasanthropogenic
for anthropogenic pollutants,
pollutants, it is important
it is important to evaluate
to evaluate the temporal
the temporal vari-vari-
ations of the concentrations with a short mediation period. The choice to process an inad- an
ations of the concentrations with a short mediation period. The choice to process
equateinadequate
parameter parameter can,
can, in fact, in fact,
hide hide the of
the existence existence of a statistically
a statistically significant significant
trend whichtrend
which
does exist. does exist.
In article
In this this article
seriesseries of daily
of daily concentration
concentration fromfrom 20032003 to 2019
to 2019 of eight
of eight allergenic
allergenic taxa taxa
(seven(seven botanical
botanical families
families andandthe the Alternaria
Alternaria spore)
spore) were
were analyzed
analyzed with
with a asignificant
significantim- impor-
tance for human
portance for human health. health.
For considered
For the the considered period,
period, the the allergenic
allergenic taxon
taxon presenting
presenting thethe highest
highest averagecon-
average concen-
tration in the air in the study area was Cupressaceae/Taxaceae,
centration in the air in the study area was Cupressaceae/Taxaceae, followed by Urticaceae followed by Urticaceae
and Poaceae.
and Poaceae.
From the statistical analysis, carried out using the Kendall test corrected for seasonality,
From the statistical analysis, carried out using the Kendall test corrected for season-
it emerged that, in most cases, the two stations present in the examined area show a
ality, it emerged that, in most cases, the two stations present in the examined area show a
consistent trend. This result indicates that the observed trend is not due to local phenomena
consistent trend. This result indicates that the observed trend is not due to local phenom-
but to a general trend of the examined territory. The elaborations carried out have also
ena but to a general trend of the examined territory. The elaborations carried out have also
highlighted that the flowering calendar influence the concentration levels of the families
highlighted that the flowering calendar influence the concentration levels of the families
considered over the years [51].
considered over the years. [51].
In particular, significant decreasing trends, in both stations, were observed for Aster-
In particular, significant decreasing trends, in both stations, were observed for Aster-
aceae, Cupressaceae/Taxaceae and the Alternaria spore. A significant decreasing trend for
aceae, Cupressaceae/Taxaceae and the Alternaria spore. A significant decreasing trend for
Corylaceae and Oleaceae was observed in the RM6 station and only a significant increasing
Corylaceae and Oleaceae was observed in the RM6 station and only a significant increas-
trend, for Betulaceae, still in the RM6 station.
ing trend,These
for Betulaceae,
results are still in the
offered RM6 station. tools for a more complete assessment of air
as supplementary
These results
quality and itsare offered
effects as supplementary
on human health in antoolsurbanfor a more complete assessment of
environment.
air qualityThe andbiological
its effectsparticulate,
on human health in an urban environment.
indeed, contributes to the mass concentration of PM10
The itbiological
and is useful particulate,
to estimate indeed, contributes
daily pollen to the mass
concentration concentration
as for of PMabiological
the other natural 10 and
it is useful to estimate daily pollen concentration as for the other natural
contributions. The combined assessment of the biological and abiological component abiological con- of
tributions. The combined assessment of the biological and abiological
atmospheric pollution can make a useful contribution to improving the knowledge component of at-of air
mospheric
qualitypollution can makeofahuman
for the protection useful health.
contribution to improving the knowledge of air
quality for the protection of human health.
Supplementary Materials: The following supporting information can be downloaded at: https:
Supplementary Materials: The following supportingChapter
//www.mdpi.com/article/10.3390/su15076150/s1. information can bepollen
S1: Allergenic downloaded
and sporeat:
taxa in
www.mdpi.com/xxx/s1.
this study; Table S1:Chapter
PearsonS1: Allergenic
correlation pollen and
coefficient forspore
pollentaxa
andinAlternaria
this study;in Table
RomeS1: Pear-
(2003–2019).;
son correlation
Figure S1: coefficient for pollenplot
Pearson correlation andfor
Alternaria in Rome
pollen and (2003–2019).;
Alternaria in Rome Figure S1: Pearson corre-
(2003–2019).
lation plot for pollen and Alternaria in Rome (2003–2019).
Author Contributions: Conceptualization, A.D.M.d.B., R.G., M.A.B. and A.T.; data curation, A.D.M.d.B.,
Author Contributions:
R.G., M.A.B. and A.T.; Conceptualization, A.D.M.d.B.,
formal analysis A.D.M.d.B., R.G.,
R.G., M.A.B.
M.A.B. and and
A.T.; A.T.; data curation,
investigation, A.D.M.d.B.,
A.D.M.d.B.,
R.G., M.A.B., D.D.F., A.M. and A.T.; methodology, A.D.M.d.B., R.G., M.A.B. andinvestigation,
R.G., M.A.B. and A.T.; formal analysis A.D.M.d.B., R.G., M.A.B. and A.T.; A.T.; supervision:
A.D.M.d.B., R.G.,validation,
A.D.M.d.B.; M.A.B., D.D.F., A.M. A.T.;
A.D.M.d.B., and A.T.; methodology,
visualization: A.D.M.d.B.,
A.D.M.d.B., R.G., M.A.B.
R.G., M.A.B., D.D.F., and
A.M.A.T.;
and A.T.;
supervision: A.D.M.d.B.; validation, A.D.M.d.B., A.T.; visualization: A.D.M.d.B., R.G., M.A.B.,
writing—original draft preparation A.D.M.d.B., R.G., M.A.B. and A.T.; writing—review and editing,
D.D.F., A.M. and A.T.; writing—original draft preparation A.D.M.d.B., R.G., M.A.B. and A.T.; writ-
A.D.M.d.B., A.T.; visualization: A.D.M.d.B., R.G., M.A.B., D.D.F., A.M. and A.T. All authors have read
ing—review and editing, A.D.M.d.B., A.T.; visualization: A.D.M.d.B., R.G., M.A.B., D.D.F., A.M. and
and agreed to the published version of the manuscript.
A.T. All authors have read and agreed to the published version of the manuscript.Sustainability 2023, 15, 6150 13 of 15
Funding: This research received no external funding.
Institutional Review Board Statement: Not applicable.
Informed Consent Statement: Not applicable.
Data Availability Statement: Not applicable.
Conflicts of Interest: The authors declare no conflict of interest.
References
1. World Health Organization. Regional Office for Europe. (2003). Phenology and Human Health: Allergic Disorders: Report
on a WHO Meeting Rome, Italy, 16–17 January 2003. Copenhagen: WHO Regional Office for Europe. Available online:
https://apps.who.int/iris/handle/10665/107479 (accessed on 29 December 2022).
2. Pfaar, O.; Bastl, K.; Berger, U.; Buters, J.; Calderon, M.A.; Clot, B.; Darsow, U.; Demoly, P.; Durham, S.R.; Galán, C.; et al. Defining
pollen exposure times for clinical trials of allergen immunotherapy for pollen-induced rhinoconjunctivitis—An EAACI position
paper. Allergy 2017, 72, 713–722. [CrossRef]
3. Pyrhönen, K.; Kulmala, P. Occurrence of pollen season at the end of the first trimester predicts clinical atopic diseases in the
offspring: A Finnish population-based study. Int. J. Hyg. Environ. Heal. 2020, 225, 113452. [CrossRef]
4. Glick, S.; Gehrig, R.; Eeftens, M. Multi-decade changes in pollen season onset, duration, and intensity: A concern for public
health? Sci. Total Environ. 2021, 781, 146382. [CrossRef] [PubMed]
5. D’Amato, G.; Cecchi, L.; Bonini, S.; Nunes, C.; Annesi-Maesano, I.; Behrendt, H.; Liccardi, G.; Popov, T.; Van Cauwenberge, P.
Allergenic pollen and pollen allergy in Europe. Allergy 2007, 62, 976–990. [CrossRef] [PubMed]
6. Bucchianico, A.D.M.D.; Brighetti, M.A.; Cattani, G.; Costa, C.; Cusano, M.; De Gironimo, V.; Froio, F.; Gaddi, R.; Pelosi, S.; Sfika,
I.; et al. Combined effects of air pollution and allergens in the city of Rome. Urban For. Urban Green. 2018, 37, 13–23. [CrossRef]
7. EAACI, Global Atlas of Allergy, European Academy of Allergy and Clinical Immunology. 2014. Available online: www.eaaci.org
(accessed on 2 April 2023).
8. Sofiev, M.; Bergmann, K.C. Allergenic Pollen—A Review of the Production, Release, Distribution and Health Impacts; Springer: Berlin,
Germany, 2013.
9. Maya-Manzano, J.M.; Smith, M.; Markey, E.; Clancy, J.H.; Sodeau, J.; O’connor, D.J. Recent developments in monitoring and
modelling airborne pollen, a review. Grana 2020, 60, 1–19. [CrossRef]
10. Lam, H.C.; Jarvis, D.; Fuertes, E. Interactive effects of allergens and air pollution on respiratory health: A systematic review. Sci.
Total Environ. 2020, 757, 143924. [CrossRef]
11. APG. An update of the Angiosperm Phylogeny Group classification for the orders and families of flowering plants: APG II. Bot. J.
Linn. Soc. 2003, 141, 399–402. [CrossRef]
12. APG. An update of the Angiosperm Phylogeny Group classification for the orders and families of flowering plants: APG IV. Bot.
J. Linn. Soc. 2016, 181, 2–3.
13. Travaglini, A.; Brighetti, M.A.; Arsieni, A.; Vinciguerra, F. Atlante del Polline delle Principali Specie Allergeniche d’Italia; Il Raggio
Verde: Lecce, Italy, 2014.
14. Rodríguez-Rajo, F.J.; Grewling, L.; Stach, A.; Smith, M. Factors involved in the phenological mechanism of Alnus flowering in
Central Europe. Ann. Agric. Environ. Med. 2009, 16, 277–284.
15. Picornell, A.; Buters, J.; Rojo, J.; Traidl-Hoffmann, C.; Damialis, A.; Menzel, A.; Bergmann, K.; Werchan, M.; Schmidt-Weber,
C.; Oteros, J. Predicting the start, peak and end of the Betula pollen season in Bavaria, Germany. Sci. Total Environ. 2019, 690,
1299–1309. [CrossRef]
16. Muzalyova, A.; Brunner, J.O.; Traidl-Hoffmann, C.; Damialis, A. Forecasting Betula and Poaceae airborne pollen concentrations
on a 3-hourly resolution in Augsburg, Germany: Toward automatically generated, real-time predictions. Aerobiologia 2021, 37,
425–446. [CrossRef]
17. Galán, C.; García-Mozo, H.; Cariñanos, P.; Alcázar, P.; Domínguez-Vilches, E. The role of temperature in the onset of the Olea
europaea L. pollen season in southwestern Spain. Int. J. Biometeorol. 2001, 45, 8–12. [CrossRef]
18. Jäger, S.; Nilsson, S.; Berggren, B.; Pessi, A.-M.; Helander, M.; Ramfjord, H. Trends of some airborne tree pollen in the Nordic
countries and Austria, 1980–1993. Grana 1996, 35, 171–178. [CrossRef]
19. Clot, B. Trends in airborne pollen: An overview of 21 years of data in Neuchâtel (Switzerland). Aerobiologia 2003, 19, 227–234.
[CrossRef]
20. Emberlin, J.; Jaeger, S.; Domínguez-Vilches, E.; Soldevilla, C.G.; Hodal, L.; Mandrioli, P.; Lehtimäki, A.R.; Savage, M.; Spieksma,
F.T.; Bartlett, C. Temporal and geographical variations in grass pollen seasons in areas of west0ern Europe: An analysis of season
dates at sites of the European pollen information system. Aerobiologia 2000, 16, 373–379. [CrossRef]
21. Makra, L.; Matyasovszky, I.; Deák, J. Trends in the characteristics of allergenic pollen circulation in central Europe based on the
example of Szeged, Hungary. Atmos. Environ. 2011, 45, 6010–6018. [CrossRef]
22. Cristofolini, F.; Anelli, P.; Billi, B.M.; Bocchi, C.; Borney, M.F.; Bucher, E.; Cassoni, F.; Coli, S.; De Gironimo, V.; Gottardini, E.; et al.
Temporal trends in airborne pollen seasonality: Evidence from the Italian POLLnet network data. Aerobiologia 2019, 36, 63–70.
[CrossRef]Sustainability 2023, 15, 6150 14 of 15
23. Carslaw, D.C.; Ropkins, K. Openair—An R package for air quality data analysis. Environ. Model. Softw. 2012, 27, 52–61.
24. R Core Team. R: A Language and Environment for Statistical Computing; R Foundation for Statistical Computing: Vienna, Austria,
2013; ISBN 3-900051-07-0. Available online: http://www.R-project.org/ (accessed on 2 April 2023).
25. Mann, H.B. Non-parametric test against trend. Econometrica 1945, 13, 245–259. [CrossRef]
26. Kendall, M.G. A New Measure of Rank Correlation. Biometrika 1938, 30, 81. [CrossRef]
27. Cattani, G.; Di Menno di Bucchianico, A.; Dina, D.; Inglessis, M.; Notaro, C.; Settimo, G.; Viviano, G.; Marconi, A. Evaluation of
the temporal variation of air quality in Rome, Italy from 1999 to 2008. Ann. Ist. Super Sanità 2010, 46, 242–253.
28. Hirsch, R.M.; Slack, L.R. A nonparametric trend test for seasonal data with serial dependence. Water Resour. Res. 1984, 20, 727–732.
[CrossRef]
29. Cunha, M.; Ribeiro, H.; Costa, P.; Abreu, I. A comparative study of vineyard phenology and pollen metrics extracted from
airborne pollen time series. Aerobiologia 2014, 31, 45–56. [CrossRef]
30. Hess, A.; Iyera, H.; MalmbGardner, W. Linear trend analysis: A comparison of methods 2000. Atmos. Environ. 2001, 35, 5211–5222.
[CrossRef]
31. Anttila, P.; Tuovinen, J.P. Trends of primary and secondary pollutant concentrations in Finland in 1994–2007. Atmos. En-Vironment
2010, 44, 30–41. [CrossRef]
32. Hoogerbrugge, R.; Denier van der Gon, H.A.C.; Van Zanten, M.C.; Matthijesen, J. Trends in Particulate Matter, Bihlthoven,
Nether-Lands Research Program on Particulate Matter, Report 500099014. 2010. Available online: https://www.pbl.nl/sites/
default/files/downloads/500099014_0.pdf (accessed on 29 December 2022).
33. Caiola, M.G.; Mazzitelli, A.; Capucci, E.; Travaglini, A. Monitoring pollinosis and airborne pollen in a Rome university. Aerobiologia
2002, 18, 267–275. [CrossRef]
34. Hirst, J.M. Changes in atmospheric spore content: Diurnal periodicity and the effects of weather. Trans. Br. Micol. Soc. 1952, 36,
375–393. [CrossRef]
35. Benninghoff, W.S.; Edmonds, R.L. Ecological Systems Approaches to Aerobiology. I. Identification of Component Elements and Their
Functional Relationships. International Biological Program; University of Michigan: Ann Arbor, MI, USA, 1972.
36. Mandrioli, P. Metodica di campionamento e conteggio dei granuli pollinici e delle spore fungine aerodisperse. In Il Monitoraggio
Aerobiologico in Emilia Romagna; Regione Emilia Romagna, Unità Sanitaria Locale: Ferrara, Italy, 1994; Volume 30, pp. 9–19.
37. UNI EN 16868:2019; Ambient Air—Sampting and Anaiysis of Airborne Pollen Grains and Fungal Spores for Networks Related to
Allergy—Volumetric Hirst Method. UNI EN: Milan, Italy, 2019.
38. Travaglini, A.; Albertini, R.; Zieger, E.; Brighetti, M.A.; Ugolotti, M.; Torrigiani, T. (Eds.) Manuale di Gestione e Qualità della Rete
Italiana di Monitoraggio in Aerobiologia R.I.M.A.® ; Tipografia LEGO: Bologna, Italy, 2009; ISBN 978-88-900277-1-0.
39. Mandrioli, P.; Comtois, P.; Levizzani, V. Methods in Aerobiology; Pitagora Editrice: Bologna, Italy, 1998.
40. ISPRA, POLLnet—Linee Guida per il Monitoraggio Aerobiologico, Manuali e Linee Guida 151/2017, ISPRA, Rome, Italy, ISBN
978-88-448-0820-4. Available online: https://www.isprambiente.gov.it/files2017/pubblicazioni/manuali-linee-guida/445364
_Manuale_linee_guida_151_17.pdf (accessed on 29 December 2022).
41. Hirst, J.M. An automatic volumetric spore trap. Ann. Appl. Biol. 1952, 36, 257–265. [CrossRef]
42. Caulton, E.; Lacey, M.E.; Allitt, U.; Crosby, R.; Emberlin, J.; Hirst, J.M. Airborne Pollens and Spores: A Guide to Trapping and Counting;
The British Aerobiology Federation: Harpenden, UK, 1995.
43. UNI 11 108:2 004; Air Quality; Method for Sampling and Counting Airborne Pollen Grains and Fungal Spores Italy. UNI: Milan,
Italy, 2004.
44. Jato, V.; Rodríguez-Rajo, F.J.; Alcázar, P.; De Nuntiis, P.; Galán, C.; Mandrioli, P. May the definition of pollen season influence
aerobiological results? Aerobiologia 2006, 22, 13–25. [CrossRef]
45. Bastl, K.; Kmenta, M.; Berger, U.E. Defining Pollen Seasons: Background and Recommendations. Curr. Allergy Asthma Rep. 2018,
18, 73. [CrossRef]
46. Alessandro, T. Aerobiological Biodiversity in the Metropolitan City of Rome. Int. J. Environ. Sci. Nat. Resour. 2022, 30, 1–7.
[CrossRef]
47. Galán, C.; Ariatti, A.; Bonini, M.; Clot, B.; Crouzy, B.; Dahl, A.; Fernandez-González, D.; Frenguelli, G.; Gehrig, R.; Isard, S.; et al.
Recommended terminology for aerobiological studies. Aerobiologia 2017, 33, 293–295. [CrossRef]
48. Ziello, C.; Sparks, T.; Estrella, N.; Belmonte, J.; Bergmann, K.C.; Bucher, E.; Brighetti, M.A.; Damialis, A.; Detandt, M.; Galán,
C.; et al. Changes to Airborne Pollen Counts across Europe. PLoS ONE 2012, 7, e34076. [CrossRef] [PubMed]
49. Marchesi, S. Trend analysis of aerobiological indicators associated with allergenic pollens in Emilia-Romagna, Northern Italy.
Aerobiologia 2019, 36, 37–43. [CrossRef]Sustainability 2023, 15, 6150 15 of 15
50. Marchesi, S. Alternaria spores in Emilia-Romagna, Northern Italy: Current diffusion and trends. Aerobiologia 2019, 36, 31–36.
[CrossRef]
51. Di Menno di Bucchianico, A.; Gaddi, R.; Cattani, G.; Brini, S.; Bucher, E.; Rossi, M.; Corona, M.; Pellegrini, E.; Scopano, E.;
Bartiromo, M.; et al. Stato e trend dei principali pollini allergenici in Italia (2003–2019), ISPRA Report 338/2021, ISBN 978-88-
448-1037-5. Available online: https://www.isprambiente.gov.it/it/pubblicazioni/rapporti/stato-e-trend-dei-principali-pollini-
allergenici-in-italia-2003-2019 (accessed on 29 December 2022).
Disclaimer/Publisher’s Note: The statements, opinions and data contained in all publications are solely those of the individual
author(s) and contributor(s) and not of MDPI and/or the editor(s). MDPI and/or the editor(s) disclaim responsibility for any injury to
people or property resulting from any ideas, methods, instructions or products referred to in the content.You can also read