Sunshine Coast Fixed Link Planning Study - BC Ministry of Transportation and Infrastructure - Government of B.C.
←
→
Page content transcription
If your browser does not render page correctly, please read the page content below

Sunshine Coast Fixed Link
               Planning Study

                                            Prepared for
BC Ministry of Transportation and Infrastructure

                                    205 – 4946 Canada Way
                                     Burnaby, BC V5G 4H7
EXECUTIVE SUMMARY

The Sunshine Coast is located northwest of B.C.’s Lower Mainland on the eastern shore of the Strait of
Georgia. It covers an area of approximately 180 kilometres from Gibsons to Lund, with a population base of
approximately 49,000. Primary population centres include Powell River, Sechelt and Gibsons.
The Sunshine Coast is accessible only by BC Ferries, water taxi, commercial and charter air service
(float/airplane), and private boat or plane. The area is divided into two separate land segments. Highway 101 runs
north-south, connecting these two segments via the Earls Cove - Saltery Bay ferry (Route 7) and to the Lower
Mainland by the Horseshoe Bay - Langdale ferry (Route 3).
Sunshine Coast Residents and businesses regularly rely on BC Ferries for commuter trips and access to a range
of services and facilities on the Lower Mainland, including health/medical services not available on the area,
recreational activities, and other services and goods. Tourists and recreational property owners are also key
ferry users. In recent years, immediate and long-term challenges facing the B.C. Coastal ferry system have led
to service reductions for ferry users, with increased pressure during summer months.

About the Study
The Ministry of Transportation and Infrastructure (the Ministry) issued a Request for Proposals in November
2015 to undertake a study of the feasibility of constructing a fixed link between the Sunshine Coast and the
Lower Mainland as an alternative to existing air and ferry services. In February 2016, the Ministry awarded a
contract to R.F. Binnie & Associates Ltd.

The purpose of the study is to:

    •   Assess the costs and benefits of possible future overland connections and bridge crossings between
        the Sunshine Coast and the Lower Mainland;
    •   Identify the financial and physical feasibility of constructing a fixed link;
    •   Undertake a detailed analysis of potential future fixed link scenarios, providing the benefits and
        impacts of each of the scenarios considered, as compared with the current ferry service.

The study included technical analysis and community and stakeholder engagement. The objectives of the
technical analysis are to:

    •   Analyze the technical and financial feasibility as well as the potential customer service, social,
        environmental, and economic costs and benefits of the various crossing alternatives that have been
        suggested in the past, along with potential new connection routes.
    •   Evaluate the scenarios against the existing ferry service through a Multiple Account Evaluation
        (MAE) in accordance with Ministry guidelines. The MAE uses qualitative and quantitative criteria to
        compare expected benefits and costs of the various scenarios against the existing ferry service (Base
        Case), and illustrates the trade-offs between the scenarios.
    •   Build on the results of previous studies, with a more comprehensive MAE and new information about
        potential route scenarios to support an informed discussion about the growing interest in a fixed link
        connection from the Sunshine Coast to the Lower Mainland.

  REPORT PREPARED FOR BC MINISTRY OF TRANSPORTATION AND INFRASTRUCTURE BY R.F. BINNIE & ASSOCIATES LTD., 2017   i
EXECUTIVE SUMMARY

The objective of the community and stakeholder engagement is to ensure that the technical analysis
considers and is informed by the broader community goals, interests and concerns for this area of British
Columbia. Engagement took place in three phases, including:

   •    Background data collection, including meetings and interviews with community leaders and subject
        matter experts to supplement desktop research and assist in developing the draft problem definition
        statement, potential alignment scenarios and preliminary evaluation criteria.

   •    Technical workshops and public open houses to finalize the project definition statement, confirm the
        shortlist of fixed link options to be considered, finalize the evaluation criteria and provide feedback on
        preliminary findings.

   •    Ongoing community and First Nations engagement to keep people informed, maintain open
        dialogue, follow up on issues identified, and to assist in better understanding non-technical interests
        that affect the feasibility of potential fixed link options.

Scenario Development
The Ministry’s Request for Proposals (RFP) identified four potential fixed link connections, two of which
focused on northern connections to Powell River area, and two that focussed on southern connections to the
Gibsons/Sechelt area. Stakeholder and community outreach assisted in identifying alternative scenarios and
variations, which was used to confirm and refine the four representative scenarios that were analyzed, as
summarized in Figure ES-1 and Table ES-1.

  REPORT PREPARED FOR BC MINISTRY OF TRANSPORTATION AND INFRASTRUCTURE BY R.F. BINNIE & ASSOCIATES LTD., 2017   ii
EXECUTIVE SUMMARY

FIGURE ES-1: FIXED LINK SCENARIOS REVIEWED

   REPORT PREPARED FOR BC MINISTRY OF TRANSPORTATION AND INFRASTRUCTURE BY R.F. BINNIE & ASSOCIATES LTD., 2017   iii

EXECUTIVE SUMMARY

TABLE ES-1: FIXED LINK SCENARIOS REVIEWED

         Scenario                                            Key Features                                          Cost Estimate

Langdale Road Link               •     New coastal roadway connecting Port Mellon to Highway                     $2.0 to $2.5 billion
                                       99 near Squamish;
                                 •     Two-lane highway with passing lanes;
                                 •     58 km of extremely difficult new roadway construction
                                       (incl. allowance for rock stabilization and significant
                                       improvements to Depot Road);
                                 •     Requires deep cut sections;
                                 •     Approx. 40 structures for creek/gully crossings;
                                 •     Replaces Route 3 (Horseshoe Bay – Langdale) ferry
                                       service.

Langdale Bridge Link             •     Connects Port Mellon to Highway 99 (near Brunswick                        $3.0 to $3.5 billion
                                       Point) via Anvil Island;
                                 •     Two separate two-lane clear span suspension bridges
                                       (incl. cyclist/pedestrian accommodation);
                                 •     22 km of new roadway construction (mostly extremely
                                       difficult conditions, incl. a new diamond interchange at
                                       Highway 99);
                                 •     Includes a new 14 km roadway from McNab Creek to Port
                                       Mellon.
                                 •     Replaces Route 3 (Horseshoe Bay – Langdale) ferry
                                       service.

Powell River Road Link           •     Connects Powell River to Highway 99 (north of                             $4.5 to $5.0 billion
                                       Brackendale);
                                 •     New inland route through mountainous terrain;
                                 •     Two-lane highway with passing lanes;
                                 •     200 km of new roadway construction;
                                 •     Includes five bridges over creeks and two tunnels
                                       (approx. 8.0 km near Mt. Casement and approx. 4.5 km at
                                       Mt. Alfred);
                                 •     Retains both existing Routes 3 and 7 ferry services.

Powell River Bridge              •     Connects Earls Cove to Saltery Bay via Nelson Island;                     $3.0 to $3.5 billion
Link                             •     Two separate two-lane clear span suspension bridges
                                       (incl. cyclist/pedestrian accommodation);
                                 •     19 km of new roadway construction
                                 •     Replaces Route 7 (Earls Cove – Saltery Bay) ferry service.

   REPORT PREPARED FOR BC MINISTRY OF TRANSPORTATION AND INFRASTRUCTURE BY R.F. BINNIE & ASSOCIATES LTD., 2017                          iv
EXECUTIVE SUMMARY

Ministry design criteria for Rural Arterial Undivided highway were applied for all four of the fixed link
scenarios. Key assumptions for planning and costing purposes were:
   •    Two-lane main roadways, with passing lanes along steep sections;

   •    Posted speed of 80 km/h, with due consideration to navigational clearances, depths of channels and
        span lengths for bridge crossings.

Travel Demand Forecasting
The traffic demand forecasting included the review of a ‘Base Case’ outlook for future auto traffic volumes,
assuming that no fixed link is built and that the BC Ferries’ current Route 3 and 7 continue to operate.
Forecasting for the Base Case assumed average annual traffic growths for Routes 3 and 7, reflecting historic
long-run population trends as well as BC Stats’ future population projections.
Preliminary vehicle traffic forecasts were developed for each of the four fixed link scenarios based on the
following general methodology:

   •    Estimate overall per-trip costs for the current ferry system. These per-trip costs include: trip travel
        time (driving time, terminal waiting time, sailing time), vehicle operating costs, and ferry fares.
   •    Assess the effect of each fixed link scenario on overall per-trip costs: trip travel time, vehicle operating
        costs, and road/bridge toll rates.

   •    Forecast the immediate effect on traffic volumes at project opening (assumed to be 2022) and over
        the longer-term (2040) as a result of future population and traffic growth.

Multiple Account Evaluation
A Multiple Account Evaluation (MAE) of the fixed link
scenarios was conducted in accordance with Ministry
guidelines.      The MAE compares expected
quantitative and qualitative benefits and costs of
each scenario against the Base Case (existing ferry
service), and illustrates trade-offs between the
scenarios. As illustrated in Figure ES-2, the five
standard Ministry evaluation accounts include
Financial, Customer Service, Environment, Economic
and Socio-Community. The Ministry is also engaging
with area First Nations to consider First Nations’
Interests. These discussions are on-going, so for the              FIGURE ES-2: MULTIPLE ACCOUNT EVALUATION
purposes of this report, only publicly available
information about First Nations treaty lands and management areas were considered, in addition to any input
received from meetings that had been held through to the end of December 2016.

  REPORT PREPARED FOR BC MINISTRY OF TRANSPORTATION AND INFRASTRUCTURE BY R.F. BINNIE & ASSOCIATES LTD., 2017   v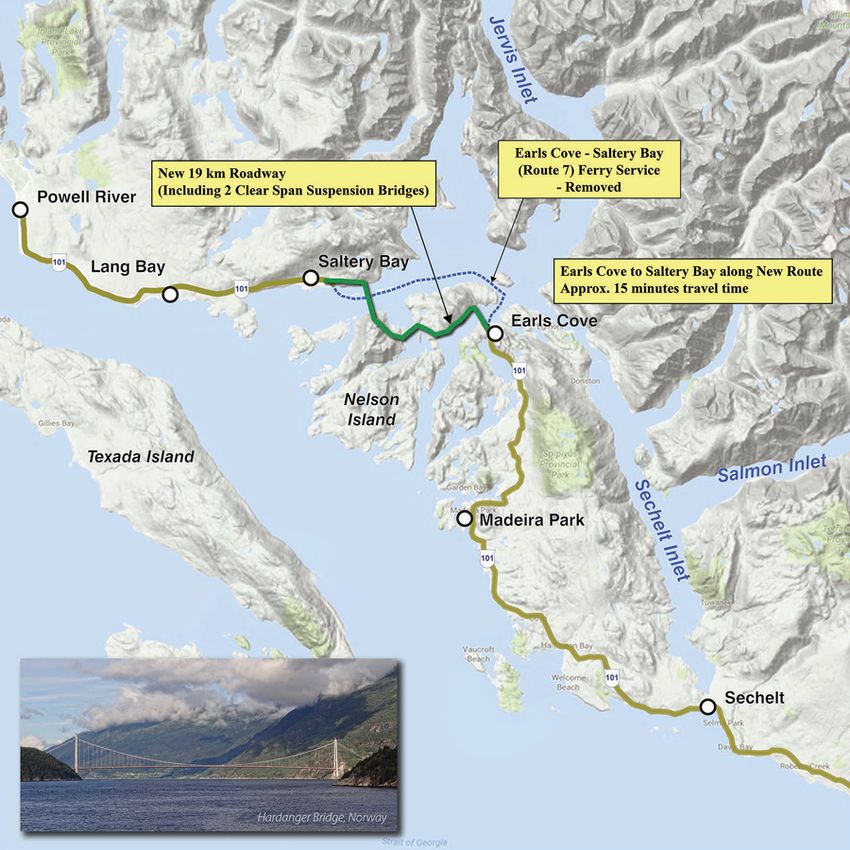
EXECUTIVE SUMMARY

The criteria, or factors, for each account to be assessed were developed based on Ministry requirements, best
practice, and community and stakeholder input received through the engagement process. Scenarios were
evaluated using performance criteria typical for roadway projects, and assuming a 25-year life cycle. It is
recognized that the life cycle for some of the infrastructure elements would extend well beyond this time
frame, and a residual value was applied for these elements at the end of the 25 years. Irrespective of the
account, three general types of criteria were evaluated:

    •    Financially quantifiable revenues and costs;
    •    Other quantifiable benefits and costs (e.g., travel time and safety);
    •    Qualitative benefits and costs.

Table ES-2 summarizes the qualitative criteria assessed for the four fixed-link scenarios.

TABLE ES-2: MULTIPLE ACCOUNT EVALUATION RESULTS (SUBJECTIVE CRITERIA)

   REPORT PREPARED FOR BC MINISTRY OF TRANSPORTATION AND INFRASTRUCTURE BY R.F. BINNIE & ASSOCIATES LTD., 2017   vi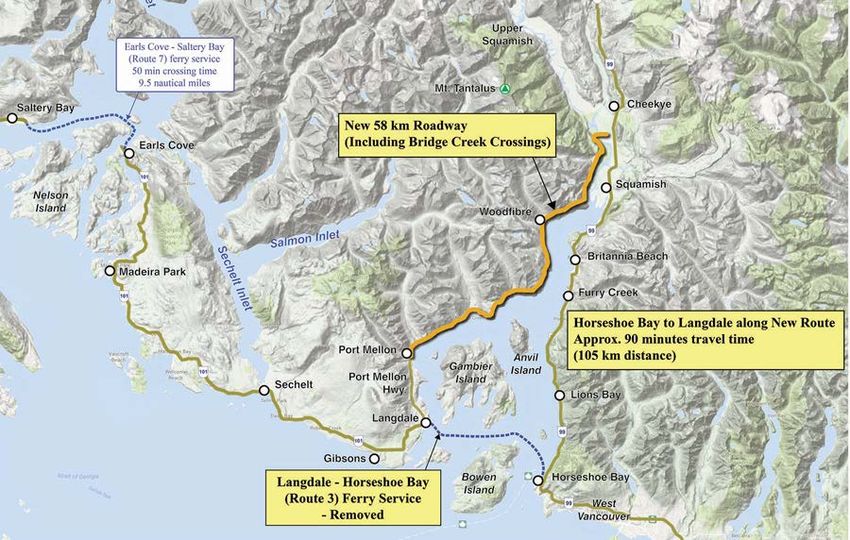
EXECUTIVE SUMMARY

A draft assessment of the qualitative and non-financial quantitative criteria was presented for public and
stakeholder feedback (see below). These criteria were refined and finalized in consideration of the public and
stakeholder input received.

Stakeholder and Public Engagement
Following is a high-level summary of feedback received from all phases of public and stakeholder
engagement, including the three-week public consultation period (October 18 through November 8, 2016)
during which open houses were held in five (5) communities and the online feedback form was available for
people to comment on the draft study findings.

Study Format/Content
     •    High level of interest in the study and general sentiment that the study is long overdue.
     •    General support among stakeholders and the public for the draft Problem Definition Statement, with
          suggestions to confirm changing demographics on the Sunshine Coast and to consider both the
          provincial benefits and the regional benefits of a fixed link.
     •    A number of First Nations and members of the public expressed concerns about potential impacts on
          aboriginal interests, including route alignments that cross through First Nations’ traditional areas and
          management lands. 1
     •    The Islands Trust Committee noted that a fixed link across Anvil Island (the Langdale Bridge Link)
          would run contrary to the Islands Trust Policy Statement, approved by the Province, as well as the
          Official Community Plans of numerous individual islands.
     •    While many participants were pleased that the study is happening, several commented that more
          study would be needed before making a decision whether to proceed. Requested studies included
          environmental impact assessment and a detailed business case.
Route Options
     •    General public support for a potential
          future fixed link, primarily due to
          anticipated improved travel times,
          improved community development,
          and ability to help open up B.C. and
          address B.C.’s jobs and housing
          challenges.
     •    Of those who support a link, the
          Langdale Bridge Link is the preferred
          scenario, as illustrated in Figure ES-3.

     •    Reasons for supporting the Langdale                                               FIGURE ES-3: FIXED LINK SCENARIO PREFERENCES

1
 It is noted that the Ministry continues to engage with First Nations, which may result in changes to the analysis and/or conclusions of
this study.

    REPORT PREPARED FOR BC MINISTRY OF TRANSPORTATION AND INFRASTRUCTURE BY R.F. BINNIE & ASSOCIATES LTD., 2017                   vii
EXECUTIVE SUMMARY

        Bridge Link primarily focused on the fact that it is the fastest alternative.
    •   Reasons for supporting the Powell River Road Link primarily focused on the broader economic
        development potential that this scenario creates. It should be noted, however that many people
        commented that an additional connection between the lower mainland and the B.C. Interior should
        not be a provincial priority at this time.
    •   Support for a Powell River Bridge Link primarily focused on the fact that it would remove one ferry,
        which would provide vastly improved reliability for travellers
    •   Support for a Langdale Road Link primarily focused on lower costs as compared with other scenarios;
        however, many respondents expressed concern about the additional travel time this scenario would
        create, as compared with existing ferry service or a Langdale Bridge Link.
    •   While fewer numbers of consultation participants opposed a fixed link, many of those who did
        expressed strong concerns about potential community impacts and changes to their way of life.
    •   Some participants indicated that they would prefer improved ferry service to a fixed link.
Multiple Account Evaluation
    •   Interest in evaluating the options from the perspective of local benefits and broader provincial
        benefits.
    •   Desire for an equally robust analysis of the base case (ferry service), including suppressed demand
        analysis, commuter vs. economic generating traffic, growth analysis and economic opportunities.
Financial Considerations
    •   Numerous comments about the importance of considering all costs, including local infrastructure
        costs associated with increased population or visitor traffic, costs (or avoided costs) of Horseshoe Bay
        and Langdale terminal upgrades.
    •   Municipalities and Regional Districts expressed concerns about potential effects on other
        infrastructure like water and sewer that would come with increased population and tourism.
    •   Whether for or against a fixed link, many people questioned the additional congestion impacts this
        scenario would have on Highway 99 and Highway 101 traffic.

Economic and Financial Analysis
As a final stage of analysis, each of the scenarios was also evaluated in terms of their relative attractiveness
from an economic benefit cost analysis (BCA) perspective, as measured by Net Present Value (NPV) and
Benefit-Cost Ratio (BCR). Both metrics provide information on the financial feasibility of a project, and are
summarized in Table ES-3.

    •   For the Powell River Bridge Link, user benefits would be positive, since the bridge would offer
        convenient and direct access between the Sunshine Coast and the Powell River Regional District.
        However, given the relatively modest traffic volumes for this link, the net user benefits would be small
        in comparison to additional costs of construction, maintenance and rehabilitation. As a result, the
        NPV calculation is negative (minus $1.7 to $2.0 billion) and the BCR calculation is small (0.050 to
        0.042).

  REPORT PREPARED FOR BC MINISTRY OF TRANSPORTATION AND INFRASTRUCTURE BY R.F. BINNIE & ASSOCIATES LTD., 2017   viii
EXECUTIVE SUMMARY

    •    The Langdale Bridge Link has higher potential user benefits than the Powell River Bridge Link,
         reflecting its expected higher traffic volumes. However, these user benefits are also small in relation
         to the additional costs of construction, maintenance and rehabilitation. As a result, the NPV
         calculation is negative (minus $1.3 to $1.6 billion) and the BCR calculation is relatively small (0.255 to
         0.215).

    •    For the two road-based fixed link scenarios, a preliminary BCA found that the net user benefits would
         be negative. This is because the circuitous nature of the road-based routes adds travel time, vehicle
         operating costs and additional roadway collisions as compared with current ferry services. As with the
         bridge link scenarios, the NPVs are negative (minus $1.5 to $1.9 billion and minus $3.1 to $3.4 billion
         for the Langdale and Powell River Road Links respectively). Additionally, the BCR calculations are also
         negative for both the Langdale and Powell River Road Links.

TABLE ES-3: ECONOMIC ANALYSIS SUMMARY – FIXED LINK SCENARIOS REVIEWED

                                                   Powell River        Powell River         Langdale              Langdale
                                                    Bridge Link         Road Link          Bridge Link            Road Link
Capital and Operations, Maintenance and            $2.4 to $2.8        $4.0 to $4.4        $3.0 to $3.4          $2.1 to $2.5
Rehabilitation Costs                                  Billion             Billion             Billion               Billion
                                                   -$1.7 to -$2.0     -$3.1 to -$3.4      -$1.3 to -$1.6         -$1.5 to -$1.9
Net Present Value (NPV)
                                                       Billion            Billion             Billion                Billion

Benefit-Cost Ratio (BCR)                          0.050 to 0.042
EXECUTIVE SUMMARY
TABLE ES-4: ECONOMIC ANALYSIS SUMMARY – LANGDALE BRIDGE LINK
Ferry Service Langdale Bridge Incremental
Accounts
(Route 3) Link Change
Financial Costs
Capital Costs (Present Value) $ 242 $ 2,632 to $ 2,390 to
$ 3,034 $2,792
O, M & R Costs (Road & Ferry Operations) $ 513 $ 320 -$ 193
Salvage Value -$ 33 -$ 518 to -$ 485 to
-$ 600 -$ 567
Total Financial Cost $ 722 $ 2,434 to $ 1,712 to
($Capital + O&M + Property) $ 2,755 $2,033
User Costs / Benefits
Travel Cost (incl. Time and Op. Costs) $ 2,187 $ 1,645 $ 542
Safety (Collision Cost) -$ 105
Total User Cost $ 2,187 $ 1,645 $ 437
($ Travel Cost + Safety)
Net Present Value (NPV) -$ 1,275 to
-$ 1,596
Benefit — Cost Ratio (BCR) 0.255 to
0.215
Note: Present Value of capital costs are used rather than the cost estimate values due to the discounting of future
money spent back to the present.
Conclusions
Acknowledging the limitations of the early level of conceptual engineering undertaken as part of this study,
the four fixed link scenarios between the Lower Mainland and the Sunshine Coast appear to be technically
feasible. However, the extremely challenging construction terrain in the area, including steep rocky terrain,
mountain passes, and deep water channels, would result in very high capital costs for all of the scenarios
assessed. Consideration of all of the accounts assessed suggests that while there is a high degree of support
for the concept of a fixed link, the overall feasibility of such a link is less clear.
From a financial feasibility perspective, none of the options perform strongly. Preliminary analysis indicates
that only the Langdale Bridge Link has potential to achieve some cost recovery at ferry-equivalent toll rates.
(Appendix F)
REPORT PREPARED FOR BC MINISTRY OF TRANSPORTATION AND INFRASTRUCTURE BY R.F. BINNIE & ASSOCIATES LTD., 2017 xEXECUTIVE SUMMARY In terms of economic benefits and costs, however, all four of the scenarios have strongly negative Net Present Values (NPVs), reflecting the very high provincial capital and operating costs in relation to the potential user benefits. User benefits are limited because of modest forecast traffic volumes, as well the additional travel distances associated with three of the scenarios. With regard to the benefit cost ratios (BCRs), the two road-based fixed link scenarios have BCRs that are negative because of the circuitous nature of the road routes, while the Langdale and Powell River bridge-based scenarios have BCRs that are less than 1 (0.25 and 0.05 respectively). While the economic benefit cost assessment is based on ferry-equivalent toll rates, sensitivity analysis confirms that, even with the greater number of travelers associated with a scenario of an un-tolled facility; none of the scenarios would have a positive NPV (see Appendix F). This calculation is prior to consideration of economic development benefits, which are not included in the scope of quantified benefits and costs, but are qualitatively assessed as providing additional longer-run economic benefits. From a customer service perspective, input received as part of the public consultation suggests general support of a fixed link connection, with the Langdale Bridge Link as the preferred scenario. Key reasons stated for support for a fixed link include improved travel times, improved community development, addressing B.C.’s jobs and housing challenges, and opening up B.C. It should be noted, however, that consultation participants also expressed concerns about the potential negative effects of a fixed link for cyclists and pedestrians, given that analysis of transit service is outside of the scope of this study. With respect to socio-community considerations, a number of people opposed a fixed link out of concern for potential community impacts and changes to their way of life. Finally, it is recognized that the Sunshine Coast has been used for centuries by numerous First Nations, and that any fixed link alignment likely would traverse through the proximities of First Nations’ management areas and potentially through archaeological sites. A number of First Nations and many community leaders and members of the public also expressed concerns about the effects of a fixed link on First Nations traditional and current interests. REPORT PREPARED FOR BC MINISTRY OF TRANSPORTATION AND INFRASTRUCTURE BY R.F. BINNIE & ASSOCIATES LTD., 2017 xi
C o nt en ts

               1      Introduction ....................................................................................... 1
                      1.1     Project Background and Objectives.............................................................. 1
                      1.2     Previous Studies ........................................................................................... 2

               2      Existing Conditions............................................................................. 3
                      2.1     Overview....................................................................................................... 3
                      2.2     Regions and Major Centres/Populations ...................................................... 3
                      2.3     Growth Statistics .......................................................................................... 4
                      2.4     Transportation .............................................................................................. 5

               3      Travel Demand Forecasts .................................................................. 9
                      3.1     Overview....................................................................................................... 9
                      3.2     Traffic Outlook – Base Case ................................................................... 10
                      3.3     Traffic Outlook - Fixed Link Scenarios......................................................... 13
                      3.4     Traffic Forecast Summary ...................................................................... 18

               4      Scenario Development (Road & Bridge Links)) ............................... 19
                      4.1     Overview..................................................................................................... 19
                      4.2     Alternative Scenarios Considered .............................................................. 21
                      4.3     Engineering Design Considerations ............................................................ 23
                      4.4     Langdale Road Link ..................................................................................... 28
                      4.5     Langdale Bridge Link ................................................................................... 29
                      4.6     Powell River Road Link ............................................................................... 31
                      4.7     Powell River Bridge Link ............................................................................. 32

               5      Cost Estimates.................................................................................. 34
                      5.1     Overview..................................................................................................... 34
                      5.2     Cost Estimate Summaries ........................................................................... 37

               6      Multiple Account Evaluation ...............Error! Bookmark not defined.
                      6.1     Overview..................................................................................................... 39
                      6.2     Financial Account ....................................................................................... 40
                      6.3     Customer Service Account.......................................................................... 41

REPORT PREPARED FOR BC MINISTRY OF TRANSPORTATION AND INFRASTRUCTURE BY R.F. BINNIE & ASSOCIATES LTD., 2017                                       i
CONTENTS
6.4 Socio-Community Account ......................................................................... 43
6.5 Environmental Account .............................................................................. 45
6.6 Economic Development Account ............................................................... 46
6.7 First Nations ............................................................................................... 47
6.8 MAE Summary ............................................................................................ 48
7 Conclusion........................................................................................ 54
8 References ....................................................................................... 57
Appendices
Appendix A: Alignment Drawings
Appendix B: Bridge Crossings Paper
Appendix C: Environmental Review
Appendix D: First Nations Areas
Appendix E: Consultation Summary Report
Appendix F: Impact of Tolling on Economic/Financial Outlook
Tables
Table 2-1: Regions and Major Centres Populations ........................................................... 3
Table 2-2: Growth Statistics (1991-2015)........................................................................... 4
Table 2-3: Existing Sunshine Coast Ferry Services (based on 2015 statistics) .................... 8
Table 3-1: BC Ferries Seasonal Variations in Number of Sailings (Existing) ..................... 13
Table 3-2: BC Ferries 2015 Sailings, Utilization and Overloads (Annual Totals) ............... 13
Table 3-3: Traffic Forecast Summary (Average Daily Traffic, Both Directions) ................ 18
Table 4-1: Roadway Design Criteria ................................................................................. 27
Table 5-1: Powell River Road Link – Cost Estimate .......................................................... 37
Table 5-2: Powell River Bridge Link (Via Nelson Island) – Cost Estimate ......................... 37
Table 5-3: Langdale Road Link – Cost Estimate ................................................................ 38
Table 5-4: Langdale Bridge Link (Via Anvil Island) – Cost Estimate .................................. 38
Table 6-1: Economic Analysis summary – Sunshine Coast Scenarios............................... 48
Table 6-2: Economic Analysis Summary – Powell River Scenarios ................................... 50
Table 6-3: Subjective Criteria Evaluations – Customer Service ........................................ 51
Table 6-4: Subjective Criteria Evaluations – Socio-Community ....................................... 52
Table 6-5: Subjective Criteria Evaluations – Environment ............................................... 52
REPORT PREPARED FOR BC MINISTRY OF TRANSPORTATION AND INFRASTRUCTURE BY R.F. BINNIE & ASSOCIATES LTD., 2017CONTENTS
Table 6-6: Subjective Criteria Evaluations – Economic Development .............................. 53
Table 6-7: Subjective Criteria Evaluations – First Nations ................................................ 53
Figures
Figure 2-1: Regional Districts Map ..................................................................................... 4
Figure 2-2: Existing Road Network ..................................................................................... 6
Figure 2-3: Existing Sunshine Coast Ferry Services ............................................................ 7
Figure 3-1: Fixed Link Scenarios Reviewed ....................................................................... 10
Figure 3-2: BC Ferries Average Daily Traffic Volumes ...................................................... 11
Figure 3-3: BC Ferries Route 3 Langdale - Mode Splits (Existing) ..................................... 11
Figure 3-4: BC Ferries Route 7 Powell River - Mode Splits (Existing) ............................... 12
Figure 3-5: Traffic Volume Forecasts – Langdale Road and Bridge Link Scenarios .......... 15
Figure 3-6: Traffic Volume Forecasts – Langdale Road and Bridge Link Scenarios
(Origins/Destinations) ............................................................................... 16
Figure 3-7: Traffic Volume Forecasts – Powell River Road and Bridge Link Scenarios ..... 17
Figure 3-8: Traffic Volume Forecasts – Powell River Road and Bridge Link Scenarios
(Origins/Destinations) ............................................................................... 17
Figure 4-1: Fixed Link Scenarios Reviewed ....................................................................... 20
Figure 4-2: Alternative Scenarios Considered .................................................................. 21
Figure 4-3: Typical Roadway Cross-Section ...................................................................... 26
Figure 4-4: Langdale Road Link ........................................................................................ 28
Figure 4-5: Langdale Bridge Link ...................................................................................... 29
Figure 4-6: Powell River Road Link ................................................................................... 31
Figure 4-7: Powell River Bridge Link ................................................................................. 32
Figure 6-1: Multiple Account Evaluation .......................................................................... 40
REPORT PREPARED FOR BC MINISTRY OF TRANSPORTATION AND INFRASTRUCTURE BY R.F. BINNIE & ASSOCIATES LTD., 2017I nt r od uc t i on
1 Introduction
1.1 Project Background and Objectives
The Sunshine Coast is located northwest of the Lower Mainland on the eastern shore of the Strait of
Georgia covers an area of approximately 180 kilometres from Gibsons to Lund, with a population of
approximately 49,000. Primary population areas include Powell River, Sechelt and Gibsons.
The Sunshine Coast is accessible only by BC Ferries, water taxi, commercial and charter air service
(float/airplane), and private boat or plane. The area is divided into two separate land segments.
Highway 101, which runs north-south, connecting these two segments via BC Ferries’ Earls Cove - Saltery
Bay ferry (Route 7) and to the Lower Mainland by the Horseshoe Bay - Langdale ferry (Route 3).
Sunshine Coast residents and businesses regularly rely on BC Ferries for commuter trips and access to a
range of services and facilities on the Lower Mainland, including health/medical services not available in
the area, recreational activities and other services and goods. Tourists and recreational property owners
are also key ferry users. In recent years, immediate and long-term challenges facing the B.C. Coastal
ferry system have led to service reductions for ferry users, with increased pressure during summer
months.
With lower growth and economic development as compared with other regions in the Province (despite
the area’s proximity to the Lower Mainland), and recognizing the recent historical trend of an aging
population base, various Sunshine Coast community representatives and residents are increasingly
advocating for a cost-effective fixed link connection to the Lower Mainland, with the intent to address
access and reliability challenges and support sustainable growth and economic development.
The B.C. Ministry of Transportation and Infrastructure (MOTI) issued a Request for Proposals in
November 2015 to undertake a study of the feasibility of constructing a fixed link between the Sunshine
Coast and the Lower Mainland as an alternative to existing air and ferry services. In February 2016,
MOTI awarded a contract to R.F. Binnie & Associates Ltd.
The purpose of the study is to:
• Assess the costs and benefits of possible future overland connections and bridge crossings
between the Sunshine Coast and the Lower Mainland;
• Identify the financial and physical feasibility of constructing a fixed link;
• Undertake a detailed analysis of potential future fixed link scenarios, providing the benefits and
impacts of each of the scenarios considered, as compared with the current ferry service.
REPORT PREPARED FOR BC MINISTRY OF TRANSPORTATION AND INFRASTRUCTURE BY R.F. BINNIE & ASSOCIATES LTD., 2017 1INTRODUCTION
The study included technical analysis and community and stakeholder engagement. The objectives of
this feasibility study are as follows:
• Analyze the technical and financial feasibility as well as the potential customer service, social,
environmental, and economic costs and benefits of the various crossing alternatives that have
been suggested in the past, along with potential new connection routes.
• Evaluate the scenarios against the existing ferry service through a Multiple Account Evaluation
(MAE) in accordance with Ministry guidelines. The MAE uses qualitative and quantitative criteria
to compare expected benefits and costs of the various scenarios against the existing ferry
service (Base Case), and illustrates the trade-offs between the scenarios. The evaluation
considers desktop research, First Nations interests, consultation input, engineering and
environmental expertise, and best practice.
• Build on the results of previous studies, with a more comprehensive MAE and new information
about potential route scenarios to support an informed discussion about the growing interest in
a fixed link connection from the Sunshine Coast to the Lower Mainland.
The objective of the community and stakeholder engagement is to ensure that the technical analysis
considers and is informed by the broader community goals, interests and concerns for this area of
British Columbia. The engagement sought input and feedback on the draft problem definition,
potential alignment scenarios, the MAE evaluation criteria, and preliminary MAE findings. This
component of the study is discussed in detail in the Consultation Summary Report (Appendix E). The
balance of this report focuses on the technical analysis.
1.2 Previous Studies
The BC Ministry of Transportation and Infrastructure (MOTI) has twice conducted a high-level analysis of
potential road connections to and from the Sunshine Coast – one in 1998 and another in 2001.
• The 1998 “Powell River to Squamish Valley Road Link” review identified a high-level construction
cost estimate and a conceptual alignment; and
• The 2001 “Conceptual Alignment Study, Sunshine Coast and the Sea to Sky Highway” identified a
conceptual alignment and cost estimate for a fixed link between Port Mellon and Squamish.
Both of the above reviews focused on the technical feasibility of such a connection, and both concluded
that the estimated costs and travel times were less desirable compared to the ferry services at the time.
REPORT PREPARED FOR BC MINISTRY OF TRANSPORTATION AND INFRASTRUCTURE BY R.F. BINNIE & ASSOCIATES LTD., 2017 2Existing Conditions
2 Existing Conditions
2.1 Overview
This section briefly summarizes the existing regional and major centre populations, and recent historical
growth for the Powell River, Sunshine Coast, and Squamish-Lillooet Regional Districts. It also provides a
summary of the existing transportation facilities providing accessibility/service to and from the Sunshine
Coast and Powell River communities. The existing conditions review is based on desktop assessments
and data information obtained from BC Statistics, MOTI, and BC Ferries.
2.2 Regions and Major Centres/Populations
The following is a brief summary of the existing regional and major centre populations for the Powell
River, Sunshine Coast, and Squamish-Lillooet Regional Districts obtained from BC Stats.
TABLE 2-1: REGIONS AND MAJOR CENTRES POPULATIONS
Powell River Regional District (PRRD); Population: 20,000
MAJOR CENTRES POPULATION
Powell River 13,000
Sunshine Coast Regional District (SCRD); Population: 29,000
MAJOR CENTRES POPULATION
Sechelt 10,000
Gibsons 4,500
Squamish Lillooet Regional District (SLRD); Population: 40,000
MAJOR CENTRES POPULATION
Squamish 18,500
Whistler 10,000
Lillooet 2,500
BC Population: 4.68 million
REPORT PREPARED FOR BC MINISTRY OF TRANSPORTATION AND INFRASTRUCTURE BY R.F. BINNIE & ASSOCIATES LTD., 2017 3EXISTING CONDITIONS
2.3 Growth Statistics
As illustrated in the following table, SCRD’s population increased an average of 1.3% annually between
1991 and 2015, while PRRD’s population was almost unchanged. These growth rates were significantly
lower than for the adjacent Squamish-Lillooet Regional District (including Whistler), as well as for the
Metro Vancouver area.
TABLE 2-2: GROWTH STATISTICS (1991-2015)
Average Annual
1991 2015
Increase
Sunshine Coast Regional District (SCRD) 21,337 29,177 1.3%
Powell River Regional District (PRRD) 19,623 19,481 –
Total SCRD plus PRRD 40,960 48,658 0.7%
xxxxxxxxxxxxxxxxxxxxx xxxxxxxxxxxxxxxxxxxxx xxxxxxxxxxxxxxxxxxxxx
Other areas:
• Squamish-Lillooet Regional District 25,069 40,378 2.0%
• Greater Vancouver (Metro Van) 1,647,055 2,513,856 1.8%
FIGURE 2-1: REGIONAL DISTRICTS MAP
REPORT PREPARED FOR BC MINISTRY OF TRANSPORTATION AND INFRASTRUCTURE BY R.F. BINNIE & ASSOCIATES LTD., 2017 4EXISTING CONDITIONS
2.4 Transportation
The following provides a brief summary of the existing transportation facilities providing accessibility/
service to and from the Sunshine Coast and Powell River communities.
2.4.1 Major Roads
Major roadways currently servicing the Sunshine Coast include:
• Highway 99
o North-south Sea-to-Sky coastal to inland route connects Vancouver to Lillooet, (150 km)
with connections to Horseshoe Bay, Squamish, Whistler and Pemberton.
o Serves 3,900 vehicles per day north of Whistler and 17,500 vehicles per day north of
Horseshoe Bay.
o The existing posted speed along this section of Highway 99 is predominantly 80 km/h.
o Highway 101
o The main north-south thoroughfare on the Sunshine Coast; two-lane rural 159-km long
roadway with auxiliary lanes through developed areas. It connects Gibson’s to Powell
River and points north via ferry link (see below).
o Serves an average of 1,000 vehicles per day near Powell River and 10,000 vehicles per
day near Gibsons.
o The existing posted speeds along Highway 101 vary, but predominantly comprise of 60
to 80 km/h sections.
• Port Mellon Highway
o Two-lane rural, north-south coastal route from Hopkins Landing to Port Mellon (12 km)
and is the primary route to the Howe Sound Pulp and Paper mill at the southern end of
the lower Sunshine Coast.
o Traffic statistics are not available; however, weekday traffic primarily consists of logging
trucks and commuters to/from the mill.
o The existing posted speed along the Port Mellon Highway is 60 km/h.
REPORT PREPARED FOR BC MINISTRY OF TRANSPORTATION AND INFRASTRUCTURE BY R.F. BINNIE & ASSOCIATES LTD., 2017 5EXISTING CONDITIONS
FIGURE 2-2: EXISTING ROAD NETWORK
2.4.2 Air Services
Existing air services servicing the Sunshine Coast are:
• Sechelt
o Harbour Air – daily service from Porpoise Bay to Vancouver harbour (downtown), YVR,
Nanaimo, Whistler, Comox and Victoria
o Sunshine Coast Air – daily service from Porpoise Bay to Vancouver harbour, Nanaimo
and Victoria
o Fly! Coastal Airlines – provides flights from Sechelt Airport to the Victoria Flying Club
(near Victoria International Airport)
• Powell River
o Pacific Coastal Airlines provides service from YVR south terminal
o Charter service available to Sechelt and Powell River
REPORT PREPARED FOR BC MINISTRY OF TRANSPORTATION AND INFRASTRUCTURE BY R.F. BINNIE & ASSOCIATES LTD., 2017 6EXISTING CONDITIONS
2.4.3 Ferry Services
The existing BC Ferries routes servicing the Sunshine Coast are:
• Horseshoe Bay – Langdale (Route 3)
o Served by the Queen of Coquitlam, capacity of 360 vehicles.
• Earls Cove – Saltery Bay (Route 7)
o Passage between Sechelt and Powell River via Highway 101; served by the Island Sky,
capacity of 125 vehicles.
Earls Cove - Saltery Bay Ferry
Horseshoe Bay -
Langdale Ferry
FIGURE 2-3: EXISTING SUNSHINE COAST FERRY SERVICES
REPORT PREPARED FOR BC MINISTRY OF TRANSPORTATION AND INFRASTRUCTURE BY R.F. BINNIE & ASSOCIATES LTD., 2017 7EXISTING CONDITIONS
TABLE 2-3: EXISTING SUNSHINE COAST FERRY SERVICES (BASED ON 2015 STATISTICS)
Horseshoe Bay – Langdale Earls Cove – Saltery Bay
FREQUENCY Eight round trips per day Seven round trips per day
(more in summer/long weekends) (eight on Sundays)
6:20 a.m. to 9:45 p.m. 5:30 a.m. to 10:30 p.m.
ANNUAL VOLUMES 1.2 million vehicles (AEQ) 185,000 vehicles (AEQ)
2.5 million passengers 325,000 passengers
ANNUAL UTILIZATION 55% 29%
Very high in summer/long weekends During summer, avg.46 vehicles/trip
– avg.205 vehicles/ trip
RELIABILITY 77% of sailings occurred within 10 95% within 10 minutes of schedule
minutes of schedule
17% overloads 2% overloads
REPORT PREPARED FOR BC MINISTRY OF TRANSPORTATION AND INFRASTRUCTURE BY R.F. BINNIE & ASSOCIATES LTD., 2017 8T r av e l D em and F o rec as ts
3 Travel Demand Forecasts
3.1 Overview
This section first reviews the “Base Case” outlook for future auto traffic volumes, assuming that no fixed
link is built and that the BC Ferries’ current Route 3 and Route 7 continue to operate on Highway 101.
On BC highways outside urban areas, traffic forecasting is typically carried out using a trend analysis
based on past traffic volumes. In the case of the Sunshine Coast Fixed Link (SCFL) Planning Study, this
trend analysis was carried out for the two BC Ferries routes serving the Sunshine Coast and Powell River
Regional Districts.
The section then goes on to forecast the traffic volumes potentially associated with each of the four
fixed link scenarios as identified in the Request for Proposals (RFP) document (see Figure 3-1), and how
they differ from the Base Case forecasts. Where a fixed link scenario is forecast to lead to an increase in
future traffic levels, it is due to two sources:
• Initially generated traffic is the traffic that currently wants to travel, but is not doing so because
of the differences in the travel characteristics between ferry and fixed link trips. This traffic
demand would be released upon opening of the fixed link project, reflecting the reduction in
overall travel times and/or the elimination of the current limitations on time of travel associated
with ferry service. Historical and current traffic trends on Highway 99 to Squamish, Whistler and
Pemberton provide useful insights into the levels of traffic increases associated with each of the
fixed link options.
• Longer-run traffic growth is the additional traffic growth that would occur over time under each
of the fixed link scenarios. This additional traffic results from the greater economic and
population growth associated with having a fixed link.
The following traffic forecasts, including the additional traffic associated with each fixed link scenario,
consider multiple factors including changes in travel times, vehicle operating costs, ferry/toll rates, and
other travel characteristics. Travel time estimates for ferries include terminal waiting times as well as
sailing times.
REPORT PREPARED FOR BC MINISTRY OF TRANSPORTATION AND INFRASTRUCTURE BY R.F. BINNIE & ASSOCIATES LTD., 2017 9TRAVEL DEMAND FORECASTS FIGURE 3-1: FIXED LINK SCENARIOS REVIEWED 3.2 Traffic Outlook – Base Case 3.2.1 Annual Ridership As illustrated in Figure 3-2, in 2015 an average of 3,030 vehicles per day (two-way total) travelled on Route 3 (Horseshoe Bay to/from Langdale) in 2015, of which an estimated 2,840 traveled to/from the Sunshine Coast and 190 traveled to/from Powell River. Route 7 (Sunshine Coast to/from Powell River) served an average of 475 vehicles per day, with 190 travelling to/from Horseshoe Bay on Route 3 and 285 to/from the Sunshine Coast. REPORT PREPARED FOR BC MINISTRY OF TRANSPORTATION AND INFRASTRUCTURE BY R.F. BINNIE & ASSOCIATES LTD., 2017 10
TRAVEL DEMAND FORECASTS

FIGURE 3-2: BC FERRIES AVERAGE DAILY TRAFFIC VOLUMES

                                                       BC Ferries Average Daily Traffic Volumes (2-way)
                                               4,500
                                                                            3,870 Total
                                               4,000
                                                                                230
                                                        3030 Total
                     Daily Traffic (Veh/day)
                                               3,500         Vancouver -           2,840
                                               3,000          Vancouver -
                                                             190                     190
                                               2,500
                                               2,000
                                                                               3,640
                                               1,500        2,840
                                               1,000                                           475 Total            570 Total
                                                500                                                                      340
                                                                                                    285
                                                  0                                                 190                  230
                                                         Rte 3 (2015)       Rte 3 (2040)       Rte 7 (2015)          Rte 7 (2040)

                                               Vancouver - Sunshine Coast    Vancouver - Powell River     Sun. Coast - Powell River

Figure 3-2 also illustrates the Base Case outlook for 2040, with continued ferry operations. These
volumes represent forecast average annual traffic growth of 1.0% for Route 3 and 0.7% for Route 7
traffic, reflecting historic long-run population trends as well as BC Stats’ future population projections.

Figure 3-3 presents the various modes which currently utilize Route 3. Twenty-one percent (21%) of the
passengers are foot passengers, with the remaining 79% arriving via vehicular traffic. Of the vehicular
traffic, 95% are passenger vehicles with only 3% and 2% being commercial and motorcycle traffic
respectively. Less than 1% of the vehicles are buses.

FIGURE 3-3: BC FERRIES ROUTE 3 LANGDALE - MODE SPLITS (EXISTING)

REPORT PREPARED FOR BC MINISTRY OF TRANSPORTATION AND INFRASTRUCTURE BY R.F. BINNIE & ASSOCIATES LTD., 2017                           11
TRAVEL DEMAND FORECASTS Figure 3-4 presents the various modes which currently utilize Route 7. In this case, only 1% of the passengers are foot passengers, with the remaining 99% arriving via vehicular traffic. Of the vehicular traffic, 94% are passenger vehicles with only 5% and 1% being commercial and motorcycle traffic respectively. Less than 1% of the vehicles are buses. FIGURE 3-4: BC FERRIES ROUTE 7 POWELL RIVER - MODE SPLITS (EXISTING) REPORT PREPARED FOR BC MINISTRY OF TRANSPORTATION AND INFRASTRUCTURE BY R.F. BINNIE & ASSOCIATES LTD., 2017 12
TRAVEL DEMAND FORECASTS

3.2.2 Seasonal/Time-of-Day/Day-of-Week Patterns
 As illustrated in Table 3-1, the average number of vehicles per sailing is highest during the busy summer
season, and lowest during the winter season.

TABLE 3-1: BC FERRIES SEASONAL VARIATIONS IN NUMBER OF SAILINGS (EXISTING)

                                                                   Capacity          Average Daily Trips per Sailing (2015)
Route                            Vessel
                                                               (# of Vehicles)       Winter      Spring       Summer         Fall
3: Horseshoe Bay - Langdale      Queen of Coquitlam                   360              155        190          205           170

7: Sechelt – Powell River        Island Sky                           125               22         31           46           26

There are also very significant differences in traffic levels by season, by time of day, and by day of week.
For example, while Route 3 sailings averaged up to 205 vehicles per ferry (57% of capacity) during the
summer, approximately 17% of sailings during the year faced an overload situation (i.e., had to leave
vehicles at the terminal). This speaks to the heavily peaked desire for use during weekends and in the
summer.

TABLE 3-2: BC FERRIES 2015 SAILINGS, UTILIZATION AND OVERLOADS (ANNUAL TOTALS)

                                  Round          Capacity           Carried        Utilization    Overloads      Passengers
Route
                                   Trips          (AEQ)              (AEQ)                         (% trips)           (#)

3: Horseshoe Bay - Langdale          3,020         2,186,118         1,205,768        55%               17%          2,483,071

7: Sechelt – Powell River            2,542           624,952           185,657        30%               2%             324,841
 AEQ: Auto Equivalents

3.3 Traffic Outlook - Fixed Link Scenarios
3.3.1 Methodology Overview
Preliminary vehicle traffic forecasts have been developed for each of the four fixed link scenarios. The
methodology is summarized as follows:

     •    Estimate overall per-trip costs under the current ferry system. These per-trip costs include: (1)
          trip travel time (driving time, terminal waiting time, sailing time), (2) vehicle operating costs, (3)
          ferry rates.

     •    Estimate overall per-trip costs for each scenario, also in terms of: (1) trip travel time, (2) vehicle
          operating costs, (3) road/bridge toll rates.

REPORT PREPARED FOR BC MINISTRY OF TRANSPORTATION AND INFRASTRUCTURE BY R.F. BINNIE & ASSOCIATES LTD., 2017                         13
TRAVEL DEMAND FORECASTS
• Forecast the immediate (2022) impact on traffic volumes on project opening, as well as the
longer-term (2023 – 2040) impact on future population and traffic growth.
Future traffic volumes will depend to some extent on whether each of the fixed links is tolled, and if so
at what rate(s). While no decision has been made with respect to tolling, for the purposes of this
preliminary analysis it is assumed that each scenario is tolled at ferry-equivalent rates (i.e., toll rate at
the same cost as the ferry fare).
3.3.2 Traffic Outlook – Langdale (SCRD) Scenarios
The traffic forecasts for the road and bridge links for the two Langdale (SCRD) scenarios are illustrated in
Figures 3-5 and 3-6, and are discussed as follows:
Langdale Road Link
• This link would replace Route 3 (Horseshoe Bay-Langdale). It would be used for trips between
Metro Vancouver and SCRD/PRRD.
• This route, passing through Squamish, would be circuitous. The overall per-trip user cost
between Metro Vancouver and SCRD/PRRD is forecast to increase from the Base Case (Route 3
ferry) because of the additional travel time and vehicle operating costs associated with the extra
120 km of driving.
• Average daily vehicle traffic is forecast as 2,300 in 2022 and 2,980 in 2040 -- lower than the Base
Case volumes of 3,300 in 2022 and 3,870 in 2040.
Langdale Bridge Link
• This link would also replace Route 3. It would be used by trips between Metro Vancouver and
both the Sunshine Coast and Powell River.
• This route would be much shorter than the Langdale Road Link, but would involve a somewhat
greater driving time and distance than the Base Case. However, these additional costs are
forecast to be more than offset by the forecast travel times savings (especially when ferry wait
times are included), as well as the increased convenience of continuous access rather than being
tied to ferry schedules. Thus, volume of trips between North Vancouver and both the Sunshine
Coast and Powell River is forecast to increase relative to the Base Case;
• Average daily vehicle traffic is forecast as 5,700 in 2022 and 7,510 in 2040 -- higher than the
forecast Base Case volumes 3,300 in 2022 and 3,870 in 2040.
REPORT PREPARED FOR BC MINISTRY OF TRANSPORTATION AND INFRASTRUCTURE BY R.F. BINNIE & ASSOCIATES LTD., 2017 14TRAVEL DEMAND FORECASTS FIGURE 3-5: TRAFFIC VOLUME FORECASTS – LANGDALE ROAD AND BRIDGE LINK SCENARIOS REPORT PREPARED FOR BC MINISTRY OF TRANSPORTATION AND INFRASTRUCTURE BY R.F. BINNIE & ASSOCIATES LTD., 2017 15
TRAVEL DEMAND FORECASTS

FIGURE 3-6: TRAFFIC VOLUME FORECASTS – LANGDALE ROAD AND BRIDGE LINK SCENARIOS (ORIGINS/DESTINATIONS)

                                                            LangdaleOption
                                                                     Scenarios- Trip Origins (2-Way)
                                                                                          Option 4
                                             8,000                                                           7510 Total
                                                                                                                 310
                   Daily Traffic (Veh/day)   7,000
                                             6,000
                                                                 0              0
                                                                 0              0
                                             5,000
                                                          3870 Total                 2,980 Total
                                             4,000            230                                               7,200
                                             3,000                                      130
                                             2,000            3,640
                                                                                        2,850
                                             1,000
                                                0
                                                     Base Case - Rte 3 (2040)        Road (2040)             Bridge (2040)

                                                        Vancouver - Sunshine Coast        Vancouver - Powell River

3.3.3 Traffic Outlook – Powell River (PRRD) Scenarios
The traffic forecasts for the road and bridge links for the two Powell River fixed link scenarios are
presented in Figures 3-7 and 3-8, and are discussed as follows:

Powell River Road Link

     •    This link would be used for trips between PRRD and Squamish/Metro Vancouver, but would not
          provide a fixed link to SCRD.

     •     It would greatly reduce traffic levels on Route 7 and may lead to consideration of the feasibility
          of continuing to operate this route in its current form. The following traffic forecasts are based
          on the assumption that Route 7 continues to operate for local Sunshine Coast to Powell River
          traffic.

     •    Trips between Powell River and Metro Vancouver are forecast to increase because of the very
          significant travel time savings (approximately 1.2 hours) over the current two-ferry route. This
          time saving would more than outweighs the additional vehicle operating costs associated with
          the trip.

     •    For trips between Powell River and Metro Vancouver, average daily vehicle traffic on the new
          road link is forecast to be 310 in 2022 and 380 in 2040 -- higher than the forecast Base Case
          volumes of 200 in 2022 and 230 in 2040. Although the increase is approximately 50%, the
          relatively low absolute number of trips reflects the preliminary assumption that the new road is
          tolled at ferry-equivalent rates.

REPORT PREPARED FOR BC MINISTRY OF TRANSPORTATION AND INFRASTRUCTURE BY R.F. BINNIE & ASSOCIATES LTD., 2017                  16
TRAVEL DEMAND FORECASTS
Powell River Bridge Link
• This link would be used for trips between PRRD and SCRD/Metro Van, as a replacement for
Route 7. Through trips from PRRD to Metro Vancouver would continue to access Metro
Vancouver from SCRD via the Route 3 ferry.
• Trips to/from Powell River can be expected to increase substantially from the Base Case as a
result of increases in local trips between Powell River and Sunshine Coast communities and trips
between Metro Vancouver and Powell River (Figures 3-4 and 3-5). The total increase could be
expected to be from about 500 veh/day (2022) and 570 veh/day (2040) to about 980 veh/day
(2022) and 1,170 veh/day (2040) as a result of the time savings (0.9 hours) and cost savings
regardless of the longer travel distance (19 km.)
FIGURE 3-7: TRAFFIC VOLUME FORECASTS – POWELL RIVER ROAD AND BRIDGE LINK SCENARIOS
Powell River Scenarios: Daily 2-Way Traffic
Forecasts
1,400
Daily Traffic (Veh/day)
1,200
1,000
800
600
400
200
0
2010 2015 2020 2025 2030 2035 2040 2045
Year
Base Case - Route 7 Road Bridge
FIGURE 3-8: TRAFFIC VOLUME FORECASTS – POWELL RIVER ROAD AND BRIDGE LINK SCENARIOS (ORIGINS/DESTINATIONS)
Powell River Scenarios- Trip Origins
Option Option(2-Way)
4
1,400
1170 Total
1,200
Daily Traffic (Veh/day)
0 0
1,000 0 0
800 730
570 Total
600
380 Total
400 340
200 380 440
230
0
Base Case - Rte 7 (2040) PR Road (2040) PR Bridge (2040)
Vancouver - Powell River Sun. Coast - Powell River
REPORT PREPARED FOR BC MINISTRY OF TRANSPORTATION AND INFRASTRUCTURE BY R.F. BINNIE & ASSOCIATES LTD., 2017 17TRAVEL DEMAND FORECASTS
3.4 Traffic Forecast Summary
Traffic forecasts for each of the four fixed link scenarios as described above are summarized in Table 3-
3.
TABLE 3-3: TRAFFIC FORECAST SUMMARY (AVERAGE DAILY TRAFFIC, BOTH DIRECTIONS)
Location Traffic Volume (Veh/day)
2022 2040
Base Case
Route 3 Ferry Total 3,245 3,870
Route 7 Ferry Total 499 566
Langdale Road Link with Route 7 Ferry Only
Langdale Road Link Total 2,309 2,973
Route 7 Ferry Total 411 466
Langdale Bridge Link with Route 7 Ferry Only
Langdale Bridge Link Total 5,655 7,502
Route 7 Ferry Total 569 645
Powell River Road Link with Route 3 & 7 Ferry
Powell River Road Link Total 308 381
Route 3 Ferry Total 3,046 3,644
Route 7 Ferry Total 299 339
Powell River Bridge Link with Route 3 Ferry Only
Powell River Bridge Link Total 971 1,175
Route 3 Ferry Total 5,751 7,639
Traffic forecasts will vary depending on the assumptions regarding future ferry service levels and tariffs,
as well as the toll rates for each of the four fixed link scenarios. For the purposes of this analysis, the
Langdale road and bridge link traffic forecasts are based on the new link replacing Route 3; the Powell
River bridge link forecasts are based on the new bridge replacing Route 7; and the Powell River road link
is based on continuing Route 7 service concurrent with future demand. In addition, while no decision
has been made with respect to possible tolling, for the purposes of this study it is assumed that all of the
fixed-link options are tolled at ferry-equivalent rates.
REPORT PREPARED FOR BC MINISTRY OF TRANSPORTATION AND INFRASTRUCTURE BY R.F. BINNIE & ASSOCIATES LTD., 2017 18You can also read