Synthetic photoplethysmography (PPG) of the radial artery through parallelized Monte Carlo and its correlation to body mass index (BMI)
←
→
Page content transcription
If your browser does not render page correctly, please read the page content below
www.nature.com/scientificreports
OPEN Synthetic photoplethysmography
(PPG) of the radial artery
through parallelized Monte Carlo
and its correlation to body mass
index (BMI)
Tananant Boonya‑ananta1, Andres J. Rodriguez1, Ajmal Ajmal1, Vinh Nguyen Du Le1,
Anders K. Hansen2, Joshua D. Hutcheson1 & Jessica C. Ramella‑Roman1,3*
Cardiovascular disease is one of the leading causes of death in the United States and obesity
significantly increases the risk of cardiovascular disease. The measurement of blood pressure (BP)
is critical in monitoring and managing cardiovascular disease hence new wearable devices are
being developed to make BP more accessible to physicians and patients. Several wearables utilize
photoplethysmography from the wrist vasculature to derive BP assessment although many of
these devices are still at the experimental stage. With the ultimate goal of supporting instrument
development, we have developed a model of the photoplethysmographic waveform derived from
the radial artery at the volar surface of the wrist. To do so we have utilized the relation between
vessel biomechanics through Finite Element Method and Monte Carlo light transport model. The
model shows similar features to that seen in PPG waveform captured using an off the shelf device. We
observe the influence of body mass index on the PPG signal. A degradation the PPG signal of up to
40% in AC to DC signal ratio was thus observed.
Elevated blood pressure (BP) is considered one of the highest risk factors for cardiovascular disease. In fact, it
has been estimated that 47% of all coronary heart disease worldwide is attributable to high BP1. BP is less than
120/80 mmHg in normotensive individuals, between 120 and 129/80 mmHg in prehypertensive individuals,
between 130–139/80–89 mmHg in hypertensive stage 1, above 140/90 mmHg in hypertensive stage 2, and above
180/120 mmHg in h ypertensive2.
In adults, the risk of cardiovascular disease is significantly increased with obesity3–5, defined as having a body
mass index (BMI) of over 30 kg/m26–9. BMI is found to correlate strongly with increased 24 h blood pressure as
well as non-dipping nocturnal blood p ressure10,11. Physiological changes that occur in individuals with obesity
may increase the measurement uncertainties, and optical means for monitoring blood pressure will have to
account for obesity-related changes to the skin optical p roperties12 and increased subcutaneous tissue thickness.
There are several ways to evaluate BP. Sphygmomanometers and oscillometric devices are standard
techniques13, and the most common clinical method of measuring blood pressure is through auscultations using
a sphygmomanometer with the arm maintained at heart level14. Invasive arterial line blood pressure measure-
ment is often used in the Intensive Care Unit (ICU), where an arterial catheter is placed inside the radial artery
of a patient to directly measure vessel internal pressure15,16.
Research into cuff-less and continuous BP devices based on photoplethysmography (PPG) is rapidly expand-
ing. These systems provide unique diagnostic opportunities, such as monitoring of nocturnal hypertension10 a
condition strongly associated with cardiovascular events and organ damage. The PPG waveform can provide
information such as pulse wave velocity, the relative change in blood volume and pressure wave reflection17.
The systolic peak and diastolic peak are the primary and secondary features respectively as seen in Fig. 1. The
primary feature is directly representative of systolic performance during the cardiac cycle17,18. The vessel dilates
1
Department of Biomedical Engineering, Florida International University, 10555 W Flagler St, Miami, FL 33174,
USA. 2Department of Photonics Engineering, Technical University of Denmark, Frederiksborgvej 399,
4000 Roskilde, Denmark. 3Herbert Wertheim College of Medicine, Florida International University, 11200 SW 8th
St, Miami, FL 33199, USA. *email: jramella@fiu.edu
Scientific Reports | (2021) 11:2570 | https://doi.org/10.1038/s41598-021-82124-4 1
Vol.:(0123456789)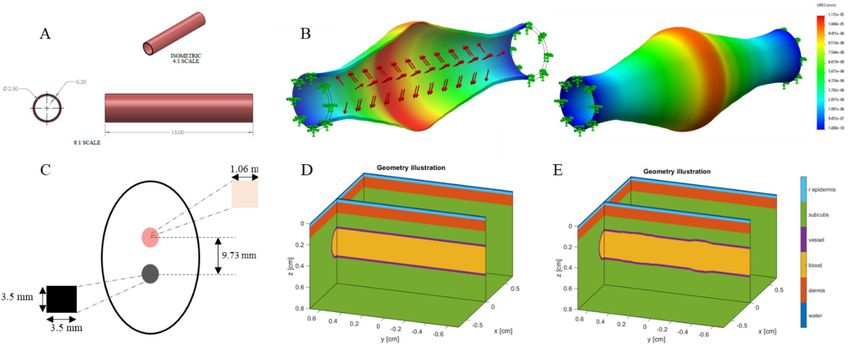
www.nature.com/scientificreports/
Figure 1. Typical PPG waveform with constitutive components. PPG wave components shows the systolic
upstroke to systolic peak, then systolic decline into the dicrotic notch and the diastolic peak.
due to the pressure wave generated by ventricular contraction. The pressure profile inside the arteries changes
as the pressure wave propagates downstream from the heart to peripheral vasculature19–21. This is due to vessel
compliance, vessel branch and bifurcations, and wave reflections encountered by the pulse during its journey
from the heart. The dicrotic notch moves further away from the systolic peak as arterial line measurement loca-
tion moves further down the arterial tree. Another mechanism which has been noted to influence PPG signals is
optical scattering caused by time-variant red blood cell (RBC) aggregation22,23. Shvartsman et al. show through
theoretical and experimental approaches that the pulsatile nature of the PPG signal can be described through
RBC aggregation22 using a PPG monitoring device. It is to be noted though that the RBC aggregation effect is
dominant in thin blood l ayers24 specifically microvasculature of the upper dermis. In our work, we have focused
on dynamics and biomechanical behavior of a large vessel, specifically the radial artery, deeper and larger in
physiology past thin blood layer contained in the dermis. The vessel under observation is 2.5 mm in diameter. In
vessels of this size, the vessel diameter is large compared to cell size and fluid can be approximated as a Newtonian
fluid25,26 and flow can be modeled as a homogenous fl uid27 flow.
Measurement of blood pressure at the radial artery located at the wrist is desirable since it is easily accessible,
and instrumentation can be developed for a wearable device. The blood pressure in the radial artery at the volar
surface of the wrist is more representative of blood pressure in the main arterial network as opposed to pressure
in superficial vasculature of the s kin28.
In order to derive a better understanding of devices based on PPG, several groups have conducted light propa-
gation models using Monte Carlo (MC) simulations29–31. Yet to our knowledge, these studies have not attempted
to capture the PPG waveform in its entirety and have focused on an idealized skin model.
The design of wearable devices must account for the population diversity, including physiological changes
due to obesity32–34 as well as skin tones.
Our study has two main goals. First, we develop a more realistic representation of light interaction with the
radial artery during a pulse as seen by a commercially available photoplethysmographer (Nellcor by Covidien).
This location and instrumentation are the focus of our experimental efforts toward developing low-cost cuffless
BP sensors. Second, we use our model to study the influence of increased BMI on the PPG waveform.
Recent studies have shown that obesity creates variations in skin p hysiology5,35–38. These changes include but
are not limited to skin barrier function, epidermal changes, dermal changes, and changes to the vascular and
capillary recruitment function. In our model, both skin tone and BMI diversity will be considered.
Material and methods
The behavior of arterial pulsatile flow can be modeled as a pulsatile flow through an elastic walled tubing19. The
key distinction between rigid versus elastic walled flow is the fluid streamline velocity profile (Fig. 2A,B). The
typical Poiseuille velocity profile for ideal, fully developed fluid flow in a rigid tube is constant along the length
of the tube (Fig. 2A), whereas in elastic-walled tubing, the velocity profile is dependent upon the location along
the streamline (Fig. 2B). In elastic tubes, pressure waves cause a local change in fluid pressure that is then propa-
gated downstream. Wall compliance results in oscillation of the wall and changes to tube diameter with induced
pulsatile flow, as seen in the vascular system.
The mechanics of large vessels such as the aorta, carotid artery, and large coronary arteries has been studied
extensively39–44 but several authors have noted that smaller peripheral vessels, such as the one under study here,
exhibit similar mechanical behaviors to larger ones45,46.
Considering the biomechanical changes in the arterial vascular bed, our model of PPG is divided in two parts.
First, a finite element model is used to observe the dilation of the radial artery under applied pressure. Then, a
Monte Carlo model is applied to this dynamic geometry to observe loss of optical signal in relation to the pulse.
Vessel geometry. We have used Finite Element Analysis (FEA) to model the mechanical behavior of an
arterial vessel. Our model allows us to visualize the motion of an arterial wall under an applied internal pressure.
The artery is modeled in Solidworks computer-aided design (CAD) software.
We have chosen the volar surface of the distal forearm as the location of our virtual PPG instrument. This
choice is governed by our interest in the development of wrist-based wearable devices targeting that vessel.
A drawing of the vessel with associated dimensions is shown in Fig. 3A. The radial artery has been reported
to have 2.5 mm inner diameter and 0.2 wall t hickness46–48. Vessel wall mass density and Poisson’s ratio were set
Scientific Reports | (2021) 11:2570 | https://doi.org/10.1038/s41598-021-82124-4 2
Vol:.(1234567890)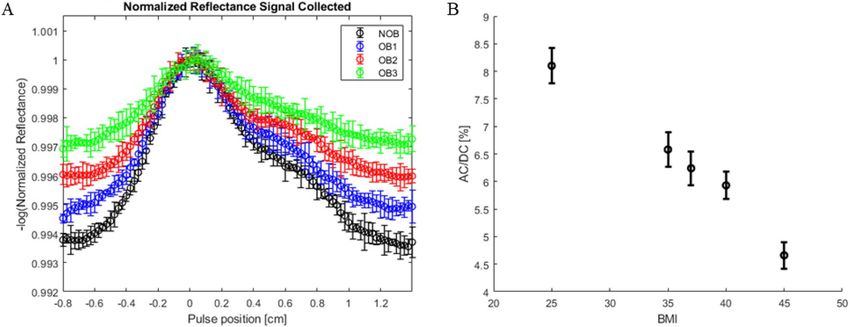
www.nature.com/scientificreports/
Figure 2. Fluid flow in rigid and elastic tubing (adapted19). (A) The top diagram shows fully developed velocity
profile for flow in a rigid walled tube. (B) Second diagram shows flow in an elastic walled tube.
Figure 3. Vessel 2D CAD geometry drawing. This is the model used for the radial artery to understand its
behavior during the cardiac cycle. All dimensions in (mm). (B) Arterial wall dilation contour plot of total
displacement. Red regions show regions of highest displacement and blue for lowest displacement. Note
depicted displacement scale is exaggerated. (C) Patch sensor schematic for adaptation to Monte Carlo. (D) Base
geometric configuration for Monte Carlo Model. The various layers represented by a specific color developed
in the Monte Carlo geometry. (E) Illustration of pulse shape generating features in Monte Carlo. Geometric
parameters of arterial dilation and pressure wave propagation is adapted into Monte Carlo through variation in
geometry of the artery. Pulse features are developed through Eqs. (2–4).
Material property Artery wall
Young’s modulus (kPa) 700
Poisson’s ratio 0.49
Mass density (kg/m3) 1160
Mesh elements 52,610
Table 1. Arterial Wall material properties.
to 1160 kg/m3 and 0.4944,46,49 respectively. A radial artery wall Young’s modulus of 0.70 MPa was u sed46. Arte-
46
rial mechanical stiffness ranges between 0.70 and 1.10MPa . Mechanical properties are highlighted in Table 1.
Radial artery pressure has been shown to be 5 to 15 mmHg50 higher than the brachial artery, where blood
pressure is often measured using the sphygmomanometer. An internal pressure of 130 mmHg50 was imposed to
the vessel representing the radial artery. The result of the FEM model at peak applied force is shown in Fig. 3B.
Scientific Reports | (2021) 11:2570 | https://doi.org/10.1038/s41598-021-82124-4 3
Vol.:(0123456789)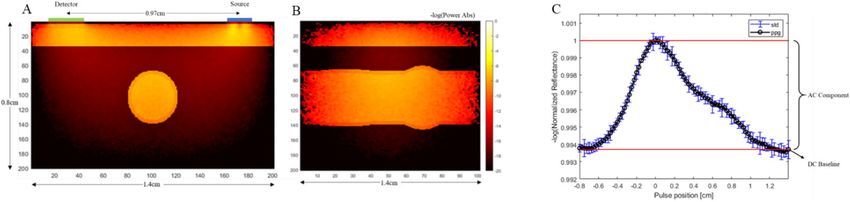
www.nature.com/scientificreports/
The figure shows a time snapshot of the vessel shape as a time-dependent pressure pulse propagates from the
heart to the radial artery. This is different from a quasi-static pressure vessel representation often used to analyze
vascular wall mechanics.
The arterial wall is often treated as incompressible44,51, pressure changes applied internally translates to vessel
wall dilation, but the total wall volume is conserved. This incompressibility estimation is seen in the FEM model.
Changes to the inner wall and outer wall radii are relatively small in comparison to total vessel dilation. Vessel
walls have been reported to experience 10–20% diametral s train52,53. Applying 0.70 MPa stiffness, vessel wall
shows total dilation of 0.4 mm in diameter. The mechanical behavior of the artery during pulse propagation is
integrated into the light transport model (Monte Carlo) through changes in the vessel geometry.
Through observation of the dilated shape of the finite element model, a set of equations is created to represent
this shape in the Monte Carlo framework. This shape function is defined as an ellipsoid in three-dimensional
space. The basic ellipsoid equation is shown in Eq. (1).
x
2 y
2 z
2
+ + = 12 (1)
a b c
where a, b, and c represent the radii of each respective axis of the ellipsoid in the x, y, and z direction, respectively.
The dilation of the vessel under pressure is directly applied to the radii of the ellipsoid in the x and z directions.
Whereas the y direction axis controls the elongation of the wave along the length of the artery. Note that the
pulse wave propagates in the y direction.
The development of the mathematical ellipsoid envelope of the FEA derived pulse geometry using a double
ellipsoid shown in Eqs. (2–4).
2
2
y + pL1 2
x z−d
IDx
+ IDx
+ = 12 (2)
2 2
pwd1
2
2
2
x z−d y + pL2
IDxd
+ IDxd
+ = 12 (3)
2 2
pwd2
psep = pL1 − pL2 (4)
In Eqs. (2) and (3), x, y, and z represent each direction in the frame, d locates the ellipsoid in the vertical, z,
direction in the media. In Eq. (2), IDx defines the dilation of the inner diameter of the vessel, pL1 is the location
of the primary ellipsoid in the y-axis, and pwd1 defines the width of the primary ellipsoid in the y direction.
In Eq. (3), IDxd represents the dilation of the inner diameter of the secondary ellipsoid, pL2 is the location of
the secondary ellipsoid in the y-axis, and pwd2 defines the width of the secondary ellipsoid in the y direction.
Equation (4) defines the psep parameter as the separation between the first and second ellipsoids. The geometry
developed with these equations is shown in Fig. 3E.
Monte Carlo model. Aside from the radial artery, the Monte Carlo simulation also considered three skin
layers: epidermis, dermis and subcutaneous tissue with the radial artery inserted into the adipose tissue layer.
The Monte Carlo model used in this work is an adaptation of MCMatlab developed by Marti et al.29. MCMatlab
converts S. Jacques’ “mcxyz.c”30 from C-based code to a compact tool usable through Matlab interface. Monte
Carlo framework simulates a 3-layer model to include epidermis, dermis and subcutaneous tissue with the radial
artery inserted into the adipose tissue layer. The epidermis consists of multiple sublayers with various compo-
nents, including melanin and m elanocytes54. The dermis is comprised of connective tissue along with blood ves-
sels (capillaries and arterioles) with blood volume ratios ranging from 0.2 to 7% and water volume concentration
around 65%55,56. The subcutis consists of subcutaneous adipose tissue and other connective t issue57.
In this work, we modeled a commercial PPG (Nellcor Covidien, this device also provide pulse oximetry). This
is a clinical system that incorporates two wavelength sources at 660 nm peak 22 nm FWHM and 890 nm peak
54 nm FWHM. The sensor provides and effective beam waist radius of 0.06 cm. The detector is located 0.97 cm
away from the sources providing reflectance PPG signal. Light collector area is measured to be 0.35 cm × 0.35 cm
which is an effective collector area of 0.1225 cm2 with numerical aperture of 0.866. The sensor schematic is
shown in Fig. 3C.
The geometry of our Monte Carlo simulation is shown in Fig. 3D. The first layer mimics the epidermis. The
thickness of human epidermis is approximately 0.10 mm58,59. To avoid using a very small voxel size in the simula-
tion, we chose to scale the optical properties of the epidermis to match its optical t hickness60.
The dermis layer was 1.0 mm in thickness. Below the dermis, a subcutaneous adipose tissue layer was added.
Within this layer, the radial artery is modeled as a cylinder situated at 2.5 mm depth from the top surface47,48.
The target radial artery is constructed with a vessel wall and the internal lumen is filled with blood. Optical
properties used in Monte Carlo simulations are extracted from previous work31,55,61–65. Simulation parameters
are highlighted in Table 2.
Monte Carlo geometry frames a 1.4 × 1.4 × 0.8 cm3 volume with 200 × 100 × 100 elements in each direction.
Monte Carlo simulations were performed on Windows 10 64-bit Operating System with Intel Core i7-8700 CPU
3.20 GHz, NVIDIA GeForce GTX 1070 GPU, and 32 GB RAM, and Windows 10 64-bit Operating System with
Intel Core i7-8750H CPU 2.20 GHz, NVIDIA GeForce GTX 1050 Ti GPU, and 16 GB RAM. Simulations speeds
Scientific Reports | (2021) 11:2570 | https://doi.org/10.1038/s41598-021-82124-4 4
Vol:.(1234567890)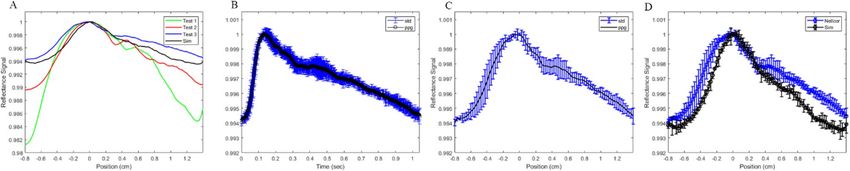
www.nature.com/scientificreports/
µa (cm−1) µs (cm−1)
Layer 660 nm/890 nm 660 nm/890 nm g n
rEpidermis 0.3442/0.3184 121.2/224.7 0.7 1.47
Dermis 0.5453/2459 208.6/116.7 0.7 1.47
Subcutis 0.0001/0.0217 249.7/189.8 0.7 1.47
Vessel Wall 0.8/0.8 230/230 0.9 1.4
Blood 2.026/6.32 75.76/56.18 0.9 1.4
Table 2. Optical properties at two corresponding wavelengths.
Trans-epidermal water Dermal blood content Radial artery depth
Body mass index (kg/m2) loss (%) change (%) Dermal thickness (cm) (cm)
25 0 0 1.0 2.5
30 30 10 1.325 2.75
35 40 20 1.75 3.0
40 50 30 2.125 3.25
45 60 40 2.5 3.5
Table 3. Skin changes simulation parameters attributed with increasing body mass index and obesity.
varied between two million photons per minute to 70 million photons per minute. Waveform simulations are
conducted at 89 incremented pulse positions at 100 million to one billion photons each.
Analyses of the performance of commercial systems and functionality of arterial PPG must account for
factors of skin tone and physiological changes with the development of o besity32–34. The melanin content of the
skin increases with darkening skin tone. Melanin volume fraction variation can be used to model the various
pigmentation levels. Lightly pigmented skin adults have a melanin volume fraction of 1.3–6.3%, moderately pig-
mented skin adults have a 11–16% melanin volume fraction, and darkly pigmented skin adults have an 18–43%
melanin volume fraction in the e pidermis55.
Individuals with obesity experience changes to skin anatomy/physiology and thus optical properties. Previous
authors have reported relationships between BMI and chromophore concentration in the skin as well as adipose
tissue. For example, Spilenlli37 et al. studies the optical properties of breast tissue and discovered a positive cor-
relation between BMI and lipid and total hemoglobin, and a negative correlation between BMI and water content.
When studying the optical properties of adipose tissue, L anka38 et al. results show that obese have lesser values
for absorption and reduced scattering coefficients.
Dermal thickness variations with BMI is shown to range from 1.0 mm to over 2.5 mm thickness58. Along
with changes to the skin, the artery itself is situated deeper in the subcutaneous adipose tissue as adipose tissue
layer thickness with increasing level of obesity. The signal from the radial artery is discovered to vary in depth
with different levels of obesity from 2.5 mm for non-obese individuals at BMI of 25 to 3.5 mm for BMI of 4 547,48.
Trans-epidermal water loss (TEWL) the process where water evaporates through the epidermis from the dermis
is disruption in the o bese36. As BMI increases so does T WEL66, and this effect directly contributed to dry skin
and skin irritation often seen in the obese population. The significant changes to the skin which we have high-
lighted include changes to dermal water c ontent66 and blood content content66 as well as dermal thickness and
increased radial artery depth all with increasing levels of obesity47,48,58. A summary of all the parameters utilized
in the modeling is shown in Table 3.
Changes in Table 3 are applied to the MC geometry through two different methods. The changes to TWEL
and dermal blood contented are applied to the media layer properties. TWEL changes the amount of water in
the dermal layer. The water loss percentage is multiplied to standard dermal water content. Similarly, dermal
blood content percentage changes are multiplied to blood content in the dermis. For geometric changes of dermal
thickness and artery depth, these properties are changed directly in the geometry construction.
Testing on healthy individuals. Experimental PPG signals were gathered from four healthy volunteers
utilizing the commercial PPG system described above. The protocol for the study was approved by the Institu-
tional Review Board of Florida International University and followed the tenets of the Declaration of Helsinki.
Written informed consent was obtained from the subjects after explanation of the nature and possible conse-
quences of the study. The radial artery was located by tactile exploration so that the PPG sensor could be located
as in the geometry described in Fig. 3. After stabilizing the sensor acquisition was initiated. About thirty seconds
of PPG data was collected. A representative pulse was then used in the analysis.
Results
A power absorption map of our geometry is shown in Fig. 4A,B. This is a single slice in the three-dimensional
geometry at a single location of the pulse waves.
Scientific Reports | (2021) 11:2570 | https://doi.org/10.1038/s41598-021-82124-4 5
Vol.:(0123456789)www.nature.com/scientificreports/
Figure 4. Monte Carlo slices of the negative logarithm of power absorbed color map of radial artery
configuration at single pulse location at 660 nm wavelength. (A) and (B) shows the front view and side view,
respectively. (C) PPG Curve generated for non-obese case. PPG signal is developed through normalized
reflectance signal collected at each pulse position.
Figure 5. PPG data of radial artery taken at the volar location of the wrist of three different preliminary tests,
each test is from a different individual. Note x-axis label is in time whereas simulation data pulse is developed
through pulse position. (B) Experimental data of Test 3. (C) PPG adjusted for from time to pulse position. (D)
Overlay of experimental PPG and simulated waveform.
Figure 4C shows an example of PPG waveform generated for the non-obese case. The returned signal is
comprised of an AC and a DC baseline signal, where the AC signal represents the pulsatility of the vasculature.
A comparison of the AC to DC signal ratio of each waveform shows the degradation of the signal with increas-
ing BMI. Different PPG signals are generated through varying four different physiological changes observed
with obesity. These changes can be seen in Table 3. Preliminary experimental data using the PPG sensor (Fig. 5)
shows features similar to that seen in simulation curve. The PPG of three different individuals was captured
experimentally (Fig. 5A). There is significant variation between individuals (Fig. 5A green, red, blue), however
the features of the shape can be identified in all three cases. The PPG data is adjusted from pulse shape in time
to PPG with respect to pulse position (Fig. 5B,C). This is done by matching the start and end point of the two
sets as well as the primary peak and overlay on top of each other (Fig. 5D).
Figure 6 shows changes AC/DC signal from four different changes attributed to obesity across different
BMI levels. Figure 6A shows a 14.0% total signal decline associated with changes to trans-epidermal water loss
between normal to highest BMI level. Figure 6B shows an 18.0% change with dermal blood content. Figure 6C
shows total percentage change between smallest and largest dermal thickness is 41.4%. In Fig. 6D, percentage
change between shallowest and deepest arterial depth is 32.1%. Similar trends of signal degradation are seen
across the four different changes which occur with obesity: trans-epidermal water loss, blood perfusion, dermal
thickness, and radial artery depth. Each scenario shows changes isolated to each feature of obesity. Figure 7
highlights changes seen at four different skin tones classified by epidermal melanin concentration. Total AC
to DC signal ratio change is seen at 17.1% between 3% epidermal melanin concentration and 42% epidermal
melanin concentration.
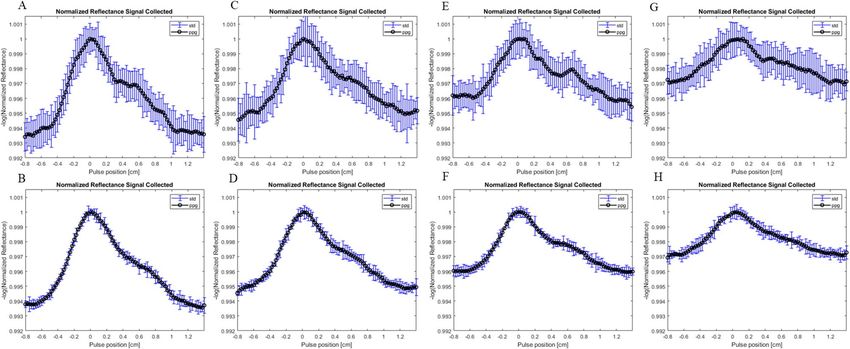
Waveforms for different levels of obesity are generated through varying the combined dermal thickness and
arterial depth to indicate corresponding physiological changes. Figure 8 shows generated waveforms at non-
obese (8A–B), obese 1 (8C–D), obese 2 (8E–F) and obese 3 (8G–H) at two different photon counts. Changes
to BMI and obesity level is presented through the increase of dermal thickness from 1.0 to 2.5 mm and arterial
depth from 2.5 to 4.5 mm. A comparison of the waveform shows the degradation of the baseline signal as well as
changes to the wave shape itself. Across each level of obesity, at both 100 million and one billion photon counts,
there is a significant diminishing of the amplitude of the signal. Figure 9A shows the four different signals super-
imposed on top of each other on the same curve. The AC to DC signal ratio is shown in Fig. 9B. Baseline signal
change between each obesity level and non-obese is shown in Table 4. The baseline change ranges from 12.7 to
54.5%. Similar changes are seen in both the 100 million photons set as well as the one billion photons set as to
be expected. The advantage of using lower number of photons is the computational time for each simulation in
exchange for a higher standard deviation at each point.
Scientific Reports | (2021) 11:2570 | https://doi.org/10.1038/s41598-021-82124-4 6
Vol:.(1234567890)www.nature.com/scientificreports/
Figure 6. AD/DC PPG signal ratio for changes to trans-epidermal water loss (A), dermal blood content (B),
dermal thickness (C), and radial artery depth (D) with BMI.
Figure 7. PPG AC/DC ratio change with melanin concentration change in epidermal layer for non-obese case.
The non-obese BMI of 25 kg/m2, the AC/DC signal ratio is 8.1% and at the maximum level calculated the
ratio is 4.66%. This accumulates to the total percentage change of 43% between the Non-Obese waveform and
Obese 3 waveform.
The degradation of the return signal gives an indication to the decrease in quality of the signal that will be
received by the PPG device. A loss in signal quality is shown to increase as BMI and obesity level increase with
changes in dermal thickness and arterial depth. PPG devices designed to periodically or continuously probe
arterial blood pressure as a wearable device at the wrist must be designed to be mindful of the significant effects
of obesity on optical performance. The advantage of the development of synthetic waveform is understanding
these changes and the significance of their impact.
Scientific Reports | (2021) 11:2570 | https://doi.org/10.1038/s41598-021-82124-4 7
Vol.:(0123456789)www.nature.com/scientificreports/
Figure 8. Variously generated waveforms at 660 nm for different photon counts and different geometry
representative of BMI change. (A) Non-obese waveform generated at 100 million photons and 15 trials. (B)
Non-obese waveform generated at 1 billion photons and 5 trials. (C) Obese 1 waveform at 100 million photons
and (D) 1 billion photons. (E) Obese 2 waveform at 100 million photons and (F) 1 billion photons. (H) Obese 3
waveform at 100 million photons and (G) 1 billion photons.
Figure 9. (A) Superposition of four different waveforms at 1 billion photons. Black: Non-Obese. Blue: Obese 1.
Red: Obese 2. Green: Obese 3. (B) AC/DC ratio for each waveform signal comparison.
Waveform Photons (millions) Baseline change (%)
100 13.0
Obese 1
1000 12.7
100 42.4
Obese 2
1000 36.5
100 54.5
Obese 3
1000 52.4
Table 4. Waveform baseline signal changes at different levels of obesity.
Discussion
We have demonstrated an approach to modeling PPG signals utilizing a combination of FEM and Monte Carlo
modeling. Ultimately, our intent is to develop a wearable health device capable of assessing continuous cuff-
less blood pressure with comparable level of performance across populations of varying body size. Cuff-less,
continuous blood pressure monitoring can provide critical information concerning nocturnal cardiovascular
Scientific Reports | (2021) 11:2570 | https://doi.org/10.1038/s41598-021-82124-4 8
Vol:.(1234567890)www.nature.com/scientificreports/
function, which is a significant indicator of overall cardiac health. This work focuses on a commercial PPG sen-
sor measurement of pulsatile flow in the radial artery.
Our simulations demonstrate that with no changes to the underlying vessel mechanical behavior, an increase
in BMI significantly impacts the PPG waveform. The AC/DC ratio changes from 14 to 41% as BMI increases from
20 to 40 for isolated changes attributed with increasing level of obesity and BMI. Increase to dermal thickness
increases the total volume of absorbers and scatterers through which photons must traverse to reach the artery
and return to the detector. Increased radial artery depth also increases the total travel distance for photons to
reach the vessel wall as and return to detector.
Vessel expansion and contraction, under pressure changes of the cardiac cycle, is directly associated with the
pulsatility of the PPG waveform67, the presence of obesity degrades the quality of the signal even when the ves-
sel mechanics remain unchanged. Synthetic waveform generation provides an insight and prediction of optical
device functionality.
Computational work from our group has shown that increasing melanin concentration in the epidermal layer
yields a decrease in overall signal quality of up to 17%. This effect has been documented by other investigators68
and it may account for some of the errors experienced by dark skin individuals utilizing wearable based on
PPG68–71. Here we propose a computational framework that could be used to design and develop better wearable
that account for population diversity.
The changes associated to BMI are applied to evaluate their isolated effect on the captured PPG signal to
compared differences across different BMI ranges according to each physiological effect. It is, however, clear
that the development of obesity has other significant changes to total physiological changes to the body. We have
chosen to isolate and characterize the impact of changers to the skin to observe changes to the PPG signal which
are not attributed to vascular dynamic behavior.
Future work will focus on the understanding of waveform morphology through connecting various cardio-
vascular conditions with the corresponding PPG. The addition of synthetic waveform generation can allow for
the study of isolated effects from a variety of factors on the output PPG. Post-processing of the PPG such as first
and second derivative and frequency domain information can be used as tools for feature extraction for desired
information.
Future developments of the model will approach the correlation of vascular physiological parameters to the
shaping equations to help understand the relationship between the biomechanics and PPG output signal. The
Finite Element Model is based on vascular mechanical stiffness and applied stress to observe vessel dilation. We
propose that through the development of a robust method of analysis of a PPG signal, the relationship between
optical signal and internal vessel blood pressure could be derived. Various methods of waveform analysis through
neural networks have been used to attempt to derive blood pressure values from experimental PPG data sets.
Unfortunately, the variability in individual anatomy and physiology makes this correlation very complex. Our
synthetic framework offers a controlled approach to this very complex problem.
This work is limited to the detection of the radial artery and does not consider the pulsatile effect of the super-
ficial arterioles, this will be the focus of future addition to the present model. The model geometry is limited to
the primary layers of the skin and an embedded dynamic blood vessel, however underlying structures around
the radial artery such as the muscle or radial styloid process has not been included. The addition of these features
will be explored in future model to evaluate their effects on generated signal.
Conclusion
We have created a model to describe photoplethysmographic waveform and vascular behavior of the radial artery
within a light propagation model (Monte Carlo). This was accomplished using Finite Element Modeling to view
mechanical changes in the radial artery during a single pulse propagation cycle and translating the vessel dilation
into a set of equation that could be adapted to a voxel-based Monte Carlo model. This modeling framework is
necessary and useful when developing wearable devices for non-invasive continuous blood pressure monitoring
systems. Specifically, our interest lies in the development of low-cost devices individuals experiencing obesity.
We have focused our study on the changes to the PPG waveform for a single pulse cycle due to changes in physi-
ology and optical properties of the skin in relation to BMI. Modeled AC to DC PPG signal ratio suggests that
physiological changes due to BMI lower the ratio up to 40% this loss of signal amplitude could explain some of
the errors observed by obese population.
Received: 30 July 2020; Accepted: 14 January 2021
References
1. Wu, C.-Y. et al. High blood pressure and all-cause and cardiovascular disease mortalities in community-dwelling older adults.
Medicine 94, e2160 (2015).
2. Association, A. H. Understanding blood pressure readings. Updated November 17 (2014).
3. Heron, M. P. Deaths: leading causes for 2017 (2019).
4. Santulli, G. Epidemiology of cardiovascular disease in the 21st century: updated numbers and updated facts. J. Cardiovasc. Dis. 1,
1–2 (2013).
5. Ndumele, C. E. et al. Obesity and subtypes of incident cardiovascular disease. J. Am. Heart Assoc. 5, e003921 (2016).
6. Garrow, J. S. & Webster, J. Quetelet’s index (W/H2) as a measure of fatness. Int. J. Obes. 9, 147–153 (1985).
7. Freedman, D. S., Horlick, M. & Berenson, G. S. A comparison of the Slaughter skinfold-thickness equations and BMI in predicting
body fatness and cardiovascular disease risk factor levels in children. Am. J. Clin. Nutr. 98, 1417–1424 (2013).
8. Flegal, K. M. & Graubard, B. I. Estimates of excess deaths associated with body mass index and other anthropometric variables.
Am. J. Clin. Nutr. 89, 1213–1219 (2009).
Scientific Reports | (2021) 11:2570 | https://doi.org/10.1038/s41598-021-82124-4 9
Vol.:(0123456789)www.nature.com/scientificreports/
9. Willett, K., Jiang, R., Lenart, E., Spiegelman, D. & Willett, W. Comparison of bioelectrical impedance and BMI in predicting
obesity-related medical conditions. Obesity 14, 480–490 (2006).
10. Kario, K. Nocturnal hypertension: new technology and evidence. Hypertension 71, 997–1009 (2018).
11. Kotsis, V. et al. Impact of obesity on 24-hour ambulatory blood pressure and hypertension. Hypertension 45, 602–607 (2005).
12. Yosipovitch, G., DeVore, A. & Dawn, A. Obesity and the skin: skin physiology and skin manifestations of obesity. J. Am. Acad.
Dermatol. 56, 901–916 (2007).
13. James, G. D. Blood pressure response to the daily stressors of urban environments: methodology, basic concepts, and significance.
Am. J. Phys. Anthropol. 34, 189–210 (1991).
14. Ogihara, T. Japanese Society of Hypertension Committee. The Japanese Society of hypertension guidelines for the management
of hypertension. Chapter 2. Measurement and clinical evaluation of blood pressure. Hypertens. Res. 32, 11–23 (2009).
15. Li-wei, H. L., Saeed, M., Talmor, D., Mark, R. & Malhotra, A. Methods of blood pressure measurement in the ICU. Crit. Care Med.
41, 34 (2013).
16. Pytte, M., Dybwik, K., Sexton, J., Straume, B. & Nielsen, E. W. Oscillometric brachial mean artery pressures are higher than intra-
radial mean artery pressures in intensive care unit patients receiving norepinephrine. Acta Anaesthesiol. Scand. 50, 718–721 (2006).
17. Liang, Y., Chen, Z., Ward, R. & Elgendi, M. Hypertension assessment using photoplethysmography: a risk stratification approach.
J. Clin. Med. 8, 12 (2019).
18. Kaplan, J. A. Kaplan’s Essentials of Cardiac Anesthesia E-Book (Elsevier Health Sciences, Amsterdam, 2017).
19. Zamir, M. & Budwig, R. Physics of pulsatile flow. Appl. Mech. Rev. 55, B35–B35 (2002).
20. Murgo, J. P., Westerhof, N., Giolma, J. P. & Altobelli, S. A. Aortic input impedance in normal man: relationship to pressure wave
forms. Circulation 62, 105–116 (1980).
21. WV, N. O’Rourke McDonalds Blood Flow in arteries: Theoretical, Experimental and Clinical Principles (Arnold, London, 1998).
22. Shvartsman L. D. & Tverskoy, B. In Dynamics and Fluctuations in Biomedical Photonics XII. 93220A (International Society for
Optics and Photonics).
23. Shvartsman, L. D. & Fine, I. Optical transmission of blood: effect of erythrocyte aggregation. IEEE Trans. Biomed. Eng. 50,
1026–1033 (2003).
24. Reinhart, W. H., Piety, N. Z. & Shevkoplyas, S. S. Influence of red blood cell aggregation on perfusion of an artificial microvascular
network. Microcirculation 24, e12317 (2017).
25. Noutchie, S. C. O., Maritz, D. & Gutto, S. Flow of a Newtonian Fluid: The Case of Blood in Large Arteries. Master of Science,
University of South Africa (2005).
26. Bessonov, N., Sequeira, A., Simakov, S., Vassilevskii, Y. & Volpert, V. Methods of blood flow modelling. Math. Model. Nat. Phe-
nomena 11, 1–25 (2016).
27. Zhang, J., Johnson, P. C. & Popel, A. S. Red blood cell aggregation and dissociation in shear flows simulated by lattice Boltzmann
method. J. Biomech. 41, 47–55 (2008).
28. 28Chaudhry, R. & Rehman, A. in StatPearls [Internet] (StatPearls Publishing, 2020).
29. Marti, D., Aasbjerg, R. N., Andersen, P. E. & Hansen, A. K. MCmatlab: an open-source, user-friendly, MATLAB-integrated three-
dimensional Monte Carlo light transport solver with heat diffusion and tissue damage. J. Biomed. Opt. 23, 121622 (2018).
30. Jacques, S. & Li, T. Monte Carlo Simulations of Light Transport in 3D Heterogenous Tissues (mcxyz. c). See http://omlc.org/softw
are/mc/mcxyz/index.html. Accessed 30.01. 2017 (2013).
31. Chatterjee, S. & Kyriacou, P. A. Monte Carlo analysis of optical interactions in reflectance and transmittance finger photoplethys-
mography. Sensors 19, 789 (2019).
32. Hailu, R. Fitbits and other wearables may not accurately track heart rates in people of color. STAT News (2019).
33. Jacques, S. L. Quick analysis of optical spectra to quantify epidermal melanin and papillary dermal blood content of skin. J. Bio-
photonics 8, 309–316 (2015).
34. Jacques, S. Oregon medical laser center (1998).
35. Mori, S. et al. Characterization of skin function associated with obesity and specific correlation to local/systemic parameters in
American women. Lipids Health Dis. 16, 214 (2017).
36. Hirt, P. A., Castillo, D. E., Yosipovitch, G. & Keri, J. E. Skin changes in the obese patient. J. Am. Acad. Dermatol. 81, 1037–1057
(2019).
37. Spinelli, L. et al. Bulk optical properties and tissue components in the female breast from multiwavelength time-resolved optical
mammography. J. Biomed. Opt. 9, 1137–1143 (2004).
38. Lanka, P. et al. Non-invasive investigation of adipose tissue by time domain diffuse optical spectroscopy. Biomed. Opt. Exp. 11,
2779–2793 (2020).
39. Lam Po Tang, E. J. et al. Non-contact quantification of jugular venous pulse waveforms from skin displacements. Sci. Rep. 8, 17236.
https://doi.org/10.1038/s41598-018-35483-4 (2018).
40. Moxham, I. M. Understanding arterial pressure waveforms. Southern Afr. J. Anaesth. Analg. 9, 40–42. https: //doi.org/10.1080/22201
173.2003.10872991 (2014).
41. Denardo, S. J., Nandyala, R., Freeman, G. L., Pierce, G. L. & Nichols, W. W. Pulse wave analysis of the aortic pressure waveform in
severe left ventricular systolic dysfunction. Circ. Heart Fail. 3, 149–156. https: //doi.org/10.1161/CIRCHE ARTFA ILURE .109.86238
3 (2010).
42. Xiao, H., Tan, I., Butlin, M., Li, D. & Avolio, A. P. Arterial viscoelasticity: role in the dependency of pulse wave velocity on heart
rate in conduit arteries. Am. J. Physiol. Heart Circ. Physiol. 312, H1185–H1194. https: //doi.org/10.1152/ajphea rt.00849. 2016 (2017).
43. Truijers, M. et al. Wall stress analysis in small asymptomatic, symptomatic and ruptured abdominal aortic aneurysms. Eur. J. Vasc.
Endovasc. Surg. 33, 401–407. https://doi.org/10.1016/j.ejvs.2006.10.009 (2007).
44. Peterson, L. H., Jensen, R. E. & Parnell, J. Mechanical properties of arteries in vivo. Circ. Res. 8, 622–639 (1960).
45. Monson, K. L., Goldsmith, W., Barbaro, N. M. & Manley, G. T. Significance of source and size in the mechanical response of human
cerebral blood vessels. J. Biomech. 38, 737–744 (2005).
46. Khamdaeng, T., Luo, J., Vappou, J., Terdtoon, P. & Konofagou, E. E. Arterial stiffness identification of the human carotid artery
using the stress-strain relationship in vivo. Ultrasonics 52, 402–411. https://doi.org/10.1016/j.ultras.2011.09.006 (2012).
47. Kim, J. U., Lee, Y. J., Lee, J. & Kim, J. Y. Differences in the properties of the radial artery between Cun, Guan, Chi, and nearby
segments using ultrasonographic imaging: a pilot study on arterial depth, diameter, and blood flow. Evidence Based Complement.
Altern. Med. 2015 (2015).
48. Lee, B. J., Jeon, Y. J. & Kim, J. Y. Association of obesity with anatomical and physical indices related to the radial artery in Korean
adults. Eur. J. Integr. Med. 14, 22–27 (2017).
49. Van de Vosse, F. & Van Dongen, M. Cardiovascular Fluid Mechanics—Lecture Notes (Faculty of Applied Physics, Faculty of Mechani-
cal Engineering, Eindhoven University of Technology, Eindhoven, 1998).
50. Armstrong, M. K. et al. Brachial and radial systolic blood pressure are not the same: evidence to support the popeye phenomenon.
Hypertension 73, 1036–1041 (2019).
51. Holzapfel, G. A. & Ogden, R. W. Constitutive modelling of arteries. Proc. R. Soc. A Math. Phys. Eng. Sci. 466, 1551–1597. https://
doi.org/10.1098/rspa.2010.0058 (2010).
52. Taylor, C. A., Hughes, T. J. & Zarins, C. K. Finite element modeling of blood flow in arteries. Comput. Methods Appl. Mech. Eng.
158, 155–196 (1998).
Scientific Reports | (2021) 11:2570 | https://doi.org/10.1038/s41598-021-82124-4 10
Vol:.(1234567890)www.nature.com/scientificreports/
53. Choudhari, P. & Panse, M. Finite element modeling and simulation of arteries in the human arm to study the aortic pulse wave
propagation. Procedia Comput. Sci. 93, 721–727 (2016).
54. Thody, A. J. et al. Pheomelanin as well as eumelanin is present in human epidermis. J. Investig. Dermatol. 97, 340–344 (1991).
55. Jacques, S. L. Origins of tissue optical properties in the UVA, visible, and NIR regions. OSA TOPS Adv. Opt. Imaging Photon Migr.
2, 364–369 (1996).
56. Otto, J. M. et al. Hemoglobin concentration, total hemoglobin mass and plasma volume in patients: implications for anemia.
Haematologica 102, 1477–1485 (2017).
57. Anderson, R. R. & Parrish, J. A. The optics of human skin. J. Investig. Dermatol. 77, 13–19 (1981).
58. Derraik, J. G. et al. Effects of age, gender, BMI, and anatomical site on skin thickness in children and adults with diabetes. PLoS
ONE 9, e86637 (2014).
59. Oltulu, P., Ince, B., Kökbudak, N. & Kılıç, F. Measurement of epidermis, dermis, and total skin thicknesses from six different body
regions with a new ethical histometric technique. Türk Plast. Rekonstrüktif Estetik Cerrahi Dergisi (Turk J Plast Surg) 26, 56–61
(2018).
60. Saager, R. B., Truong, A., Durkin, A. J. & Cuccia, D. J. Method for depth-resolved quantitation of optical properties in layered
media using spatially modulated quantitative spectroscopy. J. Biomed. Opt. 16, 077002 (2011).
61. Jacques, S. L. Optical properties of biological tissues: a review. Phys. Med. Biol. 58, R37 (2013).
62. Tuchin, V. V. et al. Dynamics and Fluctuations in Biomedical Photonics VIII. 78980Z (International Society for Optics and
Photonics).
63. Friebel, M., Helfmann, J., Netz, U. J. & Meinke, M. C. Influence of oxygen saturation on the optical scattering properties of human
red blood cells in the spectral range 250 to 2000 nm. J. Biomed. Opt. 14, 034001 (2009).
64. Bashkatov, A. N., Genina, E. A. & Tuchin, V. V. Optical properties of skin, subcutaneous, and muscle tissues: a review. J. Innov.
Opt. Health Sci. 4, 9–38 (2011).
65. Genina, E. A. & Tuchina, V. V. Dermal component–based optical modeling of skin translucency: impact on skin color. Comput.
Biophys. Skin 1, 25 (2014).
66. Löffler, H., Aramaki, J. & Effendy, I. The influence of body mass index on skin susceptibility to sodium lauryl sulphate. Skin Res.
Technol. 8, 19–22 (2002).
67. Vlachopoulos, C., O’Rourke, M. & Nichols, W. W. McDonald’s Blood Flow in Arteries: Theoretical, Experimental and Clinical
Principles (CRC Press, Boca Raton, 2011).
68. Fallow, B. A., Tarumi, T. & Tanaka, H. Influence of skin type and wavelength on light wave reflectance. J. Clin. Monit. Comput. 27,
313–317 (2013).
69. Bent, B., Goldstein, B. A., Kibbe, W. A. & Dunn, J. P. Investigating sources of inaccuracy in wearable optical heart rate sensors.
NPJ Digit. Med. 3, 1–9 (2020).
70. Zonios, G., Bykowski, J. & Kollias, N. Skin melanin, hemoglobin, and light scattering properties can be quantitatively assessed
in vivo using diffuse reflectance spectroscopy. J. Investig. Dermatol. 117, 1452–1457 (2001).
71. Weiler, D. T., Villajuan, S. O., Edkins, L., Cleary, S. & Saleem, J. J. In Proceedings of the Human Factors and Ergonomics Society
Annual Meeting. 1292–1296 (SAGE Publications Sage CA: Los Angeles, CA).
Acknowledgements
We are thankful for the National Science Foundation Engineering Research Center for Precise Advanced Tech-
nologies and Health Systems for Underserved Populations (PATHS-UP) (#1648451).
Author contributions
T.B. built the model, conducted simulations and analysis, and drafted the manuscript. A.K.H. assisted with
development of baseline computational framework. J.D.H. and J.C.R. assisted in core model concept develop-
ment. All authors contributed to model conception and reviewed the manuscript.
Competing interests
The authors declare no competing interests.
Additional information
Correspondence and requests for materials should be addressed to J.C.R.-R.
Reprints and permissions information is available at www.nature.com/reprints.
Publisher’s note Springer Nature remains neutral with regard to jurisdictional claims in published maps and
institutional affiliations.
Open Access This article is licensed under a Creative Commons Attribution 4.0 International
License, which permits use, sharing, adaptation, distribution and reproduction in any medium or
format, as long as you give appropriate credit to the original author(s) and the source, provide a link to the
Creative Commons licence, and indicate if changes were made. The images or other third party material in this
article are included in the article’s Creative Commons licence, unless indicated otherwise in a credit line to the
material. If material is not included in the article’s Creative Commons licence and your intended use is not
permitted by statutory regulation or exceeds the permitted use, you will need to obtain permission directly from
the copyright holder. To view a copy of this licence, visit http://creativecommons.org/licenses/by/4.0/.
© The Author(s) 2021
Scientific Reports | (2021) 11:2570 | https://doi.org/10.1038/s41598-021-82124-4 11
Vol.:(0123456789)You can also read