Taking a Deep Dive Investment Outlook
←
→
Page content transcription
If your browser does not render page correctly, please read the page content below

Investment Outlook
                                   August 2019

                       Taking a Deep Dive

    NZ Equities                 Australian Equities           Global Equities
   BUY Kathmandu                      BUY Aristocrat              BUY Amazon,
Mainfreight, Metlifecare,       Lend Lease, QBE Insurance,   Mastercard, Unitedhealth
       Z Energy                         South32                  Group, Walmart

       - Page 21                        -Page 24                    -Page 27
Investment Outlook August 2019

              Jarden
              Overview
August 2019   Interest rates have dived to extremely low depths as economic growth indicators
              turned down due to trade concerns and tensions between Iran and the US and its
              allies. Globally central banks have reacted to this by taking a more stimulative stance,
              including lowering interest rates. The interest rate falls have caused investors to flock
              to dividend yield equities, resulting in significant share price appreciation. This has
              been particularly apparent in New Zealand, which has a high proportion of dividend
              yield stocks. With dividend yield equities doing so well we have provided readers with
              an overview of the New Zealand electricity sector, which has a very high proportion of
              dividend yield equities and some interesting longer term dynamics.

              Looking forward, we see early signs that economic growth is starting to improve
              which suggests that interest rates are likely to bottom out before rising modestly.
              Probably the most significant risk to these “green shoots” is a deterioration in trade
              negotiations between China and the US. As we go to press, President Donald Trump
              has surprised us yet again by imposing a 10% tariff on the US$300 billion of goods
              from China that are currently tariff free. The market reaction has been swift with the oil
              price down nearly 8%, the gold price up US$32/ounce (reflecting the growing interest
              in gold assets we review the outlook for gold and associated investment options), a
              modest rise in the Japanese yen, and the US Treasury 10-year interest rate falling
              under 1.7%. While this has clearly dented investor and business confidence and
              makes it more likely that central banks will continue to reduce policy interest rates, we
              retain our view that a broadly positive resolution will emerge from the current trade
              negotiations. This reflects our expectation President Trump wants to be re-elected in
              the November 2020 presidential election, in which case he will want to be able to
              trumpet some success in the trade negotiations and avoid putting the US economy
              into recession. Historically, no sitting US president has been re-elected when the US
              economy is in recession.

              We acknowledge that the current economic cycle is mature and the economy is
              probably closer to a recession than it has been for many years. However, at this time
              there is no definitive evidence of an economic recession in the foreseeable future.

              Finally, we welcome two new advisers to the Jarden Wealth Management team, Greg
              Main in Wellington and Anna Boland in Queenstown.

              John Norling,
              Director, Head of Wealth Research

                                           Jarden Securities Limited | NZX Firm | www.jarden.co.nz         2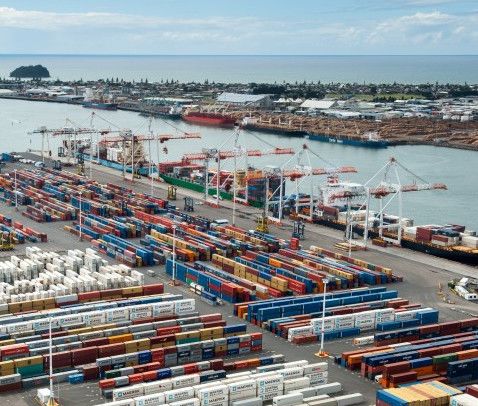
Investment Outlook August 2019

                          Contents
Taking a Deep Dive .............................................................................................................................................................. 4
Asset Allocation ........................................................................................................................................................................ 8
Infratil CEO - Marko Bogoievski ................................................................................................................................... 11
Introducing Ted Tsui – Global Equity Strategist ............................................................................................... 13
Global Direct Equity Portfolio ........................................................................................................................................ 14
New Zealand Electricity Sector 101 .......................................................................................................................... 15
New Zealand Equities ........................................................................................................................................................ 21
Australian Equities ............................................................................................................................................................... 24
Global Equities ....................................................................................................................................................................... 27
New Zealand Debt Securities ...................................................................................................................................... 31
The Future of E-Payments .............................................................................................................................................. 32
Gold Rising .............................................................................................................................................................................. 34
Jarden in the Community - Cystic Fibrosis NZ .................................................................................................. 35
Compass by Jarden .......................................................................................................................................................... 36
Calendar ................................................................................................................................................................................... 37
Your Local Jarden Team ................................................................................................................................................. 38

                                                                                   Jarden Securities Limited | NZX Firm | www.jarden.co.nz                                                        3
Investment Outlook August 2019
Taking a
Deep Dive
Key Takeaways Bad News is Good News
Equity markets
Equity markets have continued to power ahead, particularly in high dividend yield
bounce hard on a
markets such as New Zealand and, to some degree, Australia. Over the past 6-9 months
rosier outlook
Purchasing Manager Indices (timely indicators of economic growth) have declined
Economic activity is globally suggesting economic growth has recently softened. This is a reflection of
likely to accelerate
increased uncertainty from the US-China trade dispute, numerous threats by the US to
after a lack lustre
impose tariffs, growing tensions in the Middle East involving Iran, and lesser issues such
March quarter
as Brexit and Italian budget and debt problems. From the US perspective, over three
The net result of a years of Federal Reserve (Fed) interest rate rises have probably also taken a toll. The
more positive
increased uncertainty has seen gains in safe-haven assets, such as gold (discussed on
outlook is higher
page 34), US government bonds and, to a modest degree, the Japanese yen. No doubt
interest rates
the dive in 10-year US government bond yields from 3.2% to 1.7% also reflects muted
The RBNZ’s bank inflation pressures and an expectation by bond investors that the Fed needs to lower its
capital review is
Funds Rate from its current 2.0-2.25% band. Other central banks, such as the Reserve
likely to result in
Bank of New Zealand (RBNZ) and the Reserve Bank of Australia (RBA), also face softer
higher lending rates
economic growth and subdued inflation, and have either cut interest rates or indicated
over time
an intention to do so. A common thread amongst central banks appears to be the desire
to avoid having their currencies appreciate. Hence, there is a domino effect when large
central banks, such as the Fed, cut interest rates.
While central bank actions to stimulate economic growth in the face of subdued inflation
appears logical, it shouldn’t be overlooked that extremely low interest rates limit the
responses available when a recession arrives and can produce unintended
consequences. These include the adverse impact on savers income resulting in
pressure to save more to achieve the same level of future income, pressure on investors
to take on more risk to maintain the same level of investment income, and downward
pressure on bank earnings as net interest margins compress. Bank profitability is
important in order to have a sound banking system.
18
16
Very Low Interest 14
Rates Drive Up the 12
Savings Rate 10
Source: Bloomberg
8
6
4
2
0
1962 1972 1982 1992 2001 2011
US 10 Year Interest Rate US Savings Rate
Historically, it has taken around a 5% interest rate reduction to resuscitate economic
growth from recession. With central bank official rates in developed economies being at
most 2.5%, or in most cases much less, the scope for this sort of stimulus is limited. The
next weapon in the arsenal is quantitative easing (QE), a policy which arguably has had
only moderate success in stimulating economic growth in the face of structural
Jarden Securities Limited | NZX Firm | www.jarden.co.nz 4
Investment Outlook August 2019

                       challenges. However, it has successfully inflated asset prices. The lack of success is
                       exemplified by the Bank of Japan, which as a result of QE owns over US$5 trillion of
                       assets (mainly bonds, but also 4% of the Japanese equity market). Despite this, inflation
                       is only 0.7% and economic growth a poultry 1.1%. With monetary policy struggling to
                       have an impact, the next recession will almost certainly require Government’s to increase
                       spending to bring it to an end.

                       “There Is No Alternative”
                       When considering how much investors should allocate to equities numerous
                       commentators have concluded that “There Is No Alternative” (TINA). To date, apart from
                       bouts of short-lived equity price volatility, investors have enjoyed the benefits of taking
                       on greater risk in their investment portfolios. Investment income has been maintained or
                       increased and there have been capital gains to boot.

                       What happens if interest rates rise? Examining history, we observe that interest rate
                       moves tend to impact the prices of dividend yield equities (dividend yield equities are
                       those that pay a reliable and generally above average dividend yield).
                              10.5                                                                                            5.0
Dividend Yield
                                                                                                                              4.5
Equity Prices                       9.5
                                                                                                                              4.0
Benefit From Lower
                                    8.5                                                                                       3.5
Interest Rates, But
the Converse is Also                7.5
                                                                                                                              3.0

                                                                                                                                    Percent %
                        Percent %

True                                                                                                                          2.5
Source: Bloomberg                   6.5
                                                                                                                              2.0

                                    5.5                                                                                       1.5

                                                                                                                              1.0
                                    4.5
                                                                                                                              0.5

                                    3.5                                                                                       0.0
                                      May 15     Nov 15     May 16   Nov 16      May 17       Nov 17   May 18     Nov 18
                                         Spark                           Vector                            Contact Energy
                                         Genesis Energy                  Mercury Energy                    Meridian Energy
                                         Kiwi Property                   Precinct Property                 Goodman Property
                                         Auckland Airport (RHS)          10 Yr Interest rate (RHS)

                       While lower interest rates result in falling dividend yields and higher equity prices, the
                       converse is also true.

                       So are interest rates likely to rise or fall over the next twelve months? The RBNZ has
                       reduced the Official Cash Rate to 1.0%. Current pricing in the overnight indexed swap
                       (OIS) market suggests that the RBNZ’s Official Cash Rate (OCR) will fall another 0.25%
                       over the next year and the US Fed Funds Rate will fall a further 0.75%. Following the
                       recent interest rate cuts, we think further larger falls are unlikely to materialise. We expect
                       that the risk of higher future inflation, caused by a tight labour market and importantly an
                       improving economy will see the large decline in US interest rates implied by the OIS
                       market unwind. Consequently, the balance of probability favours a moderate increase in
                       interest rates on longer term bonds, unless US/China trade relations deteriorate further.
                       As shown on the following page, indications of an improvement in economic growth
                       include a bottoming of composite Purchasing Manager Indices globally.

                                                                 Jarden Securities Limited | NZX Firm | www.jarden.co.nz                        5
Investment Outlook August 2019

Composite                59
Purchasing               58

Manager Indices          57

Indicate Green           56
                         55
Shoots
Source: Bloomberg        54
                         53
                         52
                         51
                         50
                         49
                              Jul 16         Jan 17          Jul 17          Jan 18          Jul 18          Jan 19         Jul 19
                                                        US       UK          Europe         NZ          Australia

                       With the New Zealand 10-year government bond interest rate at a historically large 0.5%
                       below the US 10-year government bond interest rate, we expect any rise in US interest
                       rates to push local interest rates up. Should this come to pass, some of the recent capital
                       gains experienced by dividend yield stocks are likely to be lost.

                       When Bad News is Bad News
                       In recent times, bad news has been received by equity investors as good news because
                       it increases the chances that the Fed will lower interest rates. However, if a recession was
                       to occur, then this bad news would in fact be bad news for equity markets. In this case,
                       the fall in interest rates would be associated with falling company profits and a decline in
                       equity valuation multiples as investors demand higher investment returns from risky
                       assets. Even companies with highly certain profits may suffer from reductions in earnings
                       and dividends during a recession.

                       140

                       120

Dividend Variability   100
Post Global
Financial Crisis        80

Source: Bloomberg
                        60

                        40

                        20
                          2007                   2008                 2009                    2010                   2011               2012

                              Spark      Auckland Airport    Vector   Contact         Kiwi Property     Precinct Property   Goodman Property

                       The good news is that while the probability of a recession has increased (based on the
                       difference between interest rates on long and short maturity bonds, the Federal Reserve
                       Bank of New York calculates the probability of a US recession as 33%) the three
                       indicators of a recession that we use are not flashing recession in unison (all three
                       indicators are needed to avoid the risk of a false reading). However, we concede that
                       they are all much closer to that point now. Looking at each indicator in turn:

                              1.      The US 10-year interest rate is now below the 3-month interest rate, which is the
                                      only indicator to suggest a recession is imminent.
                              2.      The Fed Funds Rate is 2.1% which is slightly below the current neutral interest
                                      rate estimate of 2.3%, which uses the mid-point of the Federal Reserve Bank of
                                      New York’s range of the estimated neutral rate plus inflation as measured by the
                                      Personal Consumption Expenditures Price Index.
                              3.      The Conference Board US leading economic indicator is still up 1.6%.

                                                                Jarden Securities Limited | NZX Firm | www.jarden.co.nz                        6
Investment Outlook August 2019

                                                Key Questions for 2019 - Progress Report
                                                In the February Investment Outlook, we posed a number of questions that were likely
                                                to be important for the direction of markets in the medium-term. We give a progress
                                                report below.
                                                Can the oil price recover to US$70/barrel? In the June quarter the Brent oil price rose
                                                to over US$74/barrel as supply reductions played out. It is now hovering around
                                                US$66/barrel with extra US supply weighing on the price. However, should tensions
                                                with Iran in the Strait of Houmas erupt, it could spike higher.
                                                Will a recession occur in 2019? Despite softer economic growth so far in 2019, the
                                                year is well advanced and no recession is in sight.
                                                Could the New Zealand dollar fall below US$0.60? Despite the RBNZ reducing the
                                                OCR, the New Zealand dollar continues to trade in a range of US$0.64-0.69.
                                                Will the US/China trade dispute be resolved? Short term yes, long term uncertain.
                                                Will financial markets experience the same elevated levels of uncertainty as in 2018?
                                                To date, financial market uncertainty has been relatively subdued due to dovish
                                                central banks and an easing of trade tensions between the US and China.
                                                Will President Trump be impeached? Unlikely, although the Democrats continue to
                                                search for an angle for impeachment.
                                                Can inflation finally exceed 2%? Inflation remains subdued with New Zealand headline
                                                inflation for the year to 30 June 2019 being 1.7%.
                                                Will New Zealand house prices fall in value? Housing fundamentals remain soft, but
                                                not enough to cause nationwide house prices to fall. The demise of the capital gains
                                                tax proposal, robust inward migration and lower interest rates are expected to support
                                                the housing market.
                                                Will equity prices rise or fall? The 20%+ New Zealand equity market rise since 1
                                                February has trounced our expectation of a modest rise. We did not expect interest
                                                rates to fall and, therefore, didn’t anticipate the sharp appreciation of dividend yield
                                                equities.

Forecasts
Economics                                                                                                                              As at 1 August 2019
                               Fiscal Balance % GDP              GDP Growth %                 Inflation %            3 month Libor %       10 Year Government %
                                2018A 2019F 2020F 2018A 2019F 2020F 2018A 2019F 2020F                              Spot    3mth 12mth Spot           3mth 12mth
New Zealand                       1.1        0.7    0.5     2.8      2.5      2.6       1.6       1.6       1.9     1.5     1.3  1.3   1.4            1.6  1.8
Australia                        -0.5        -0.2   0.3     3.0      2.0      2.5       1.9       1.6       2.0     1.0     0.8  0.8   1.2            1.3  1.5
US                               -4.1        -4.4   -4.7    2.9      2.5      1.9       2.4       1.8       2.1     2.3     2.1  2.3   1.9            2.2  2.4
Japan                            -3.8        -3.5   -3.0    0.7      0.7      0.6       1.0       0.7       1.0    -0.1     0.0  0.0  -0.1            -0.1 0.0
Europe                           -0.7        -1.0   -1.0    1.8      1.2      1.4       1.7       1.3       1.4    -0.4     -0.4 -0.4 -0.5            -0.3 0.0
United Kingdom                   -1.5        -1.5   -1.7    1.4      1.2      1.3       2.5       1.9       2.0     0.8     0.8  0.9   0.6            1.0  1.2
China                            -4.1        -4.4   -4.3    6.6      6.2      6.0       2.1       2.4       2.3     2.6     2.6  2.5   3.2            3.0  2.8
Source: Jarden, Bloomberg
NZ and Australia fiscal balance is 30 June
NZ is the 90-day bank bill yield

Equities and Commodities                                                                                          Foreign Exchange
                                 Spot          12 mth forecast      Past Month        Past Year                                 USD              NZD
Australia – ASX 200             6,789           6,500 - 7,200         2.1%                8.2%                             Spot 12mth Spot 12mth
Emerging Markets                1,025           1,060 - 1,180         -3.7%              -5.7%                    NZD       0.66  0.68   -    -
Europe – Stoxx 600                388             390 - 430           0.0%               -0.6%                    AUD       0.68  0.72 0.96 0.95
Japan - Topix                   1,567           1,540 - 1,700         0.9%              -11.4%                    EUR       1.11  1.15 0.59 0.59
New Zealand – NZX              10,861          10,500 - 11,600        4.1%              22.6%                     JPY      107.4 107.0 70.4 72.8
UK – FTSE 100                   7,585           7,400 - 8,100         1.2%               -0.9%                    GBP       1.21  1.28 0.54 0.53
US – S&P 500                    2,954           2,970 - 3,280         -0.4%               5.0%                    CNY       6.90  6.95 4.52 4.73
Oil Brent USD/bbl                  61              60 - 66            -7.0%             -16.4%                    Source: Jarden, Bloomberg, IRESS
Gold USD/Oz                     1,445           1,340 - 1,490         4.4%              18.9%
Source: Jarden, Bloomberg

                                                                                    Jarden Securities Limited | NZX Firm | www.jarden.co.nz                 7
Investment Outlook August 2019
Asset
Allocation
Key Takeaways Global Equities
Given risks and Over the next twelve months or so, we see reasonable support for global equities. We
the late stage of expect company earnings to improve somewhat in the near-term as global economic
the investment growth tentatively rises toward the end of 2019. Short-term interest rates probably have a
cycle, we are little further to decline before stabilising. Gradually rising longer-term interest rates are
circumspect on unlikely to be much of a headwind for equities if earnings are increasing.
equities.
Low interest Global equity valuation ratios, such as the price-to-earnings (PE) ratio, have risen this year
provide some and are now slightly above their longer-term historical average. However, they are not
support for NZ extreme and don’t give too much guidance on the near-term direction of equity markets.
equity prices. Low interest rates, improvements in earnings and easing economic uncertainties are likely
Flatter yields to be more influential on the direction of equity prices in the near-term.
reduce our
appetite for NZ
debt securities. 26
24
22
Global Price-to- Long-term average PE ratio
PE Ratio x
20
Earnings Ratio 18
Source: Bloomberg, Jarden
16
14
12
10
8
2001 2003 2005 2007 2009 2011 2013 2015 2017 2019
Balancing the positive near-term signs we see for global equities, we are more cautious on
Slight caution on a longer horizon. This investment cycle has been a long one and vulnerabilities, such as
equities as reward-to- elevated debt levels, are building. We are aware that we are closer to the end of the
risk trade-off investment cycle than the beginning. For this reason, the reward-to-risk trade-off has
diminished somewhat diminished somewhat.
New Zealand Equities
New Zealand equities have been star performers in recent times. New Zealand dividend
yield equities have benefited from the global search for yield in a low and falling interest
rate environment. As a result, valuations have been driven up to very high levels, both
compared to history and relative to the rest of the world. As the following chart suggests,
higher New Zealand valuations are potentially justified given where interest rates have
tracked so far. While low interest rates are supportive we observe the limited number of
observations at current low interest rates (refer to graph on following page), which leaves
us less convinced regarding what the data is currently showing. Regardless of this, the
New Zealand dividend current high valuation ratios are most likely only sustainable if interest rates do not rise
yield equities will be much from current levels. Given how far and fast valuations have risen, it’s possible that
sensitive to even New Zealand’s dividend yield equities will be sensitive to even modest lifts in 10-year
modest lifts in 10-year interest rates. This will be a headwind for their total returns, even accounting for the
interest rates dividend income that is derived from them.
Jarden Securities Limited | NZX Firm | www.jarden.co.nz 8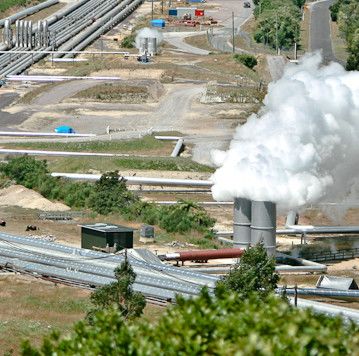
Investment Outlook August 2019

                                                       28.0
                                                       26.0

                             Price-to-earnings ratio
Low Interest Rates                                     24.0
Support High NZ                                        22.0
                                                       20.0
Equity PE Ratios
                                                       18.0
Source: Bloomberg, Jarden
                                                       16.0         As at 31 Jul
                                                       14.0
                                                       12.0
                                                       10.0
                                                        8.0
                                                              1.0           2.0          3.0             4.0        5.0        6.0               7.0
                                                                                               10-Year Bond Yield

                            New Zealand Property
                            Another area that has benefited from low interest rates to a significant degree is New
                            Zealand listed property, which like a good proportion of New Zealand equities, provides
                            sustainably high dividends. Consequently, valuations in the sector have also risen
                            significantly above historical averages as capitalisation rates have followed interest rates
                            down.

                            New Zealand property valuations are likely pricing in the expectation that the interest rate
Higher interest rates       on a 10-year government bond will remain at its current low level for a considerable period
may cause New               into the future. If, as we expect, longer-term interest rates gradually rise as the year
Zealand listed              progresses, then listed property equity prices will likely stutter. High income yields on
property to stutter         property equities may not be enough to prevent sector underperformance compared to
                            the rest of the market.

                            New Zealand Cash and Fixed Interest
                            The chart below illustrates how far interest rates have declined over the past three months
                            to the end of July, particularly for the longer terms to maturity and lower credit quality debt
                            securities (BBB and BB rated securities). In combination with our expectation that longer
                            term interest rates will likely come up for air into the end of the year, the investment return
                            from cash (short-term securities) appears relatively more attractive. We acknowledge that
                            should investor confidence be dented, by events such as a deterioration in US/China trade
                            negotiations or an increase in tensions between the US and Iran, then both long and short
                            term interest rates could dive further in the interim.
                                                       5.0%
A Precipitous Fall
                                                       4.5%
in Longer Term
Interest Rates                                         4.0%
                                                                                                                                         -1.0%
Source: Bloomberg, Jarden
                                                       3.5%

                                                       3.0%
                                                                                                                                     -0.6%
                                                       2.5%

                                                       2.0%

                                                       1.5%
                                                                     0.3           1.0         2.0         3.0        4.0          5.0           6.0

                                                                BBB 3 Months Ago               BBB Now           BB 3 Months Ago             BB Now

                            As a result of lower interest rates and the outlook, we modestly reduce the allocation to
                            New Zealand debt securities, and modestly increase the allocation to cash.

                                                                                         Jarden Securities Limited | NZX Firm | www.jarden.co.nz       9
Investment Outlook August 2019

                                 Asset Allocation
                                 August 2019
Based on the Asset Allocation discussion on pages 8-9, we have reduced the exposure to NZ Debt Securities by 1% and
increased Cash by 1%. The Strategic Asset Allocation represents the average weighting over the long term (circa ten
years or an entire economic cycle). The Tactical Asset Allocation represents a deviation from the Strategic Asset
Allocation to take advantage of expected changes in asset class returns over the short term (say 6 months plus). We have
retained the overweight exposure to Global Equities and underweight exposure to NZ Equities and Property.

                            %                    Strategic Allocation                          Tactical Deviation %
                                             Income Assets     Growth Assets
Conservative
   Cash                     15                                                                                +1
   NZ Debt Securities       55                                                                                +1
   Property                  4                                                                        -2
   NZ Equities               8                                                                      -3
   Australian Equities       3
   Global Equities          12                                                                                     +3
   Alternative Strategies    3

Balanced/Conservative
   Cash                     11                                                                                +1
   NZ Debt Securities       44                                                                                +1
   Property                  5                                                                        -2
                                                                                                    -3
   NZ Equities              12
   Australian Equities       6
                                                                                                                   +3
   Global Equities          18
   Alternative Strategies    4

Balanced
   Cash                      8                                                                                +1
   NZ Debt Securities       32                                                                                +1
   Property                  6                                                                        -2
                                                                                                    -3
   NZ Equities              16
   Australian Equities       8
                                                                                                                   +3
   Global Equities          25
   Alternative Strategies    5

Balanced/Aggressive
   Cash                      7                                                                                +1
   NZ Debt Securities       23                                                                                +1
   Property                  6                                                                        -2
   NZ Equities              20                                                                      -3
   Australian Equities      10
   Global Equities          29                                                                                     +3
   Alternative Strategies    5

Aggressive
   Cash                      5                                                                                +1
   NZ Debt Securities       15                                                                                +1
   Property                  6                                                                        -2
   NZ Equities              23                                                                      -3
   Australian Equities      12
   Global Equities          34                                                                                     +3
   Alternative Strategies    5

                                                             Jarden Securities Limited | NZX Firm | www.jarden.co.nz    10
Investment Outlook August 2019
Infratil CEO
Marko Bogoievski
Marko wears many hats, one of which is as the Chief Executive Officer (CEO) of Infratil. His
other key role is as CEO of H.R.L Morrison & Co, the manager of Infratil. Before taking up
these roles Marko had a significant breadth of business experience.
The Early Years
As a boy Marko grew up in the Hutt Valley suburb of Petone, attending local schools,
playing football, and supporting the Petone Rugby Club. Somewhat unusually Marko
skipped his last year of secondary school, instead opting to attend Victoria University
where he graduated with a BCA in accounting and economics. Fresh out of university he
joined the Price Waterhouse audit team. Back then, the “Big-8” offered employees
attractive options to gain experience offshore. This saw him hit the streets of New York at
Marko Bogoievski 23, joining Price Waterhouse’s Transaction Services team, which involved the
comprehensive appraisal of businesses on behalf of prospective buyers. The experience
of living in New York had a significant impact on Marko, and in his words, caused him to
Key Takeaways “harden up”. Gaining experience in new areas appear to be a hallmark of Marko’s career.
Life in New York Consequently, after a couple of years at Price Waterhouse he took up a role as financial
and a Harvard MBA controller with one of their clients, Elders IXL subsidiary, Elders Finance US. There he learnt
were key factors first-hand about trading and merchant banking. Problems at Elders IXL saw this job come
shaping a young to an end and what followed was two years at the Harvard Graduate School of Business
man from Petone, where he earned an MBA. The highly competitive environment of Harvard and the need to
New Zealand work fast (three real-world business case studies to prepare each night for the following
Marko has overseen day) and be thorough while reaching robust conclusions (the key person associated with
a period of the case study was often in attendance at the class discussion) has been a great asset.
significant growth
and investment Attracted by the leadership development program offered by Lion Nathan, Marko returned
performance at to New Zealand in 1994 with his American wife and two boys to take up a role as sales
Infratil and Morrison director in the NZ Wines and Spirits business. A few years later, Marko was back in the US
& Co working for Dispatch Management Services Corp, a start-up company, which ultimately
Within Infratil’s listed on the NASDAQ stock exchange. The aim of the company was to provide a same-
portfolio, Marko day delivery service through the amalgamation of a large number of courier companies.
believes Longroad Unfortunately to make this concept work required computer and communications
and Canberra Data technology, which wasn’t cheap or reliable back then. Over 20 years later, Fedex, Amazon
Centres offer near- and Wal-Mart are still working on how to provide consistent same day delivery services to
term valuation their customers.
upside
H.R.L. Morrison & Co and Infratil
What followed was eight years as Chief Financial Officer of Telecom Corporation of NZ,
which subsequently became Spark. Marko thoroughly enjoyed the people, the diversity of
the role and working through the significant strategic issues faced by Telecom at that time.
At the end of his tenure, Marko was approached by the late Lloyd Morrison to join H.R.L
Morrison & Co, the manager of Infratil. At that time Morrison & Co had less than twenty staff
and their main client was Infratil. Rolling forward twelve years Morrison & Co has 130 staff,
approximately $15 billion of funds under management (of which IFT is around one third)
across a number of clients and offices in five countries including New Zealand. The
advantage for Infratil of Morrison’ & Co’s growth relates to the greater number of
investment professionals that can be used to identify opportunities for new investment.
This increases the reach of the organisation across the globe, sectors and investment
themes that Morrison & Co specialises in. The management style engendered by Marko is
a collaborative environment, where employees are given a lot of autonomy and
Jarden Securities Limited | NZX Firm | www.jarden.co.nz 11Investment Outlook August 2019
encouraged to allow investment ideas to be developed in a fluid way rather than by
following a rigid process.
As with many successful people, Marko works hard to achieve a balance between the time
dedicated to his work and his family, which includes his wife, two sons and parents who
continue to live in the family home in Petone.
Invest in ideas that Morrison & Co’s mantra is to “Invest in Ideas that Matter”, a concept that has been applied
matter to Infratil. Recently, this has seen Infratil reset its investment portfolio to be focused on
renewable energy, data, and communications infrastructure. This has seen divestment
activity around NZ Bus, ANU student accommodation, and Perth Energy, and the
acquisition of 49.9% of Vodafone New Zealand for $1.029 billion (representing around
20% of Infratil’s assets) and Canberra Data Centres’ (CDC) acquisition of the Eastern Creek
data centre campus for around A$100 million. In Marko’s eyes IFT is an “absolute return”
fund, which provides steady returns over time while paying a regular distribution to
investors. Over the years it has been one of the best performers in the NZ equity market
producing a compound total shareholder return of approximately 17%pa over the past 20
years.
So which of Infratil’s assets is Marko most excited about? Time will tell with Vodafone; in
the near term CDC and the dark horse in the stable, Longroad, are likely to offer the
biggest performance gains.
Canberra Data Centre (CDC)
Inside a Data A data centre is a large group of networked computer servers typically used by
Centre organisations for the remote storage, processing or distribution of large amounts of
electronic data. Key attributes of a data centre are:
1. Data integrity – Systems should exist to ensure that data is stored and retrieved
exactly as it was received from customers.
2. Availability – The data needs to be available when it is required, so absolute
reliability is key. Therefore electricity supply, communication connections and air
conditioning must be fool proof.
3. Security – Measures need to be put in place to prevent unauthorised access to and
alteration of information held on the data centre’s computer servers.
Source: Infratil 4. Scalability – Data centres need to be able to scale up to meet the changing needs
of customers, without interrupting their current business operations.
5. Capacity – Data centres need to be able to efficiently store and process large and
rapidly growing data volumes. Data centre capacity is measured in megawatts
(MW).
CDC (IFT ownership 48%) currently has 60MW at two sites in Canberra with another
25MW to be completed by the end of the year. At Eastern Creek in Sydney there is 7MW
with the potential to grow up to 120MW. While the contracts at Canberra are generally for
3-4 years with options to extend, the Sydney contracts are for 15 years with revenue
locked in at the rate of inflation.
Longroad Wind Longroad
Turbines Longroad (IFT ownership 40%) is a developer of utility-scale wind and solar electricity
generation projects in North America, which it then on-sells to long term investors such as
pension and insurance funds. Longroad is developing multiple projects of which it has
sold two projects totalling 553MW. In 2019, Longroad is developing four projects totalling
over 800MW. Many investors will also get Longroad to provide long-term management
services for the assets after a sale. Longroad currently services 1,732 MW of electricity
capacity. It is estimated that north America requires 100,000MW of new renewable
Source: Infratil electricity generation capacity by 2030.
Jarden Securities Limited | NZX Firm | www.jarden.co.nz 12Investment Outlook August 2019
Introducing Ted Tsui -
Global Equity Strategist
Joining Jarden in early 2018 Ted brings with him a wealth of experience from his time
in Asia working in a range of equity and fixed income research and investment
management positions.
Although Ted was born in Shanghai, he spent most of his youth in Singapore and
completed his tertiary education in Hong Kong. Singapore, in particular, has shaped
his careful and disciplined way of researching and analysing companies. Singapore
maintains an army of 1.2 million soldiers, with all male Singaporean citizens being
required to serve a period of compulsory military service. Consequently, Ted served
Ted Tsui
two and a half years on a full-time basis in the Singapore Armed Forces, where he
learned the importance of paying attention to details in addition to a standard set of
basic military and survival skills. He was discharged with a unit best soldier award in a
Key Takeaways
coastal defence brigade in 2002.
Robotics engineer turned
investment analyst with a On leaving the military, Ted returned to Hong Kong and commenced university.
CFA designation Spurred on by an interest in robotics and artificial intelligence, Ted completed a
A prudent, bottom-up, rigorous bachelor degree with honours in automation and computer-aided
fundamental and engineering. Right before the 2007 global financial crisis, Ted embarked on a
methodological significant career change focusing his attention on the investment industry. This shift
investment specialist came with a decision to undertake a further three years of part-time study, which saw
A youthful look belies him achieve the globally recognised Chartered Financial Analyst (CFA) designation.
years of extensive Ted’s early years in the investment industry saw him undertake a number of roles, in
knowledge and equity and credit research, at various firms in Hong Kong. His professional experience
experience includes working for a Geneva-based family office, Sumitomo Mitsui Banking
Corporation and the Asian arm of a European asset management firm, La Francaise
Group. He found his niche as a fundamental-driven and bottom-up investment
analyst in managing more than USD 500 million of institutional and high-net-worth
client assets. His years of prudent investment experience were built with interviewing
top company officials, visiting factories, attending investment conferences, cross-
checking ground information with industry experts, scrutinising company disclosures
and building complex financial models to draw up various company business
scenarios. Analysing companies fascinates Ted, giving him knowledge of what
particular companies do, which in turn generates a better insight into how the world
operates behind the scenes. Ted, a self-described “infomaniac”, enjoys researching
anything from global macroeconomic data to prices at the Albany Pak’nSave. This
allows him to form a longer-term and deeper understanding of the country and the
industry in question.
At Jarden, Ted continues to use the bottom-up and analytical approach he honed in
Asia. There is no doubt that Ted’s youthful looks belie his years of experience and
extensive knowledge. The evidence of this can be seen in the impressive
performance of the Jarden Global Direct Equity model portfolio, which relies heavily
on Ted’s expertise and is explained by Ted on the following page.
Away from the office Ted enjoys do-it-yourself (DIY) projects at his North Shore home,
cycling and exploring the New Zealand countryside with his wife.
Jarden Securities Limited | NZX Firm | www.jarden.co.nz 13Investment Outlook August 2019
Global Direct Equity
Portfolio
Key Takeaways The Global Direct Equity Portfolio commenced on 30 June 2018, with the aim of
providing investors with a model portfolio of enduring international businesses. On
Direct ownership of
average, the portfolio targets outperformance of the MSCI All-Country World Index
enduring
(ACWI) by 2% per annum. In its first year, the portfolio generated a total return of 9.4%
international
businesses in New Zealand dollars (NZD), which was 2.1% more than a passive ACWI portfolio.
A concentrated but The success of the portfolio, in a highly volatile equity market environment, was largely
well diversified due to the favorable results of our bottom-up stock selection process. When selecting
portfolio of 14-16 a company for the portfolio, detailed analysis of comparable companies is conducted
companies in order to identify those that offer superior business performance. A heavy emphasis
Strict risk is placed on the company’s track record to generate a sustainable level of free cash
management flow over past economic cycles to ensure that it can indeed create economic value for
controls with investors. At the same time, a discounted cash flow valuation is conducted to estimate
Investment a reasonable value range for the business.
Committee
oversight In addition, it would be impossible to deliver good investment performance without
observing various risk management rules. The portfolio is highly concentrated,
comprising 14 to 16 companies (domiciled outside Australasia) from various sectors
and geographic regions. To manage portfolio risk, each company represents between
4% and 10% of the portfolio. At the same time, the aggregate exposure to each sector
Disney’s Key Businesses
and geographic region is allowed to vary from the proportions in the ACWI by no more
than 14%. The portfolio is constantly monitored and reviewed monthly by an
investment committee, which consists of Jarden investment professionals across a
range of disciplines with many decades of experience. This also ensures that the
portfolio’s objectives and risk management restrictions are strictly observed. In line
with the portfolio’s aim to adopt a longer-term investment view and keep transaction
costs down, a 12-month rolling turnover budget of 50% is observed.
Walt Disney (DIS)
Walt Disney (Disney) is one of the better-performing stocks in the portfolio (annual
NZD return of 36.6%) and serves as a good illustration of the characteristics we look for
when selecting a company for the portfolio.
Although investors may perceive Disney as a company focused only on cartoons and
theme parks, it has evolved tremendously in recent years to become one of the three
largest media companies in the world. In addition to the traditional cartoon and theme
park businesses, Disney has expanded horizontally and vertically into television, film
and video-on-demand businesses (i.e. Hulu and Disney+). Through owning a
diversified media distribution network and a portfolio of high-quality content beyond
cartoons, Disney’s ability to raise prices and generate a growing stream of free cash
flow over the past economic cycle has been nothing less than spectacular.
When we added Disney to the portfolio, we were anticipating the creation of an even
larger high-quality content portfolio after the acquisition of 21st Century Fox. With the
ultimate launch of its own video streaming services in November this year, Disney will
further monetise their enlarged content portfolio in multiple ways and deliver
unparalleled synergies that are nearly impossible to replicate by its competitors.
Disney has executed its strategy well and is on its way to becoming the largest and
most competitive media company in the world. We believe Disney’s competitive
advantage will continue to stand the test of time and deliver superior returns to
investors.
Jarden Securities Limited | NZX Firm | www.jarden.co.nz 14Investment Outlook August 2019
New Zealand Electricity
Sector 101
Key Takeaways In New Zealand, a large number of sectors are represented by a single listed company.
Instantaneous However, there are seven sectors comprising three or more companies. Over the
electricity coming quarters we plan to provide an overview of each of these sectors and the
production and common factors that affect the companies within each sector. We decided to start with
consumption the largest sector being the electricity sector which accounts for 19% of the New
creates interesting Zealand equity market’s total market capitalisation. Adding to the sectors intrigue is the
dynamics recent strong investment returns from long-term interest rates collapsing and changing
Construction and dynamics brought by climate change resulting in a push to reduce carbon dioxide
operating costs, emissions.
asset life, and
capacity utilisation Market Forecast FY20 Dividend Reported
vary materially Investment Return Carbon
Company Ticker Capitalisation Yield
between generation Emissions
($ billion) (CO2e t)
types Net Gross 1 Year 5 Year (pa)
Electricity is Contact Energy CEN 5.7 4.9% 6.2% 45.5% 17.1% 1,186,122
expected to Genesis Energy GNE 3.5 5.1% 6.5% 45.6% 24.7% 1,480,180
increasingly Meridian Energy MEL 12.4 4.1% 5.0% 60.3% 48.1% 3,588
displace fossil fuels. Mercury NZ MCY 6.5 3.3% 4.0% 44.4% 23.5% 346,698
The sector could be TILT Renewables TLT 1.2 0.4% 0.4% 34.6% n/a n/a
upset by the smelter Trustpower TPW 2.4 4.5% 6.2% 46.3% 19.0% n/a
closure or lower Vector VCT 3.8 4.3% 6.0% 23.6% 15.7% 399,015
electricity prices Source: Bloomberg, Jarden, company reports
Electricity is an interesting commodity in that it is consumed immediately after it is
generated. This creates a dynamic where electricity generators have to produce
electricity to meet demand, which fluctuates significantly during the day (with heavy
demand in the early morning and evenings, and limited demand overnight) and at
different times of the year (higher demand in the winter than in the summer). As it is
undesirable for the lights to go out, different forms of generation have to be brought in
and out of production at relatively short notice to meet demand.
The electricity price is determined on a half-hourly basis by electricity generators
submitting offers into the market and large electricity consumers and retailers
(purchasers) submitting bids to buy electricity. The electricity market is operated by the
Electricity Authority.
The electricity sector can be broken down into five distinct parts, which fit together as
shown in the diagram below.
New Zealand’s
Electricity System
Source: Electricity Authority
Jarden Securities Limited | NZX Firm | www.jarden.co.nz 15Investment Outlook August 2019
1. Electricity Generation
Electricity is generated from four energy sources – hydro, wind, geothermal, and
thermal (by burning gas or coal). As can be seen from the charts below, hydro
generation dominates the New Zealand electricity market with production coming
predominantly from four generators.
Hydro Meridian
5% 3% 11%
New Zealand’s Contact
Geothermal 8% 31%
Electricity Sector 16%
Genesis
Broken Down by Thermal 13%
59%
Generation Type and 17%
Mercury
Generator Wind
16% 21% Trustpower
Source: Electricity Authority
Other Other
Hydro
Hydro electricity is generated from water flowing through a penstock and turning a
turbine. While there is some potential to store water behind a dam for future use, water
storage in New Zealand is relatively limited. The maximum storage in any year equates
to 10% of total electricity production. Consequently, most hydro generation is “run of
river”, which means that the electricity is generated as the water naturally flows down
the river. This forms base load generation, while water stored behind dams can be
used to meet peaks in demand. Unfortunately, during dry years there is less water
Construction Cost: high
flowing down rivers to generate electricity and, therefore, less hydro-electricity
Life: 100 years + generation. The capital cost of building hydro electricity generation is very high as
Capacity utilisation: 65% dams are very expensive, although the key factor preventing further hydro
development is the difficulty in getting resource consent as much as construction
costs. Once built, hydro generation lasts a very long time (100 years plus) and the cost
of generating electricity is low as water costs nothing. Consequently, when there is a lot
of water available wholesale electricity prices are low. However, when there is a lack of
water, electricity prices rise reflecting the cost of having to generate electricity from
more expensive energy sources.
Wind
Wind generation is relatively expensive to build (around $2 million per megawatt), but
not as expensive as building a dam. Once built, the cost of generating electricity is low
as wind doesn’t cost anything. However, the maintenance costs on wind turbines are
higher as the variability of wind speeds and direction is tough on the turbines. This also
means that they don’t last as long as hydro dams, with a typical life of 25-30 years.
Based on the current costs of constructing and operating wind generation, it is the
most economic form of new electricity generation and thus sets the long-run cost of
Construction cost: $2 electricity in New Zealand used to value electricity generation assets. A key issue
million/ megawatt associated with wind farms is that they only generate electricity when the wind is
Life: 25-30 years blowing. Hence, wind farms have to be located in areas that have reliably consistent
Capacity Utilisation: 40% wind conditions. Due to the day-to-day variability of wind in New Zealand, wind farms
typically operate at 40% capacity utilisation.
Geothermal
Geothermal electricity uses geothermal steam as a heat source to turn a turbine.
Building a geothermal generation plant is relatively expensive, involving the drilling of a
number of geothermal wells and connecting them up to a generation plant. While the
geothermal steam is free, it is hard on the plant, which means maintenance cost are
high. Geothermal generation has the advantage that the steam comes out of the
ground consistently and is unaffected by weather conditions. It thus represents
Jarden Securities Limited | NZX Firm | www.jarden.co.nz 16Investment Outlook August 2019
Construction cost: $4 baseload generation. It is worth noting that geothermal generation results in
million/ megawatt greenhouse gas emissions that are released as the geothermal fluid is extracted from
Life: 30 years the reservoir.
Capacity Utilisation: 98%
Thermal
Finally, there is thermal generation, which is typically fuelled through burning gas or
coal. The construction costs of a thermal generation plant are relatively low. However,
the cost of fuel, gas or coal, is high. The advantage of a thermal plant is that fuel
sources can be stored and used as required. Consequently, thermal electricity
generation is often used to meet peaks in electricity demand or when other types of
generation are not producing electricity. Burning coal and gas creates a significant
amount of carbon dioxide. Hence, as the cost of producing carbon dioxide rises so
Construction cost: $1-1.5 does the cost of producing electricity from thermal generation. Currently the carbon
million/ megawatt
cost is capped at $25/t. However, it could easily rise to $50/t or much higher based on
Life: 30 years various academic studies.
Capacity Utilisation: 90%
Solar
Apart from a modest number of solar panels on roofs the amount of solar generation in
New Zealand is very small. The largest solar electricity plant is currently being built by
New Zealand Refining in Whangarei (capacity 26MW, covering 31 hectares). This
development is expected to have a very low capacity utilisation of only 15%.
2. Electricity Transmission
Once the electricity is generated it has to be transported from the point of generation to
the point of consumption. The first part of this transportation process is undertaken by
The high voltage the high voltage network, otherwise known as the National Grid (Grid), which is owned
network (National Grid) and operated by Transpower (100% government owned). The Grid is capable of
is owned and operated transporting electricity from one end of New Zealand to the other. As the Grid is a
by Transpower monopoly the amount that it can earn from transporting electricity is regulated. The
regulation is overseen by the Commerce Commission and pricing is reset every five
years. The flow of electricity through the Grid is managed by the Independent System
Operator which is owned by Transpower, but operates independently.
3. Electricity Distribution
Once the electricity exits the Grid it is transported to its final destination for
Low voltage networks consumption via low voltage networks. The low voltage networks are owned by lines
are owned by lines companies of which there are 30 in New Zealand. As the lines companies have
companies of which monopolies in the areas serviced by their networks, the amount they can earn is
there are 30 regulated. As with Transpower, the regulation is overseen by the Commerce
Commission and pricing is reset every five years. The largest lines company is Vector
(VCT), which serves Auckland. VCT also owns an electricity metering business.
Metering is not a monopoly, which means that VCT can set its own prices for providing
metering services.
4. Electricity Retailers
Electricity consumers buy electricity off electricity retailers who buy the electricity off
electricity generators. In New Zealand, it is common for companies to both generate
and sell retail electricity. However, there are an increasing number of niche retail
electricity companies which purchase electricity off the generators to supply their
customers. The electricity price is extremely volatile, often rising or falling by 20% or
more on a weekly basis.
Jarden Securities Limited | NZX Firm | www.jarden.co.nz 17Investment Outlook August 2019
100
Weekly Electricity Price Change (%)
Electricity – The 80
Most Volatile
60
Commodity Known
to Man 40
Source: Bloomberg
20
0
-20
-40
-60
Jul 18 Sep 18 Nov 18 Jan 19 Mar 19 May 19 Jul 19
Typically, electricity retailers sell electricity to households based on a fixed tariff, which
includes the electricity generation, transmission and distribution costs, plus a profit
margin. The electricity retailer, therefore, absorbs the electricity price fluctuations.
When electricity prices are low they make large profits and when electricity prices are
high they make losses, which averages out over time. Furthermore, as most retailers are
also generators, during times of high prices the generation division does well at the
expense of the retailing division, and the opposite occurs when electricity prices are
low. Many of the smaller electricity companies provide electricity at prices that reflect
the volatile wholesale price. In the long term, their customers should make savings.
However, their electricity bills will fluctuate significantly from month-to-month, not only
due to the amount of electricity used, but also due to price of electricity.
5. Consumers
Electricity consumers range from households, small-to-medium sized industrial and
commercial users, through to large users such as the Kawerau pulp and paper mill,
NZAS consumes 13% of Glenbrook steel mill and New Zealand’s Aluminium Smelter (NZAS - which consumes
the country’s electricity 13% of the country’s electricity production annually). For some time now, growth in
annually electricity demand has been around 0.5%pa. Domestic demand is driven by the
growth in the number of households. However, while there are more households, the
use of more efficient appliances (e.g. heat pumps and LED light bulbs) results in a
gradual fall in electricity usage per household. Growth in industrial and commercial
demand is influenced by similar factors.
Being a key commodity in today’s modern world the electricity price is always a
potential target for politicians if prices rise too quickly. This has seen the recent
publication of the 2018-2019 Electricity Price Review.
The Energy of the Future
Looking forward there is a major drive towards reducing carbon emissions in an effort
to keep the level of global warming to no more than 1.5-2.0°C above pre-industrial
Electricity demand levels by 2050. As a result, renewable electricity demand growth is likely to increase
growth is expected to from the current 0.5%pa to around 2.0%pa over the coming decades. It is expected that
increase from the electricity generated by renewable sources (wind and geothermal) will displace fossil
current 0.5%pa to fuels both in industrial processes (e.g. milk powder driers) and transport (vehicles). The
around 2.0%pa extent of the extra generation capacity needed in New Zealand will be partially
impacted by whether NZAS continues to operate its smelter at Bluff. At this stage, there
is no imminent sign that they may close down the smelter having just re-energised their
fourth pot line. Its current supply contract with Meridian Energy expires in 2024. At this
time they may decide not to renew their contract and shut the smelter down. We
expect negotiations on a potential new contract to commence in 2022-2023.
Jarden Securities Limited | NZX Firm | www.jarden.co.nz 18Investment Outlook August 2019
While the majority of the new generation is expected to be from renewable sources,
there is always likely to be a small amount needed from thermal electricity generation
in New Zealand to ensure continuity of supply in extreme climatic conditions
Electricity Sector Outlook
The electricity sector faces a dynamic outlook driven by a step up in electricity demand
and the construction of new generation following an extended period of no new
development. In addition, there are two events that could have a material impact on the
electricity price and, thus, the value of electricity generation assets. They are the
potential closure of the NZAS’s Tiwai Point smelter and potential change in the
economics of wind generation should cheap capital become freely available. The
availability of cheap capital is a real possibility on the back of low interest rates and the
low returns needed to satisfy foreign investors (e.g. sovereign wealth funds) looking to
invest in long-term stable assets such as electricity generation assets. Under this
scenario the real electricity price could reduce from our expected $80/MWh to
$60/MWh in the mid-2020s. While a lower electricity price would be negative for
electricity generation asset valuations, this would be offset to varying degrees through
the use of a lower capital cost.
Valuation Under Valuation Under
Company Target Company Ticker Share Price Target Price *
Scenario 1 ** Scenario 2 ***
Prices and Potential
Valuations Contact Energy CEN $7.92 $7.01 $6.02 $7.80
Source: Jarden Genesis Energy GNE $3.42 $2.17 $1.85 $1.92
Meridian Energy MEL $4.83 $3.22 $3.23 $4.32
Mercury NZ MCY $4.79 $3.47 $3.11 $3.92
TILT Renewables TLT $2.65 $2.34 n/a n/a
Trustpower TPW $7.59 $5.39 $4.72 $6.98
Vector VCT $3.86 $3.27 n/a n/a
* Base Case: 8.05% cost of capital, $80/MWh electricity price
** Scenario 1: Tiwai closes in January 2021, $80/MWh electricity price by 2027
*** Scenario 2: Low cost of capital (6.0%), $60/MWh electricity price by 2023
Sector Preferences
Contact Energy (CEN) We regard CEN as well positioned to be relatively safe from regulatory and electricity
supply/demand disruptions through its adoption of a cost-light, fast-follower retail
strategy. In addition, CEN has strong opportunities to participate in renewable
electricity growth and industrial electrification.
Mercury NZ (MCY) MCY has a fairly stable earnings path, the most natural competitive advantages, fewest
moving parts, and least negative exposures within the sector. Its predominately upper
North Island portfolio offers a degree of insulation from a potential NZAS exit in the
future. MCY is a 100% renewable generator, trading effectively in the wholesale market
and continues to be an excellent retail operator, despite the high level of competition.
TILT Renewables (TLT) TLT develops, owns and operates wind farms in Australia and New Zealand. It currently
has two sizeable projects (Dundonnell and Waverley) being developed. It also has
development options totalling around 2,700MW (with approvals) positioned for
eventual development. Furthermore, TLT has significant upside potential from the sell-
down of existing windfarms to third parties which are prepared to pay high prices and
accept low investment returns.
Jarden Securities Limited | NZX Firm | www.jarden.co.nz 19From: steve@jarden.co.nz To: tom@danefamilytrust.com ------ Subject: Date: Today at 1:57PM ------ plenty of noise in the market recently about it which you may well this morning post Monday’s result. Given clearer dividend guidance, our analyst has retained a ‘Neutral’ developments closely. This is what true wealth management looks like. Available on application.
You can also read