Technical Report #64 Fire Effects 10 Years After the Anaktuvuk River Tundra Fires Randi R. Jandt Eric A. Miller Benjamin M. Jones
←
→
Page content transcription
If your browser does not render page correctly, please read the page content below
U.S. Department of the Interior
          Bureau of Land Management

Technical Report #64
Fire Effects 10 Years After the Anaktuvuk River Tundra Fires

Randi R. Jandt
Eric A. Miller
Benjamin M. Jones
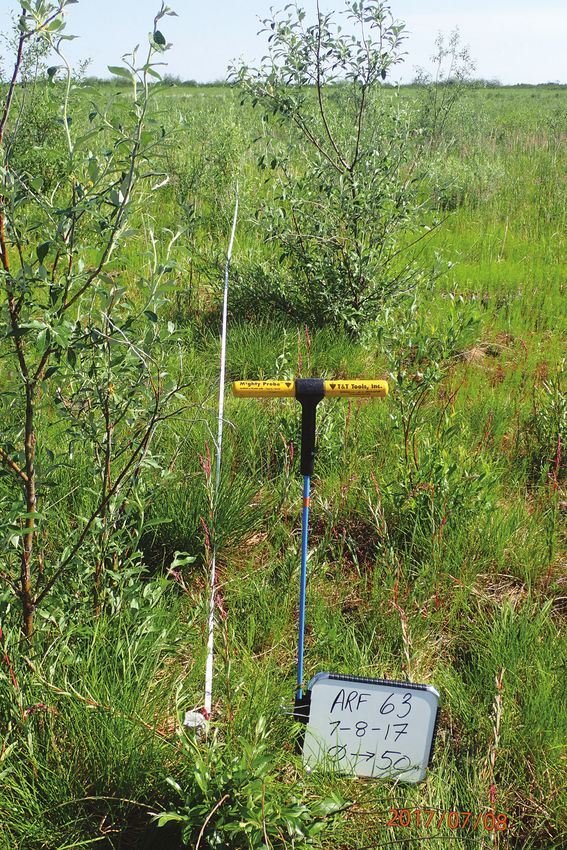
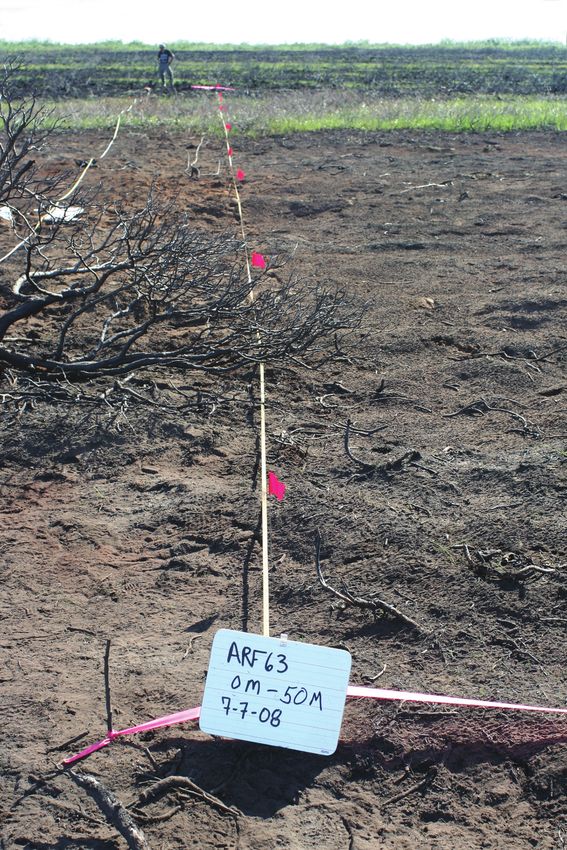
The BLM Mission
The Bureau of Land Management sustains the health, diversity, and productivity of the
public lands for the use and enjoyment of present and future generations.

Cover Photos
Background photo: Aerial photo of burn patterns from the 2007 North Slope Anaktuvuk River
Fire (7/6/2008)
Bottom inset photos: Plot photos of the same severely burned transect from 2008 and 2017,
respectively. R.R. Jandt / E.A. Miller (BLM)

Authors
Randi R. Jandt, International Arctic Research Center, University of Alaska Fairbanks

Eric A. Miller, BLM Alaska Fire Service

Benjamin M. Jones, Institute of Northern Engineering, University of Alaska Fairbanks

Disclaimer
The mention of trade names or commercial products in this report does not constitute
endorsement or recommendation for use by the Federal government.

Technical Reports
Technical Reports produced by BLM Alaska (and partners) present the results of research,
studies, investigations, literature searches, testing, or similar endeavors on a variety of
scientific and technical subjects. The results presented are final or are a summation and
analysis of data at an intermediate point in a long-term research project and have received
objective review by peers in the authors’ field.

To request copies of or information about this or other BLM Alaska scientific reports,
please contact:

BLM Alaska Public Information Center
222 West Seventh Avenue, #13, Anchorage, AK 99513
(907) 271-5960

Most BLM Alaska scientific reports are also available for loan or inspection at the Alaska
Resources Library and Information Services in Anchorage, (907) 27-ARLIS,
http://www.arlis.org and other major libraries in Alaska.

BLM/AK/ST-21/006+5710+9F00
BLM Alaska Technical Report 64

   Fire Effects 10 Years
After the Anaktuvuk River
        Tundra Fire

       Technical Report #64
            April 2021

                3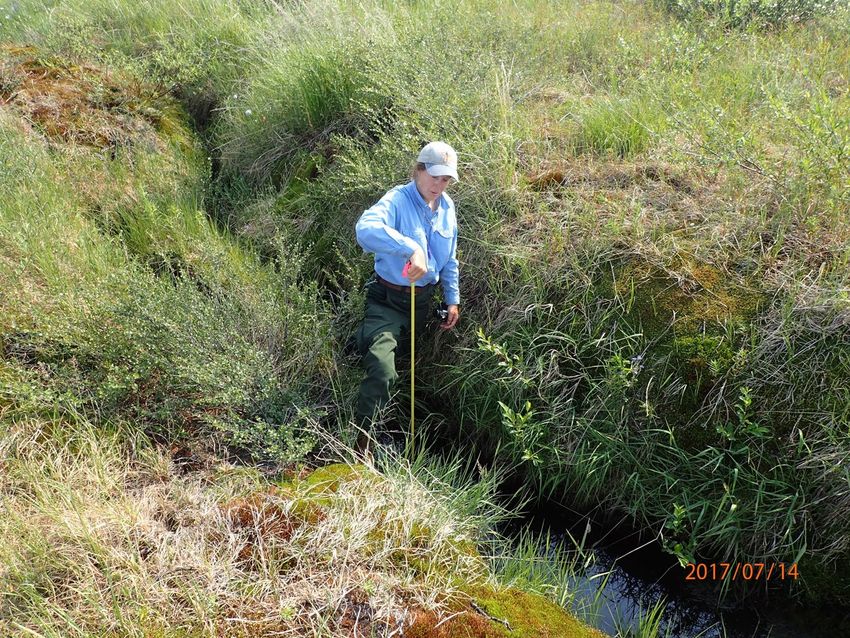
This page intentionally left blank.

                4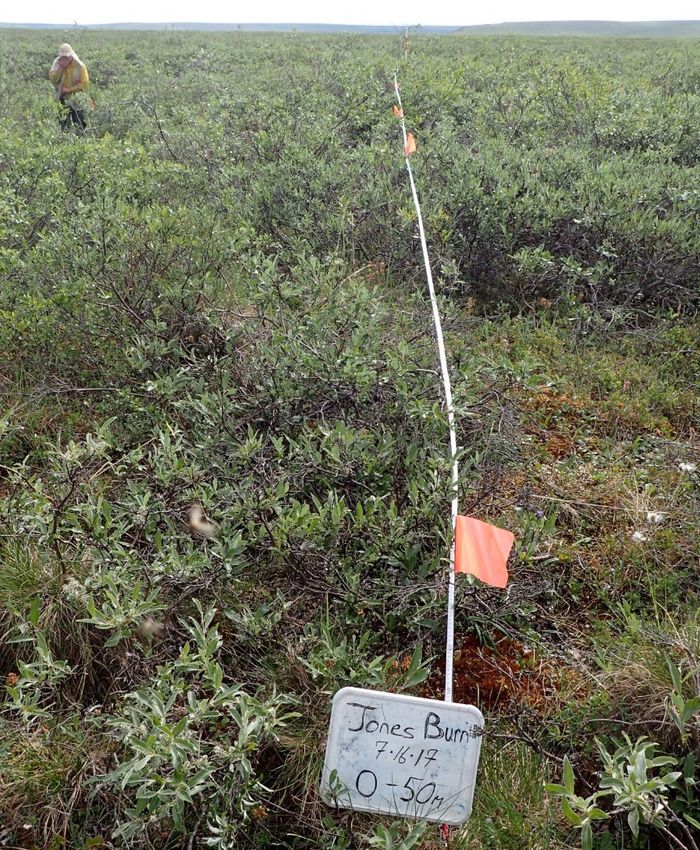
BLM Alaska Technical Report 64

                                                Table of Contents
   Table of Contents ................................................................................................................. i
   List of Figures .............................................................................................................................ii
   List of Tables ..............................................................................................................................ii
   Appendix A .................................................................................................................................ii
   List of Acronyms .......................................................................................................................iii
Abstract .............................................................................................................................. 1
Introduction ........................................................................................................................ 3
   Description of the Study Area ..................................................................................................8
      Physical Setting ..................................................................................................................................................8
      Climate .................................................................................................................................................................9
      Description of Previous Burn Severity Assessments ....................................................................................9
   Methods .....................................................................................................................................10
      Study Design .....................................................................................................................................................10
      Vegetation and Soils Measurements.............................................................................................................11
      Surface Subsidence .........................................................................................................................................12
   Results.......................................................................................................................................14
      Plant communities ............................................................................................................................................14
      Soil Characteristics, pH, Thaw Depth and Thermokarst ............................................................................20
      Observations on 2017 re-burn........................................................................................................................28
   Discussion ................................................................................................................................30
   Recommendations ...................................................................................................................36
   References ................................................................................................................................38
   Acknowledgements .................................................................................................................43
Appendix A ....................................................................................................................... 45

                                                                                      i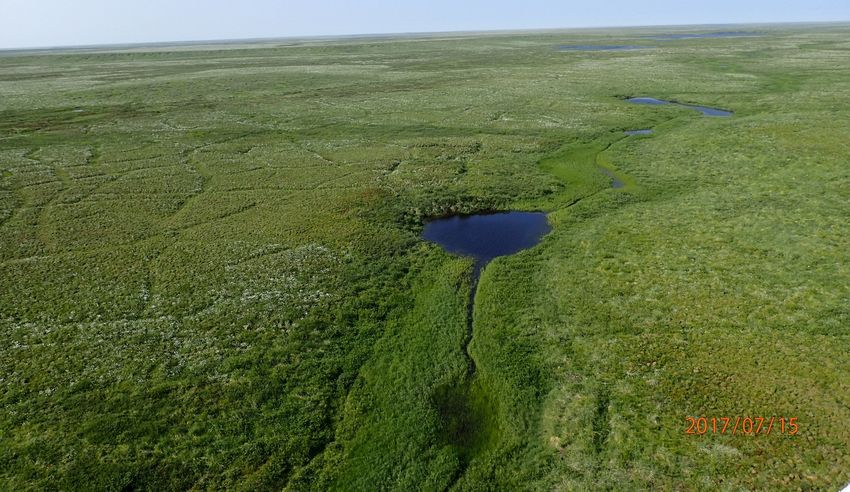
Fire Effects 10 Years After the Anaktuvuk River Tundra Fires

List of Figures
Figure 1. Location of Anaktuvuk River Fire and graph of North Slope annual burn area ............. 4
Figure 2. Map of study area fires and permanent transects .........................................................6
Figure 3. Burn severity map of Anaktuvuk River Fire ..................................................................7
Figure 4. Alder resprouting ten years post-fire, ARF T63 ...........................................................16
Figure 5. Cover and density of shrub willows from 2008 to 2017 ...............................................17
Figure 6. Mean annual vegetation cover (%) by lifeform on burned and unburned transects...... 18
Figure 7. Diversity of all plant species over time using Shannon’s diversity index ....................... 19
Figure 8. Well-developed thermokarst pond ten years after fire (BNAN) .................................. 23
Figure 9. Interannual and seasonal variation in 15 cm deep soil temperatures (⁰C)
           from 2010-2017 ........................................................................................................24
Figure 10. Scattergram of degree days above freezing from burned and reference
           datalogger sites ........................................................................................................24
Figure 11. Thaw slump headwall (NAN2) in 2011 and (below) 2017 .......................................... 25
Figure 12. 2017 aerial photo contrasts thermokarst on 2007 burned surface of ARF with unburned ..... 26
Figure 13. Subsidence and surface deformation due to permafrost thaw ................................. 27
Figure 14. Photos of Anaktuvuk River Fire repeat burn area and new 2017 transect ........... 28, 29
Figure 15. Red mineral layer above char observed at severely burned site .............................. 31
Figure 16. Ice wedge degradation created troughs > 1 m deep in some areas .............................. 34
Figure 17. Shiguvak Bluffs firescar (>69 years) had extensive tall willow cover in 2017 ........... 35

List of Tables
Table 1. Summary of site visits .................................................................................................13
Table 2. Map of study area fires and permanent transects ........................................................15
Table 3. pH data from tundra fire and reference transects sampled .........................................21
Table 4. Differenced active layer thaw depths (cm) on 2007 burned and
         reference transects (2008-2011). ................................................................................22

Appendix A
Table A-1. Permanent BLM transect locations and descriptions for
           Anaktuvuk River Fire study.....................................................................................45
Table A-2. Previously documented and new (BREB) burn severity measurements
           on Anaktuvuk River Fire study transects (Jandt et al. 2012) ...................................46

                                                                  ii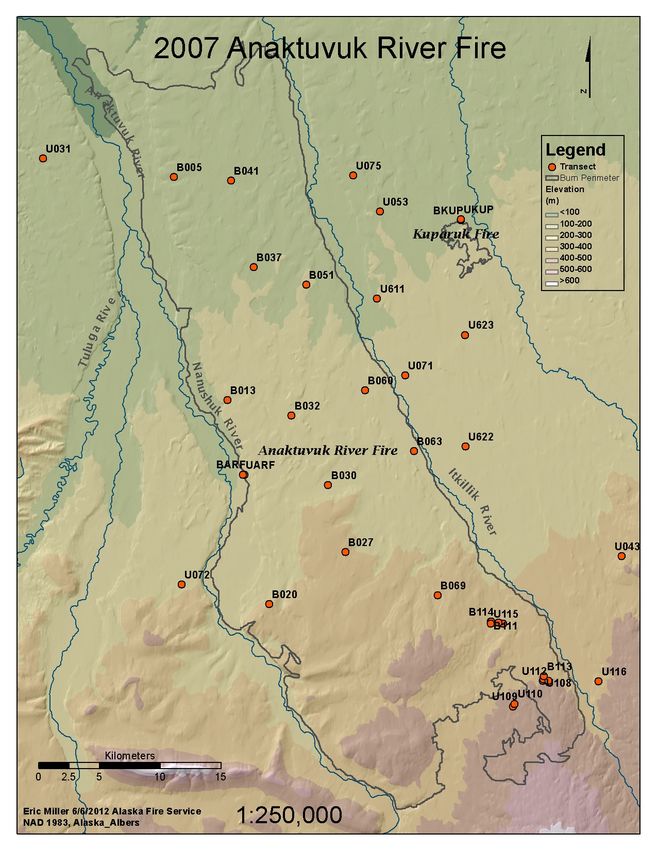
BLM Alaska Technical Report 64

List of Acronyms
AFS   BLM Alaska Fire Service
AICC Alaska Interagency Coordination Center
ARF   Anaktuvuk River Fire
ARLIS Alaska Resources Library and Information Services
BLM   Bureau of Land Management
DTM   Digital terrain models
LTER Long-Term Ecological Research
NRCS Natural Resources Conservation Service (USDA)
TR    Technical Report
UAF   University of Alaska-Fairbanks
USDA U.S. Department of Agriculture
USGS U.S. Geological Survey

                                            iii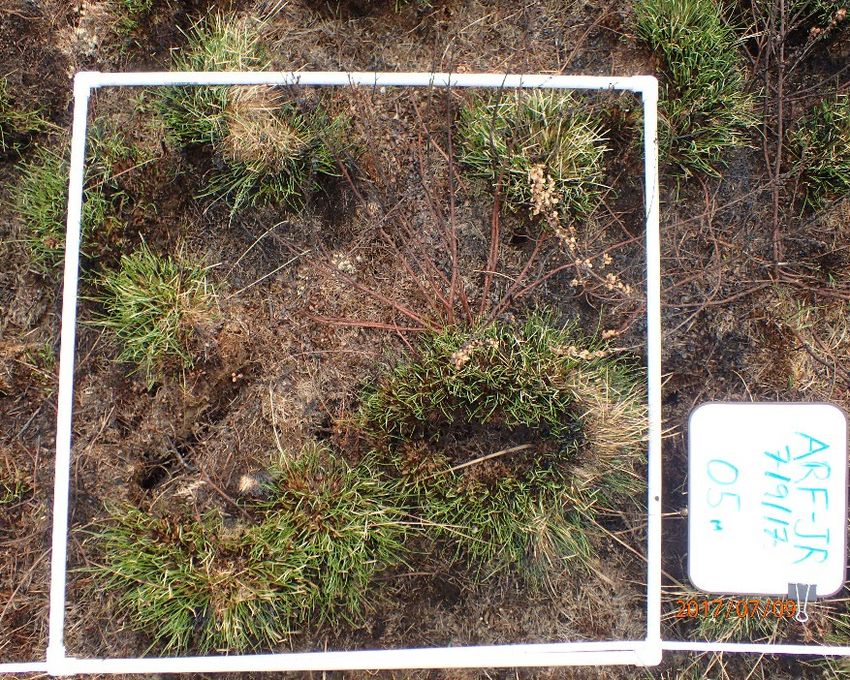
Fire Effects 10 Years After the Anaktuvuk River Tundra Fires

                                  This page left intentionally blank.

                                                   iv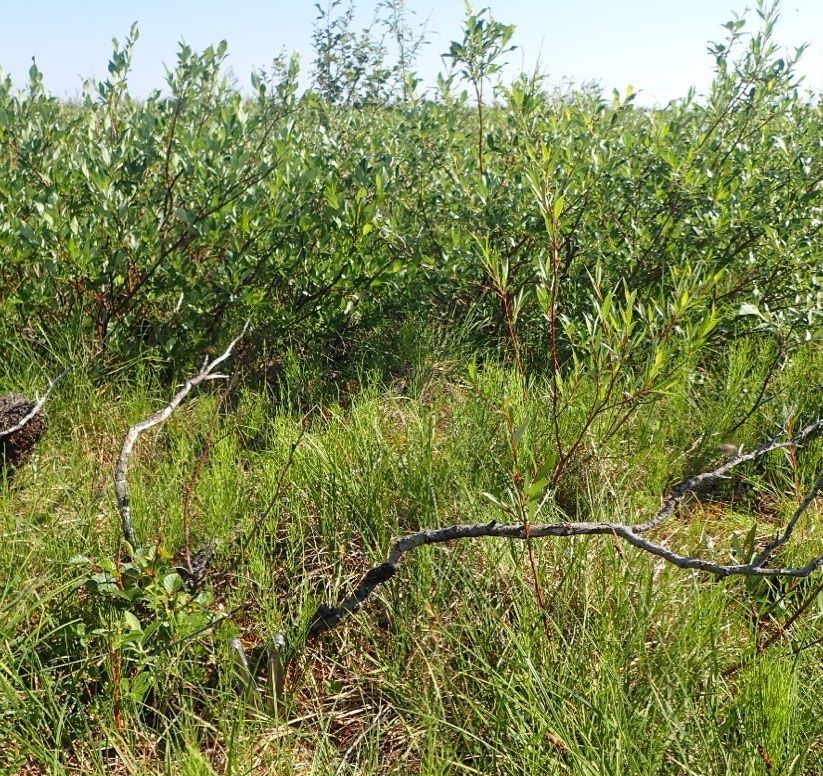
BLM Alaska Technical Report 64

                                    Abstract

Data on fire effects and vegetation recovery are important for assessing the impacts of
increasing temperatures and lightning on tundra fire regimes and the implications of
increased fire in the Arctic for wildlife and ecosystem processes. This report
summarizes information collected by the Bureau of Land Management (BLM), U.S.
Geological Survey, and University of Alaska Fairbanks, as well as other cooperators
between 2008 and 2017 on the effects of 2007 tundra fires on Alaska’s North Slope.

We monitored vegetation, soil properties, thaw depths, and collected repeat photos on a
set of 23 burned transects and 11 unburned reference transects periodically (N=5 visits)
between 2008 and 2017 on the Anaktuvuk River and adjacent Kuparuk River fires.
Post-fire regrowth of vegetation was rapid for some species such as cottongrass
(Eriophorum vaginatum) and expansive carpets of fire mosses and liverworts that
developed after the first year on severely burned areas. Relative to unburned tussocks,
tussocks that experienced burning inside the fire perimeter continue to grow and flower
more vigorously after ten years, suggesting a continued increase of soil nutrients,
competitional release, or a response to warming at root-level. Other species were
declining (Sphagnum mosses) or virtually absent (lichens) in the burned areas. Post-fire
accumulation of organic material over the first decade was about 5 cm of moss and
plant litter. This layer of recently cast fine fuel along with sedge leaf litter carried two
small lightning-ignited reburns in early-2017. Shrubs re-established more slowly than
herbaceous species: by the tenth year post-fire, cover of deciduous shrubs on burned
transects equaled reference transects but that of ericaceous subshrubs still lagged.
Species of tall willow appeared to be responding by increases in stature and
colonization of thermokarst-affected terrain. Other studies suggest that tundra north of
the Brooks Range is responding to climate change with widespread expansion of and
dominance by tall shrubs in the absence of fire. Our observations from this burn, as well
as at several other older burns, suggest that fire greatly accelerates this succession.
Shifts in community species composition seem likely for many years to come in the burn
area.

We documented burn severity and effects on permafrost, thaw depth, and surface
topography. Field-validated burn severity indices from satellite remote sensing showed
that 80% of the fire burned with moderate-to-high severity (Kolden and Rogan, 2013).
Thaw depth, pH, temperature, residual organic duff depth, and other soil characteristics
were recorded. Burned transects, especially those underlain by yedoma soils (ice-rich
Pleistocene permafrost deposits), exhibited substantial subsidence as a result of
thermokarst. At some transects, ground-ice melt created ice wedge troughs deeper than
1 m in the first ten years following the burn. Even low severity burn areas experienced
notable ground subsidence as evidenced by degrading ice wedges. Mean annual
ground temperature at 1 m depth has warmed 1.5°C relative to unburned tundra over
the ten years post-burn.

                                             1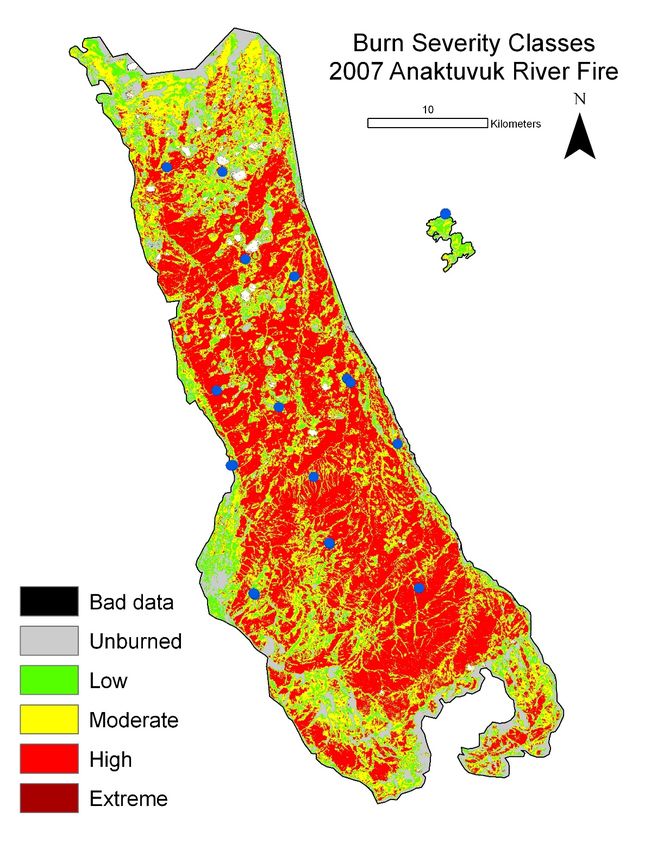
Fire Effects 10 Years After the Anaktuvuk River Tundra Fires

                                This page intentionally left blank.

                                                   2
BLM Alaska Technical Report 64
Introduction
Temperatures all over Alaska have been rising, especially in the Arctic (Serreze and
Barry 2011, Box et al. 2019). At Utqiaġvik (formerly known as Barrow), annual
temperature increased by 3.8 ⁰C (6.8 ⁰F) from 1949-2018, and autumn temperature by
over 4 ⁰C. The rate of climate warming is predicted to increase and warmer and drier
summers are strongly correlated with greater area burned in Alaska’s interior
(Veraverbeke et al. 2017). Historically, tundra fires on Alaska’s North Slope are rare
events (Barney and Comiskey, 1973). Only 71 fires north of the Brooks Range are
recorded in the fire history records kept by the Alaska Fire Service from 1968-2019
(Fig. 1.a). Detection of small and short-duration fires is difficult in this remote area: there
are few mapped perimeters. The total known area burned is 169,919 ha, with the
Anaktuvuk River Fire (ARF) accounting for 61% (Fig. 1. a, b) although disturbance
footprints discovered via remote sensing images have been discovered that pre-date
fire agency records.
Detection of small and short-duration fires is difficult in this remote area: perimeters are
available for just 131 of these fires, resulting in 845,000 acres (3,420 km²) burned over
that 70 years, with the ARF accounting for almost a third of that area. In the tundra
ecosystem, which covers nearly one-third of Alaska, wildfires are also predicted to
increase (French et al. 2015). With the advent of warmer summers and more open
water along the Arctic coast during autumn, large fires on the North Slope could
become more frequent (Hu et al. 2010). Vegetation, wildlife, and communities are
adapting to a new regime. Over 60 communities and about 350 native allotments are
located within this ecoregion, and as in any region, fire and land managers working with
tundra face decisions on fuels management, suppression tactics and pre-suppression
staffing. Empirical knowledge on the relationships between fire, climate and vegetation
from field studies like this one is important for assessing the impacts of increasing
temperatures on tundra fire regimes and the cascading effects this could have on
wildlife and ecosystem processes.
In the late summer and autumn of 2007, the ARF burned 256,000 acres (104,000 ha) of
arctic tundra north of the Brooks Range, doubling the recorded area burned in this
region over the past 50 years (Fig. 1.a and 1.b) (Jones et al. 2009). Although this fire
was four orders of magnitude larger than the median fire size in the historic record for
northern Alaska (24 ha; Miller et al. in preparation) another fire that ignited nearby in the
same mid-July lightning storm (Kuparuk Fire) attained only 1,800 acres (725 ha).
Indices of burn severity on ARF were substantially higher than for other recorded tundra
burns (Chen et al. 2020), while the Kuparuk Fire demonstrated typically low burn
severity, with minimal consumption of organic layers (Fig. 3).
3Fire Effects 10 Years After the Anaktuvuk River Tundra Fires
Figures 1.a. and b. a. Map shows location of Anaktuvuk River Fire on Alaska’s North Slope
with other known fires (dots for all recorded fires, only larger fires show perimeters); right inset
shows ARF, Kuparuk 2007 fires (previously undocumented fires in map are from Jones et al.
2013.) and b. Line graph shows annual areas burned since 1968 north of the Brooks Range,
Alaska, from records maintained at the Alaska Interagency Coordination Center
(https://fire.ak.blm.gov/incinfo/aklgfire.php, accessed April 2020).
4BLM Alaska Technical Report 64
An interdisciplinary team assessed fire effects including burn severity, potential plant
community shifts, and effects on permafrost and active layers between 2008 and 2017.
Observers monumented, photographed, and measured 24 burned and 17 unburned
reference transects for four years, starting the year after the fire. The initial years’
observations are summarized in an unpublished but public report (Jandt et al. 2012).
The Arctic Long-Term Ecological Research (LTER) group established 16 transects in an
intensive watershed study area on the fire (Fig. 2). Studies by other investigators
examined gas exchange over the burn area, thermokarst features, and watershed
effects. Peer-reviewed journals have published a number of studies by cooperators
(Jones et al., 2009; Jones et al. 2013; Jones et al. 2015; Liu et al. 2014; Iwahana et al.
2016; Bret-Harte et al. 2013, Rocha and Shaver, 2011, Mack et al. 2011, Boelman et al.
2011).
In 2017, we re-surveyed the two burns, examining mid-term vegetation recovery and
other fire effects on a subset of 14 burned and 11 unburned reference transects
spanning the range of vegetation types and burn severities. Since the 2017 field work
was only able to monitor the BLM’s transects, this report details the results from those
25 transects (Fig 2). We also collected survey-grade GPS locations for each of the
benchmarks visited. In 2017, we found new opportunities to expand our understanding
of fire’s ecological effects on this arctic ecosystem by establishing a permanent transect
opportunistically on one of two 2017 re-burns discovered within the 2007 fire perimeter
and a pair of transects on the pre-1948 Shivugak Bluffs fire to the northwest of ARF
(Miller et al. in preparation).
5Fire Effects 10 Years After the Anaktuvuk River Tundra Fires
UAF Arctic
LTER
permanent
Figure 2. Map of study area fires and permanent transects
(Arctic LTER plots were not included in the 2017 re-survey).
6BLM Alaska Technical Report 64
Figure 3. Burn severity map of Anaktuvuk River Fire with blue dots indicating the
location of the BLM’s permanent plots. (Figure by Crystal Kolden, USGS)
7Fire Effects 10 Years After the Anaktuvuk River Tundra Fires
Description of the Study Area
Physical Setting
The ARF burn area extends from the glaciated portion of the Brooks Range Foothills 67
km (40 miles) north, ultimately transiting through the loess belt, or the eolian silt belt that
was deposited during the last glacial period and consists of extremely ice-rich
permafrost deposits known as Yedoma. Coordinates of the fire start location are
69.047° N and 150.837° W. Elevations range from 500 m in the south to 100 m in the
north (Fig. 2). The burned area was confined by gravelly meandering floodplains of the
Itkilik River to the east and the Anaktuvuk and Nanushuk rivers to the west. This area
lies within the Brooks Foothills ecoregion of the North Slope (Muller, et al. 2018), where
the ecosystem is described as upland, shrubby tussock tundra, with gently sloping
uplands and ridges in loess and colluvium (Jorgenson and Heiner, 2008). Prior to the
fire, 54% of the burn area was classified as upland moist acidic tundra (soil pH 5.5), and 30% as shrubland (Auerbach 1997).
We used Viereck et al.’s (1992) vegetation classification to describe reconstructed pre-
burn plant communities, based on remnants, unburned islands and observations from
reference transects. The most prevalent plant community–represented by 80% of
burned transects–was open low mixed shrub-sedge tussock tundra, having > 25%
shrub cover by definition, and shrubs mainly dwarf or subshrub species. Remaining
burned transects were wet sedge meadows or sedge tussock tundra. Appendix Table
A-1 lists location data and Viereck classifications for each transect.
Vegetation is dominated by the tussock-forming sedges cottongrass (Eriophorum
vaginatum) and Bigelow’s sedge (Carex bigelowii). Wet depressions and meadows
have water sedge (C. aquatilis) and the rhizomatous aquatic grass (Dupontia fisheri).
The dominant shrub types included willow (Salix pulchra, S. fuscescens, S. glauca, S.
phlebophylla), dwarf birch (Betula nana), Labrador tea (Ledum palustre), blueberry
(Vaccinium uliginosum), and prostrate shrubs lowbush cranberry (V. vitis-idaea),
bearberry (Arctostaphylos alpina), and crowberry (Empetrum nigrum). Grasses other
than tussock-formers and forbs are typically scarce, except for the deciduous cloudberry
(Rubus chaemamorus), which we treat as a forb in this study after Viereck et al. (1992).
Other herbs include grasses (Arctagrostis latifolia) and (Poa arctica) and forbs
(Petasites frigida, Pedicularis sp., Polygonum bistorta, Arnica lessingii and Saussurea
angustifolium). Willow (Salix pulchra or S. glauca) was generally the tallest shrub
present, but alders (Alnus spp.) also burned along the rivers. Acidophilous mosses
(Sphagnum sp., Aulacomnium sp., Polytrichum spp. and Dicranum sp.), and the moss-
like liverwort (Lepidozia reptans) carpeted the surface between the tussocks. On
undisturbed reference areas, fruticose lichens also were found in relatively protected
hollows between tussocks, growing in clumps, and on some rises and ridges between
depressions. Plant nomenclature follows the USDA Natural Resources Conservation
Service Plants Database (http://plants.usda.gov).
8BLM Alaska Technical Report 64
Climate
The climate of the central North Slope is characterized by cold winters (-25°C/-13°F
mean high in January), relatively cool summers (20°C/68°F mean high in July), and
about 15 cm (5.9 in.) average annual precipitation near the coast and slightly more in
the foothills, although the local climate is undergoing rapid flux. Only three months, June
to August, typically have average temperatures above freezing and historically the area
had almost nine months of snow cover (Wendler et al. 2010). Average precipitation in
the summer months (June-September) averages just 11 cm. In the central North Slope,
the summer of 2007 was the driest of the 29-year record (1979–2007), with a four-
month precipitation total of just over 2 cm (Jones et al. 2009). Temperatures are rising
all across Alaska, but changes are largest over northern and western Alaska, where
snow and especially sea ice losses are impacting the regional climate. Annual air
temperature on the North Slope increased 3.2 ⁰C (5.8 ⁰F) between 1969 and 2018
(Thoman and Walsh, 2019).
Ice-rich permafrost is common in northern Alaska and is particularly prevalent in the
broad coastal plain region as well as the loess deposits and buried glacial deposits in
the foothills (Kanevskiy et al. 2016). The latter deposits typify the region burned by the
fire. Permafrost in the region is continuous, and the active layer (the layer of the soil
which thaws in summer and freezes in the winter), has a thickness of about 30 to 40 cm
in undisturbed locations (Wendler et al. 2010). Yedoma permafrost soils which primarily
formed during the Pleistocene and have generally been frozen >50,000 years are very
ice rich—often containing >80% ice content by volume with large syngenetic ice wedges
(Kanevskiy et al. 2016). Yedoma permafrost underlies the northern two-thirds of the
Anaktuvuk River fire. Recently, permafrost in northern Alaska and elsewhere in the
Arctic has been warming – even at depths of 9-20 m (30-65 ft). Monitoring sites along
the northern Dalton highway have warmed by 1.1-2.8 °C (2-5 °F) from the 1980s to
2018 (Romanovsky et al. 2017).
Description of Previous Burn Severity Assessments
In 2008, three independent ocular estimates of burn severity at varying scales were
made, two ground-based indices and one aerial index (Jandt et al. 2012). Remotely
sensed data and indices were compared to field ocular estimates as previously
documented (Jandt et al. 2012) and summarized in the Appendix (Table A-2).
Consumption of plant biomass and organic soils was estimated using direct
measurements of plants and soils in burned plots and allometric scaling developed from
unburned comparison plots (Mack et al. 2011). Pre- and post-fire Landsat imagery and
field data were used to prepare a burn severity map, which showed that 80% of the fire
burned with moderate-to-high severity (Fig. 3) (Jones et al. 2009). Initially, for areal burn
severity mapping, a post-fire image was acquired from Landsat 5 TM on June 14, 2008,
and a pre-fire image from Landsat 7 ETM+ on June 30, 1999. While the differenced
image dates are optimally closer in time, the North Slope is often cloudy and there were
no other clear dates during the growing season between 1999 and 2008. Burn severity
for the ARF was then mapped using the differenced Normalized Burn Ratio (dNBR)
method described in Key and Benson (2006) and validated with 19 modified Composite
9Fire Effects 10 Years After the Anaktuvuk River Tundra Fires
Burn Index (CBI) plots, modified for Alaska ecotypes (Jandt et al. 2012), surveyed in the
field during the summer of 2008 (Table A-2). CBI plots—a 30 m radius circular plot–are
the standard approach for developing thresholds of burn severity for remote sensing
data (Key and Benson 2006). An overall burn severity rating is derived from an average
of ratings for assessments in three fuel layers: substrate, low vegetation, and tall shrubs
based on pre-defined observational criteria. Complete methods and other tests
completed are described by Kolden (2010). One-year post-fire and extended
assessments and have been described elsewhere (Kolden and Rogan, 2013). In the
initial 2008 survey, burn severity in the 1 x 1 m quadrats (N=10/transect) was also
assessed for soil and vegetation along each burned transect using a scale of 1 (heavily
burned)-to-5 (unburned) according to the Alaska Interagency Fire Effects Task Group
protocol (2007).
Methods
Study Design
In 2008 (July 2-9), we established 16 permanent transects marked by aluminum stakes
with retaining wires to resist frost-jacking and evaluated burn severity, vegetation, fire
effects on soils and active layers. We re-surveyed these transects in 2009 (July 16-21),
2010 (July 15-25), 2011 (July 9-12) and 2017 (July). Site selection for the BLM
transects was based on a random grid of points generated onto a map, stratified by an
unpublished vegetation classification (Jorgensen and Heiner, 2003) and preliminary
burn severity classes from unsupervised remotely sensed mapping (D. Verbyla). In
2010, we established nine additional unburned reference transects in representative
plant communities outside the burn area, using physiographic parameters to select sites
similar to transects inside the burn. Our expectation was not to pair each burned
transect with an unburned transect, but rather to represent the same broad gradients in
physiography and geomorphology encountered on the burn transects. Partners with
Arctic LTER concurrently established and assessed ten burned and six unburned
comparison transects in an intensive study watershed in the south end of the burn (in
2008-2010) for a total of 24 burned and 17 unburned reference transects after the 2010
field season (Jandt et al. 2012). Team members were integrated between the BLM and
LTER field teams to standardize methods between partners on vegetative recovery
transects.
Locations were established using a hand-held GPS unit. All BLM transects run true east
(90°) for 50.1 m. Aluminum survey stakes with caps were pounded into the ground at
each end and a fiberglass measuring tape was stretched between them. The location
and elevation of each survey was updated in July 2017 using a survey-grade differential
GPS unit. Transects consist of two sub-transects running parallel to each other
separated by 2.5 m. The north sub-transect (2.5 m North of the survey stakes) was
used for destructive samplings (soil sampling etc.) and for measurement of the active
layer. Active layer depths were measured using a frost probe on the north sub-transect
starting at 2.5 m and subsequently 2.5-m intervals thereafter (N=20). The probe was
inserted into the soil down to ice or rock and the depth recorded. Insertions that hit rock
10BLM Alaska Technical Report 64
instead of ice were noted. The south sub-transect was used for estimation of vegetation.
No foot traffic occurred in a 1 m band south of the south sub-transect to prevent
trampling damage to the vegetation. The south sub-transect was imaged from each
end. The transect area was also photographed obliquely from a helicopter hovering at
approximately 20 m in the air. Slope, aspect, and elevation were recorded.
In 2017, we re-surveyed the two burns, examining mid-term vegetation recovery and
other fire effects on a subset of 14 burned and 11 unburned reference transects
spanning the range of vegetation types and burn severities. Since the 2017 field work
was only able to monitor the BLM’s transects, this report details the results from those
25 transects (Fig 3). In 2017, we also established a permanent transect opportunistically
on one of two 2017 re-burns discovered within the 2007 fire perimeter and a pair of
transects on the pre-1948 Shivugak Bluffs fire to the northwest of ARF. The latter is a
previously unrecorded presumed burn discovered by Jones et al. (2013) on a 1948
photograph and still visible in satellite imagery. As in previous years, we visited the most
active areas exhibiting thermokarst mass wasting along the Nanushek River on the
fire’s southwest flank including two photopoints established in 2009.
Vegetation and Soils Measurements
For vegetation cover estimates, observers measured cover of substrate or vegetation at
100 points along each transect using a point-sighting device. Percent cover was
calculated as the sum of all hits of a species along the 50-m transect, disregarding
multiple hits on the same species at one point. Transects were photographed from each
end in a landscape configuration. Additionally, in all years, ten 1 x 1 m photoplot
quadrats were framed along each transect, at 5-m intervals, and photographed from a
height of approximately 2 m. These were the same quadrats used for evaluation of
substrate and burn severity in 2008 (Jandt et al. 2012). Shrub species (willow and
alder), but not those classified as “subshrub” by the NRCS, were counted in ten 1 x 1 m
quadrats by three height classes: 1.5 m (although no shrubs
over 1.5 m were recorded).
The quadrats were placed south of the southern sub-transect with the lower right corner
placed at the meter mark at which a pin flag was placed. Although the plastic flags
themselves eventually disintegrated, it was generally possible to locate the wire so that
repeated placement of the quadrat was accurate. The first quadrat was placed at 1 m
and subsequent quadrats were placed at 5 m and every 5 m thereafter. The last quadrat
was placed at 45 m. We counted the shrubs as genets rather than ramets, that is,
clumps of stems originating at a single point were counted as one individual. Seedlings
were distinguished from established plants. In 2008, we distinguished resprouts from
mature stems. After 2008 this distinction became meaningless and all were classified as
mature.
These methods are admittedly subject to observer interpretation but are sufficient to
document gross changes in shrub density over time. Individual tussocks of Eriophorum
vaginatum and Carex bigelowii were also counted in the quadrats. Where more than
one tussock grew together, tussocks were distinguished based on their “cow licks”, or
11Fire Effects 10 Years After the Anaktuvuk River Tundra Fires
whorl of leaves above the tussock core. If they were only partially within the quadrat,
they were counted only if ≥ ½ of their area lay within the quadrat. Newly dead tussocks
and seedlings were noted. Shannon’s diversity index (Shannon and Weaver, 1949) was
used to estimate plant species diversity. Off-transect, additional species not intercepted
on the cover transect were noted.
Active layer, pH, temperature, residual organic duff depth and other soil characteristics
were recorded and in 2010, organic layers were destructively sampled for laboratory
analysis of fire fuel biomass and density of fuel layers. In early post-fire visits, soil cores
for pH and microbe analysis were taken and analyzed in the lab (Mack et al. 2011,
Hewitt et al. 2013). 2008 pH values were averaged using [H+] determined as 10^(-pH)
then converted back to pH as (LOG10[H+])*-1 (Mack et al. 2011). Values in 2017 were
determined in the field using a handheld pH meter, converted to acidity for averaging. In
2017, pH of organic and mineral (if available) horizons was estimated in the field with a
handheld pH meter, along with soil organic layer depth at 3 locations along the offset
transect.
Surface Subsidence
The opportunity to quantitatively assess the areal extent of fire-induced ground
subsidence in the burn came fortuitously in 2009, with a survey by the Alaska
Department of Transportation using an airplane-mounted lidar system evaluating the
ARF area for a proposed road. The 2009 lidar covered 650 km2 (62%) of the burn area.
A second lidar dataset was acquired in July 2014 to take advantage of the opportunity
provided by the 2009 lidar (Jones et al. 2015). These data overlapped 350 km2 of the
2009 dataset, with 310 km2 located within the burn perimeter and 40 km2 located outside
of the burn perimeter. Ground subsidence was opportunistically quantified where
independent and consecutive lidar datasets overlapped five transects (T41, T37, T51,
and T60A). Digital terrain models (DTMs) at 1 m spatial resolution were developed for
each acquisition and their difference found to produce differential digital terrain models
(dDTMs; Jones et al. 2015). In a GIS environment, we laid the survey-grade GPS
endpoint coordinates over the dDTM. We manually inferred the coordinate location of
the 100 vegetation sampling points spaced 50 cm apart along each transect. Values
from the dDTM were then extracted to each point and summarized for each transect.
Ground subsidence along the transect could then be graphically displayed and
summarized as an average for the entire transect. In time, this pairing of remotely
sensed elevation data within situ vegetation surveys may allow for the tracking of
vegetation responses to different ground subsidence patterns.
12BLM Alaska Technical Report 64
Table 1. Summary of Site Visits
Survey team
2007 Burn Reference Other Burn
Dates (Italics indicate observers for
Transects Transects Transects
UAF LTER transects)
July 2-9, 14 BLM 2 BLM -- Jandt, Yokel, Hollingsworth, Mack, Miller,
2008 10 LTER 6 LTER Ahgook, Bret-Harte, Jorgenson
July 16-21, 14 BLM 2 BLM -- Jandt, Yokel, Miller, C. Racine, M. Racine
2009 10 LTER 6 LTER
July 15- 25, 14 BLM 11 BLM -- Jandt, Yokel, Miller, McNulty
2010 10 LTER 6 LTER
July 9-12, 14 BLM 2 BLM -- Miller, Jandt, Yokel, McNulty
2011 10 LTER 6 LTER
July 8-16, 14 BLM 11 BLM 2017 Reburn: 1 Miller, Jandt, Jones, Baughman, Raevsky
2017 Shivugak Shivugak fire: 1
fire: 1
13Fire Effects 10 Years After the Anaktuvuk River Tundra Fires
Results
Plant communities
In the summer after the fire, we noted the consumption of feathermosses and
ericaceous shrubs was high throughout the ARF burned area (cover photos).
Frequently, almost all evidence of mosses (other than sphagnums) and dwarf shrubs
was obliterated, leaving just charred remnants of the roots and rhizomes in a few
centimeters of deeply charred lower duff. We encountered small resprouts of blueberry,
Labrador tea, cloudberry, and lowbush cranberry sometimes sprouting from a tussock
base where a piece of rhizome was protected. The burn continuity was also unusually
high, consuming riparian stringers and wet polygonated depressions (fens), which are
usually maintained as unburned inclusions.
Even so,11% of the area within the fire perimeter (excluding water features) did not
burn. These unburned islands and ‘fingers’ of unburned extending from the perimeter
into the interior of the fire tended to be in areas which burned earlier in the fire
progression (Jandt et al. 2012). Reconstructed pre-fire organic depth averaged 20.3 cm
(range 10.4-43.3 cm, N=20) whereas post-fire the mean residual organic depth was
15.7 cm (Mack et al. 2011). Residual organic layers on BLM plots ranged from 8.5 cm to
28 cm and were not always correlated with burn severity indices (Jandt et al. 2012;
Table 1). Much of this residual organic horizon was likely frozen and unavailable for
combustion during the fire.
On the ARF, more than 40% of transects demonstrated high severity corresponding to
>20% mineral soil exposure and/or >60% tussock basal area consumption (Jandt et al.
2012). Tussock bases, similar to the boles of live trees in forested areas, are virtually
never completely consumed in fires, so these observations, along with the 10% tussock
mortality estimates in the first three years post-fire are notable. The drought conditions
during September 2007 were coincident with record low Arctic Ocean pack ice adjacent
to the coast (Jones et al. 2009; Hu et al. 2010). The summers of 2008, 2009, 2010 and
2017 were also unusually warm from mid-June through July during our sampling trips.
We found that wet depressions inside and outside the burned area often dried out,
leaving mats of dying algae and exposed emergent vegetation (like Dupontia fischeri
grasses). Warmer summers spawn thunderstorms as well as dry out the grass and
sedge litter, mosses, and deciduous leaf litter, which produces better conditions for
tundra fire propagation and spread. Thunderstorms were observed regularly during our
brief stints of field work.
Regrowth of vegetation was rapid for some species (e.g., tussock cottongrass E.
vaginatum and colonizers like ruderal mosses also responded rapidly). Extensive mats
of fire mosses (e.g., Ceratodon purpureus, Pohlia nutans) and liverworts (Marchantia
polymorpha) developed after the first year on severely burned areas. The response of
tussock sedges was remarkable given the estimate of roughly 10% mortality on study
transects after the 2009 survey (range 0-40%). Tussock bases are almost never
completely consumed in fires, but in this case, many were deeply burned into a “pillar”
conformation. Graminoid cover, primarily E. vaginatum, increased from 6% to 60%
14BLM Alaska Technical Report 64
between 2008 and 2011 (Table 2). In 2017, graminoid cover was increased just 6%
since 2011 on burned transects (66%, N=14; Table 2), but tussocks had clearly
increased in height and diameter and were flowering more prolifically in burned
transects. New tussock seedlings were documented in burned inter-tussock hollows,
especially where mineral soil was exposed, in 2012 and 2017.
Table 2. Absolute cover of major vegetation components over time on 2007 burned plots
(excluding substrate hits, of moss for example).
Burned Ref.
Cover % N=14 N=2 N=2 N=11 N=11
2008 2009 2010 2011 2017 2008 2009 2010 2017
FORB 0.71 6.29 7.29 10.07 12.43 2.00 6.50 4.82 5.64
Artemisia tilesii 0.00 0.00 0.07 0.21 0.50 0 0 0 0
Equisetum spp. 0.00 0.93 0.93 1.29 2.29 0 0 0.45 0.09
Chamerion angustifolium 0.00 0.07 0.07 0.43 1.43 0 0 0 0
Pedicularis spp. 0.00 0.07 0.14 0 0.29 0 0 0.18 1.09
Petasites frigidum 0.07 0.43 0.57 0.86 1.57 0 2.00 0.27 0.55
Rubus chamaemorus 0.57 3.86 4.00 4.71 4.71 2.00 3.50 2.91 2.09
Saussurea angustifolia 0.00 0.29 0.07 0.14 0.36 0 0 0.18 0.27
OTHER FORB 0.07 0.64 1.43 2.43 1.29 0 1.00 0.82 1.55
GRAMINOID 6.43 39.36 45.07 59.57 66.36 47.50 57.50 50.00 48.27
Arctagrostis latifolia 0.07 0.86 1.29 1.86 5.93 0 2.50 0 0.09
Carex aquatilis 1.00 4.29 3.79 5.07 3.64 0 0 1.45 2.27
Carex bigelowii 1.50 4.00 4.07 7.71 7.86 10.00 10.00 10.27 8.91
Calamagrostis spp. 0.00 4.29 6.21 9.14 4.07 0 1.00 0 0
Eriophorum vaginatum 3.64 20.14 22.21 27.71 32.79 37.50 43.50 30.18 30.00
OTHER GRASS 0.00 1.64 2.21 2.00 4.57 0 0 1.18 0.27
OTHER SEDGE 0.21 4.14 5.29 15.21 7.50 0.00 0.50 6.91 6.73
SHD & SSD 6.00 13.21 14.93 17.07 22.29 14.00 24.00 31.18 28.18
Arctostaphylos spp. 0.00 0.07 0.14 0.29 0.14 0 0 0.55 0.55
Betula nana 2.71 5.64 5.86 7.93 10.50 8.00 16 17.73 15.18
Comarum palustre 0.00 0.21 0.21 0.21 0.21 0 0 0.09 0.18
Dwarf Salix spp. 0.00 0.00 0.00 0.00 0.00 0 0.5 0.64 0.55
Salix fuscescens 0.07 0.57 0.5 0.93 1.21 0 0 0.55 0.18
Salix pulcra 2.43 5.86 6.64 5.57 6.93 5.50 5.50 5.18 4.82
“Tall” Salix spp.* 0.07 0 0.14 0.36 1.43 0 0 1.73 1.64
Spirea stevenii 0.00 0.00 0.07 0.07 0.07 0 0 0 0
Vaccinium uliginosum 0.64 0.86 1.36 1.71 1.79 0.50 2.00 4.73 5.09
OTHER DEC. SHRUB 0.07 0.00 0.00 0 0 0 0.00 0.00 0
SSE 2.21 7.29 7.64 9.57 17.93 33.50 69.00 40.18 42.45
Andromeda polifolia 0.36 0.50 0.57 0.93 2.00 0 2.50 2.82 2.73
Cassiope tetragona 0.29 0 0.07 0 0 0.50 1 4.82 4.09
Dryas integrifolia 0.00 0.00 0.00 0.00 0.00 0 0 0.91 1.27
15Fire Effects 10 Years After the Anaktuvuk River Tundra Fires
Burned Ref.
Cover % N=14 N=2 N=2 N=11 N=11
2008 2009 2010 2011 2017 2008 2009 2010 2017
Empetrum nigrum 0.00 0.00 0.00 0.00 0.00 3.00 6 1.36 1.45
Ledum palustre 1.00 4.36 4.07 5.43 10.64 16.00 20.50 14.09 14.45
Vaccinium vitis-idaea 0.50 2.43 2.93 3.07 5.21 14.00 38.50 15.91 18.18
OTHER ERIC. SHRUB 0.07 0.00 0 0.14 0.07 0 0.5 0.27 0.27
LICHEN 0.21 0.29 0.43 0.14 0.57 4.00 8.00 8.82 8.64
FOLIOSE 0.14 0.07 0.29 0 0 3.00 4.50 6.09 5.73
NON-FOLIOSE 0.07 0.14 0.07 0.14 0.57 1.00 3.50 2.55 2.91
LIVERWORT 0.21 10.36 9.57 6.57 0.50 0 1.50 1.09 1.64
MOSS 15.00 34.21 25.50 26.93 19.36 16.50 46.50 34.18 43.64
Ceratodon purpureus 0.29 1.57 5.50 5.36 2.14 0 0.5 0 0
Polytrichum spp. 0.07 1.57 3.14 2.86 5.29 0 1.50 0.73 1.00
OTHER MOSS 11.86 10.93 11.14 12.64 8.29 15.50 12.50 22.27 27.00
SPHAGNUM 2.79 20.14 5.71 6.07 3.64 1.00 32.00 11.18 15.64
*”Tall” Salix here refers to forms generally > 1m tall when mature such as S. glauca, S. alaxsensis, etc.
Ericaceous shrub cover increased
from 2 to 8% on burned transects
in the first four years, compared to
40% cover on reference transects
(N=11; 2010). After ten years,
cover of ericaceous shrub,
especially Labrador tea (L.
palustre), on the BLM subset of 14
burned plots, had nearly doubled
(18% in 2017), but had not reached
reference transect levels (42%,
N=11; Fig. 6). Deciduous shrubs
(including Salix spp., Betula nana,
Arctostaphylos, Vaccinium
uliginosum, etc.) and subshrubs
averaged about 22% cover after
ten years, close to the reference
transect value of 28% (Table 2;
Fig. 6). Subshrub species of
Figure 4. Alder resprouting ten years post-fire,
prostrate willow and purple
ARF T63, July 8, 2017 (R. Jandt). marshlocks (Comarum palustre)
generally comprised less than 1% of
the deciduous shrub cover. S.
fuscescens and S. pulchra accounted for most of the shrub-statured (here defined as
generally between 0.1-1 m at maturity) willow we tallied on quadrats along the transects
and at least the stem density of these species, if not cover, still appeared to be
increasing after ten years (Fig. 5.a. and b.). Expansion of shrub-statured willow
16BLM Alaska Technical Report 64
recruitment was quite obvious on repeat photopoints and photoplots (Cover photo).
Cover of “tall” shrub species (generally > 1 m) which was negligible on initial post-fire
surveys seemed to be still increasing—from 0% in 2008 to just 0.4% in four years and
then 1.4% in 2017 (reference transects 1.6%). Species tallied included Salix
richardsonii, S. glauca, S. alaxensis, S. interior and also Spirea stevenii. Surprisingly,
some of the burned alder previously thought dead were just beginning to resprout after
ten years (Fig 4). Still, alder was rare in our survey areas. Subshrubs, Cassiope
tetragona and Dryas sp., were found on half of unburned reference transects (UKUP,
U031, U043, U053, U071 U623) but just a single burned plot in the ten years after fire
(B005). It is uncertain whether these species, which prefer a less acidic soil substrate,
were underrepresented in our burned transects due to more acidic soil types or slow
regeneration post-fire.
Cover of shrub willow
Density
Densityofofshrub
shrubwillow
ill
Figures 5.a and 5 b. a. Cover (top) and b. density (bottom) of shrub willows from
2008 to 2017 on individual burned and reference transects (+) with trend line.
Primary species tallied on quadrats were S. pulchra and S. fuscescens;
prostrate willows were excluded.
17Fire Effects 10 Years After the Anaktuvuk River Tundra Fires
60 75
2008 2009 2010
2011 2017 r2010
50 r2017
40 50
30
20 25
10
0 0
Figure 6. Mean annual vegetation cover (%) by lifeform on burned (bars) and unburned
reference (“r” points) transects over the years of study. Graminoid vegetation is divided into
grasses and sedges. Shrubs are grouped into deciduous (D) or ericaceous (E). Reference plot
data for 2008-2009 omitted due to small sample size (see Table 2).
The abundance of perennial grasses, and forbs like cloudberry (R. chaemomorus) and
horsetail (Equisetum sp.) increased notably over the first four years. True grasses—
largely Calamagrostis and Arctagrostis sp.––increased from 0.1% to 13%, forbs from
0.7% to 10.1% (Fig. 6). Ten years post-fire cover of true grasses was 14.6% on burned,
0.3% on reference transects, and appeared to still be spreading. Forbs had also
increased in number and diversity by 2017 and comprised 12.4% of cover on burned
transects, or twice the forb cover seen on reference transects (6%, N=11). Fireweed
(Chamerion angustifolium) was rare in 2008, and we recorded no hits on reference
transects but increased patch-wise in burned transects through 2011, apparently
spreading rhizomatously. It appeared to still be increasing after ten years and
comprised 1.4% cover by 2017.
Bryophyte communities exhibited some of the most striking and dynamic changes over
the study period. Two years post-fire large mats of “copper wire moss” Pohlia nutans,
“fire moss” Ceratadon purpureus, and the liverwort Marchantia polymorpha had
established. Combined, cover of these three averaged about 1% in 2008, while the burn
18BLM Alaska Technical Report 64 area was still very dry (before summer rains). They increased to 11% in 2009 and 16% in 2010 (Table 2). Some of these bryophytes seemed to be trending downward by 2011 (M. polymorpha in particular) and being replaced by other successional mosses like Polytrichum sp. and Aulacomnium (Jandt et al. 2012). Moss mats appeared to hold the ashed fine soils, which would help mitigate wind and water erosion. Mosses also appeared to be keeping at least some moisture in burned areas, which overall seemed to be drier than normal. After ten years, “fire mosses” comprised
Fire Effects 10 Years After the Anaktuvuk River Tundra Fires

Soil Characteristics, pH, Thaw Depth and Thermokarst
Residual organic soil depth following the burn averaged 16.6 cm. By 2017, mean depth
was 20.8, indicating 4.2 cm of litter and duff have reaccumulated in nine years or about
0.47 cm/year. Mineral soil core pH values in 2008 ranged from 3.9 to 5.2 overall
(N=23) while organic duff pH samples (5-10 cm depth) from the 35 transects sampled
in 2010 ranged from 4.2 to 6.4—slightly more alkaline, although depth in the soil core
is likely to influence pH due to higher mineral content of the parent material. Table 3
compares the set of transects sampled in both 2008-2010 and 2017. Median pH on the
BLM’s 14 burned transects was 4.6 for mineral soil pH in 2008 and 5.4 for both burned/
unburned transects in 2017 (N=12, 8). Median organic soil pH was 5.3 for burned
(N=11) and 4.9 for unburned (N=9) transects in 2010. In 2017, organic soils measured
median pH 5.4 (N=14) for burned transects and 5.0 (N=8) for unburned transects.
Previously reported pH from unburned mesic tussock tundra in the Arctic Foothills
averaged 4.6 ± 0.1 (Walker et al. 1994). It is possible that burning made soils less
acidic, but variability between sampling sites was too high for statistical significance.
On individual transects, we noted that near surface layers on individual transects with
much consumption (and ash residues) had a relatively high near-surface organic mat
—such as at T063—where the 2017 near-surface pH was 7.1, but decreased to 5.5 as
one reached deeper, uncombusted layers.

                                                  20
BLM Alaska Technical Report 64
Table 3. pH data from tundra fire and reference transects sampled in 2008 (mineral)/2010 (organic)
and 2017. 2008 values were measured in lab using soil cores (Mack, et al. 2011).
pH values in 2010 and 2017 were determined in the field using a handheld pH meter.
2010 2008 2017
Organic 2017 Mineral Mineral
Transect Plot pH Organic pH pH Site
Name Type (mean) pH (mean) (mean) (mean) Class
B005 Burned 5.53 5.33 4.70 5.62 --
B013 Burned 5.34 5.21 4.49 5.33 --
B020 Burned 5.07 5.20 4.18 5.17 --
B027 Burned -- 5.42 4.43 frozen --
B030 Burned 4.40 4.53 4.49 5.05 --
B032 Burned -- 5.58 5.23 frozen --
B037 Burned 5.17 5.40 4.97 5.46 --
B041 Burned 4.42 4.45 4.66 6.16 --
B051 Burned 5.54 5.83 4.69 6.05 --
B060 Burned 5.70 5.77 4.93 5.50 --
B063 Burned 5.55 6.47 4.47 5.20 --
B069 Burned 4.58 4.36 3.86 4.78 --
B101 Burned 4.51 -- 4.58 -- --
B102 Burned 5.07 -- 4.89 -- --
B103 Burned 4.69 -- -- -- --
B104 Burned 4.85 -- 4.74 -- --
B105 Burned 4.90 -- 5.15 -- --
B106 Burned 4.59 -- 4.62 -- --
B107 Burned 4.51 -- 4.03 -- --
B111 Burned 4.36 -- -- -- --
B113 Burned 4.31 -- -- -- --
B114 Burned 4.46 -- -- -- --
BKUP Burned 5.48 5.67 4.67 5.59 --
BNAN Burned -- 5.26 4.62 4.90 --
BREB Burned, 2X -- 4.55 -- 4.62 --
U031 Unburned 4.66 5.06 -- 5.57 --
U043 Unburned 4.70 4.48 -- 5.36 --
U053 Unburned 5.07 5.22 -- frozen --
U071 Unburned 6.45 6.78 -- 7.04 --
U072 Unburned -- -- -- 5.22 --
U075 Unburned 5.17 6.03 -- -- --
U108 Unburned 4.37 -- 4.92 -- --
U109 Unburned 4.41 -- -- -- --
U110 Unburned 4.21 -- -- -- --
U112 Unburned 5.25 -- -- -- --
21Fire Effects 10 Years After the Anaktuvuk River Tundra Fires
2010 2008 2017
Organic 2017 Mineral Mineral
Transect Plot pH Organic pH pH Site
Name Type (mean) pH (mean) (mean) (mean) Class
U115 Unburned 5.65 -- -- -- --
U116 Unburned 4.42 -- -- -- --
U611 Unburned 5.26 -- -- -- --
U622 Unburned 4.89 4.60 -- frozen --
U623 Unburned 4.50 -- 4.52 --
UKUP Unburned 4.85 4.95 4.44 5.76 --
UNAN Unburned 4.07 4.78 5.50 --
Differences in active layer thaw were much reduced from early post-fire surveys. Mean
thaw depths of burned transects exceeded that of the unburned transects by almost ten
cm in 2011 and by 2017 the difference of 5 cm narrowly missed statistical significance
(Table 4). Thaw depth was somewhat correlated with increased severity in early years
post-fire but not significantly (Jandt et al. 2012). Thaw depth is strongly influenced by
sample date range between 2008 and 2017.
Table 4. Differenced active layer thaw depths (cm) on 2007 burned
and reference transects (2008-2011).
THAW THAW REF
Sample DEPTH BURN BURN REF Difference
YEAR DEPTH Std
Date BURN N Std E N BURN-REF
REF (cm) E
(cm)
2008 7/2-7/9 -39.5 24 7.8 -29.7 2 -- 9.8
2009 7/16-7/21 -47.4 24 5.6 -34.0 2 -- 13.4
2010 7/15-7/25 -44.0 24 7.1 -26.5 11 7.7 17.5
2011 7/9-7/12 -42.3 24 10.8 -23.1 11 5.8 19.2
2017 7/8-7/16 -27.1 14 5.7 -22.0 11 5.5 5.1
The bulk density of organic layers in the ARF from 2008 samples ranged from
0.07 g/cm3 (±0.01, N=20) in the 0-5 cm layer, which would be mostly moss, litter, and
surface vegetation, to 0.15 g/cm3 (±0.02, N=4) in the 15-20 cm layer, which would be
compacted duff (Mack et al. 2011). Bulk densities are regionally specific because they
are strongly influenced by mineral content in the layers, which can be influenced by
factors like wind, glacial dust, flooding, and cryoturbation.
22BLM Alaska Technical Report 64
On a larger scale, the
degradation of permafrost was
widespread in 2017, even in
areas where burn severity was
light, such as the Kuparuk Fire.
Degradation is especially
prominent in yedoma soils, less
so on glaciated uplands and
fluvial soils. We observed
ground subsidence >1 m in
cases, often in troughs between
polygons, primarily associated
with the melting of ice wedges,
which in some cases led to
ponding of water (Fig. 8). In
contrast, ice wedge polygonal
centers appeared to be become Figure 8. Well-developed thermokarst pond
drier in several burned transect 10 years after fire (BNAN).
neighborhoods, with less
standing surface water and
relay succession from hydrophilous and emergent species to more mesic plant species.
For example, Carex aquatilis at B041 lacked vitality and appeared to be senescent,
being overtaken by Salix fuscescens. Drying peat and Sphagnum mounds resembled
char. Shrubs had invaded previously wet areas in many places. For example, Transect
B032 was a wet sedgy marsh, but by 2017 shrubs (L. palustre and B. nana) were filling
in spaces between tussocks, with little evidence of marshy ground. Observations here
and at older burns suggests the tundra initially becomes wetter, then drier, as water
drains through degrading ice wedge troughs (Liljedahl et al. 2016, Chen et al. 2020).
We saw evidence of substantial overland flow of water at some transects and
speculated that this may be a factor of a higher snowpack due to taller vegetation
trapping windblown snow in the winter, as well as more snow accumulation occurring in
degrading ice wedge troughs because of wind redistribution. However, a shallower duff
layer—diminished by consumption—might also reduce the overall water storage
capacity of the organic layer. Collectively, these factors might lead to significant spring
flooding.
Soil temperatures, measured by two datalogger probes located in representative
locations inside and outside the burn perimeter, showed that organic soil temperatures
(at 15 cm depth) in the burn continue to average 1.5⁰ C warmer than reference site,
even after the recovery of vegetation. Maximum temperatures in the soil organic layer
were consistently warmer in the burn (as much as 6°C in summer; 1.7°C annually) from
2010-2017 compared to a reference station (Fig. 9). The growing season (above 0°C)
was about 13 days longer in the 10-year-old burn scar. Thawing degree days were 2.7
times greater at the burn datalogger station compared to the reference (Fig. 10).
23Fire Effects 10 Years After the Anaktuvuk River Tundra Fires
Figure 9. Interannual and seasonal variation in 15 cm deep soil temperatures (⁰C)
from 2010-2017 at representative stations in burned and reference areas.
Dotted lines represent overall mean soil temperature between 2010 and 2017
Figure 10. Scattergram of degree days above freezing by Julian date based on soil temperature
data (15 cm depth) from burned and reference datalogger sites from 2010-2017.
24BLM Alaska Technical Report 64
Along the Nanushek River
(southwest perimeter of
the fire) the retrogressive
thaw slumps documented
from 2009-2011 appeared
to be stabilizing.
Photopoint site NAN2
contained an exposed 3-m
tall ice wedge and an
erosional gully/silt flow
about 30 m wide and 100
m long in 2009, which
widened to more than 70
m the next year. By 2011,
a large silt pile (2 m tall)
had accumulated at the
toe of the slump. The
crater had almost joined
the neighboring slump to
the south, with just a
narrow ribbon of
undisturbed ground
separating them. Prior
year silt flows were
starting to revegetate with
mosses, Equisetum sp.
and grasses. By 2017
these slumps had
revegetated, and the old
headwalls had eroded to
sloped hills (Fig. 11) but Figure 11.a. and b. a. Thaw slump headwall (NAN2)
there were still numerous in 2011 and b. same area in 2017.
large cracks and rivulets
of water draining from the thaw slump, indicating that permafrost degradation might still
be occurring but at a much slower rate. Photopoint locations had been covered or
obscured by mass wasting flows. Large willows were abundant in the thaw slumps and
we saw evidence of moose and bear activity.
Jones et al. (2015) provided compelling evidence of widespread surface subsidence
and increased surface roughness over much of the eastern and northern half of the
ARF burn area. These changes could also be easily appreciated on the ground and
from aerial platforms (Fig. 12). Using lidar data from 2009 and 2014 along with survey-
grade GPS coordinates and a digital terrain model, we were able to construct 2-D
subsidence profiles for several study transects (Fig. 13). The profiles show variable
surface subsidence exceeding 1 m in depth in places, particularly in severely burned
transects that were underlain by yedoma soils (Fig. 13: B037). Transects underlain by
25Fire Effects 10 Years After the Anaktuvuk River Tundra Fires
river cobble showed negligible subsidence (Fig. 13: B063). The digital terrain model was
not available for all glaciated soil areas in the southern part of the burn but thermokarst
was observed to be less developed there.
Figure 12. 2017 aerial photo contrasts thermokarst on 2007 burned surface of ARF
(left of the pond) compared with unburned surface (right; WP186).
Increased cottongrass bloom is also observable in the burn.
26You can also read