Testing accretion disc theory with high-cadence reverberation mapping - Juan V. Hernández Santisteban
←
→
Page content transcription
If your browser does not render page correctly, please read the page content below
Testing accretion disc theory
 with high-cadence reverberation mapping

 Juan V. Hernández Santisteban
 Keith Horne, Rick Edelson, Jonathan Gelbord,+

 XVII DEX Virtual Workshop
 7 January 2021
Image credit: Nika Maisuradze
The structure around a supermassive black hole

 Accretion Disc

 Broad-line region Jet

 Torus
 Narrow-line region
 Marin, 2016, MNRAS
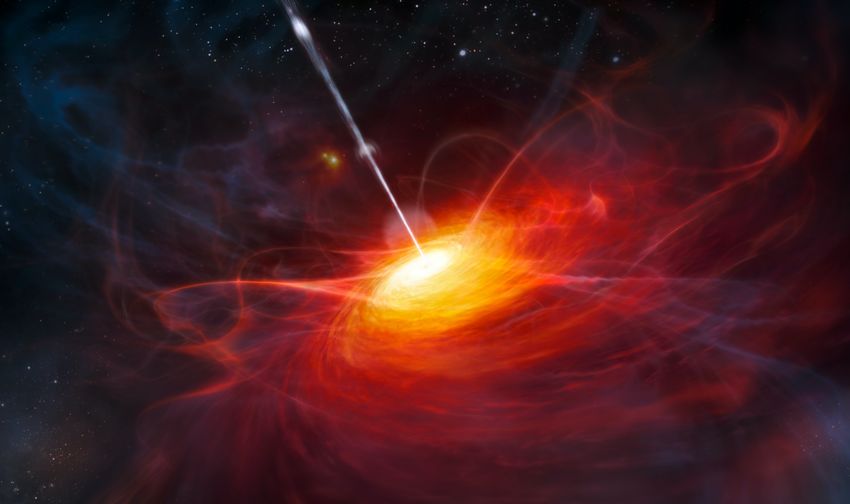
Accretion discs in Active Galactic Nuclei

 Central Engine of AGN —> small angular size

 EHT+, 2019, ApJL

Credit: ESO/M. Kornmesser

 GRAVITY COLLABORATION+, 2018, Nature
Testing accretion onto AGN

 • AGN Spectral Energy distribution (SED) is different from LMXBs “analogues”

 • Timescales of change (Changing Look Quasars)

 • Accretion disc sizes don’t agree

 Stringent tests of accretion theory are required!

Testing accretion onto AGN

• AGN SED Temperature profile?

• Timescales of change (CLQs)
 Should peak in the EUV,
• Sizes don’t agree but peak is closer to 100 nm

 LMC X-3

 Davis, Done & Blaes 2006, ApJ, 647, 525 UV opacities might be key?

Testing accretion onto AGN

• AGN SED

• Timescales of change
 (Changing-Look Quasars)

• Sizes don’t agree

 Cyg X-3

 Disappearing broad emission lines
 In timescales of

Testing accretion onto AGN

• AGN SED

• Timescales of change (CLQs)

• Sizes don’t agree

 Microlensing ( factor ~3-30 larger) e.g., Poole+ 2007, Morgan+ 2018

 Disc Reverberation Mapping ( factor ~3-5 larger) e.g., Edelson+ 2019

 BH ??

 7
Disc Reverberation Mapping

• AGN SED ⌧ = R/c / (M Ṁ )1/3 T 4/3

• / (M Ṁ )1/3 4/3
 Timescales of change (CLQs)
 / M 2/3 (L/LEdd )1/3 4/3
• Sizes don’t agree

 h = 6 rg

 BH

 Lamp-post model Trade-off angular resolution for temporal resolution
 8

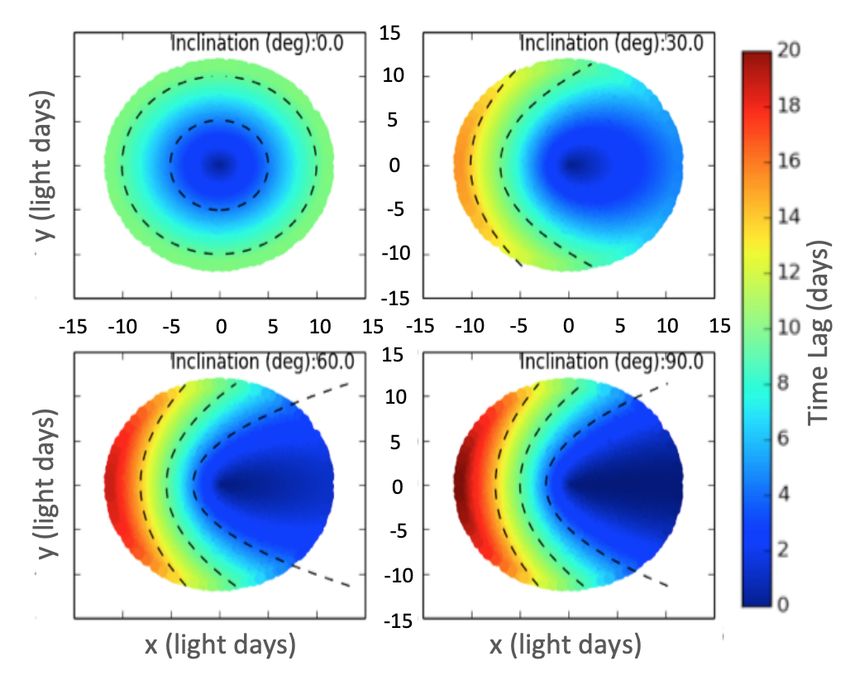
Disc Reverberation Mapping
 1/3 4/3
 As mass moves inwards, / (M
 ⌧ = R/c / Ṁ))1/3
 (MṀ T 4/3

 temperature increases!

 Starkey+ 2016

 UV Near-infrared We expect larger lags at
 Xrays Optical lower temperatures (large wavelengths)

 “Jaw-breaker schematic”

Disc Reverberation Mapping

 NGC 5548

 Cackett+ 2007, MNRAS, 380, 669 Fausnaugh+ 2016, ApJ, 821, 56

 10
“INTENSIVE” Disc Reverberation Mapping

 Edelson+ 2019 , ApJ, 870, 123

 Lags largely consistent with ∝λ4/3

 U-band excess —> Diffuse Continuum Emission from the BLR! e.g. Korista & Goad 2019

 11
Intense Disc Reverberation Mapping

 Fairall 9

 Hernández Santisteban+ 2020, MNRAS, 498, 5399

 12
Fairall 9: test case

• Seyfert 1

• z = 0.047

• Low extinction; E(B-V)=0.024

• MBH = 2.6 x 10⁸ M

• X-rays, very clean source

 HST image. Credit: A. Barth

 13
Fairall 9

 Lohfink+, 2016, ApJ, 821, 11

nH~1020 cm-2 Pal+, 2017, MNRAS, 466, 1777

Absorption is not responsible for the
variability observed Evidence for continuum lag
 —> Clean view of the central engine! —> CAVEATS: large uncertainties

 14
Intensive Disc Reverberation Mapping

Key Projects in:

Monitoring 3+ years on daily cadence

 15
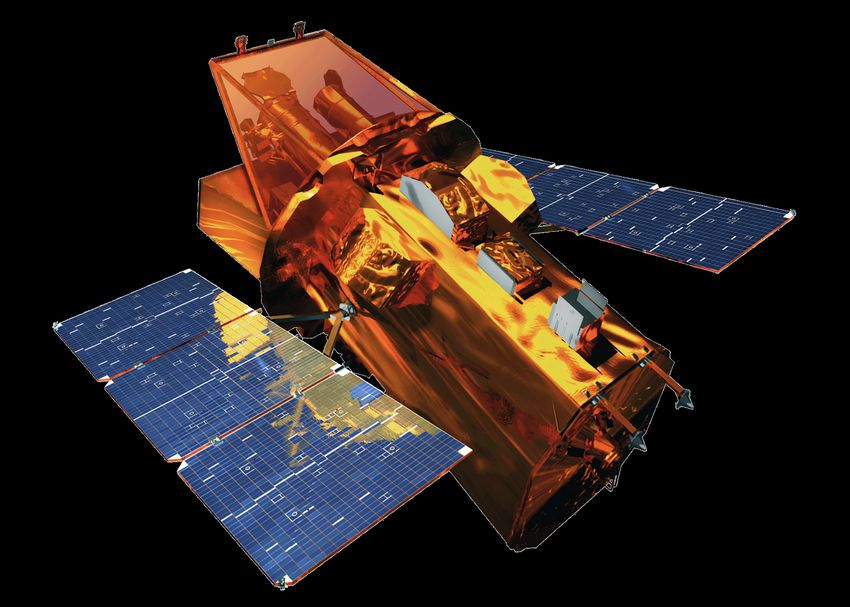
Fairall 9: the data

Year 1
 High signal to noise: SNR~50-80

Swift
 • Xrays (SX & HX)
 • UV (3 filters)
 • Optical (3 filters)
 • Mean Cadence ~1.1 days

Las Cumbres Observatory

• Optical (7 filters, 400-900 nm)
• Mean cadence ~0.36 days
• Total Exposure: 630 ks
• Additional spectroscopy,
 4 day cadence

 Hernández Santisteban+ 2020, MNRAS, 498, 5399

 16
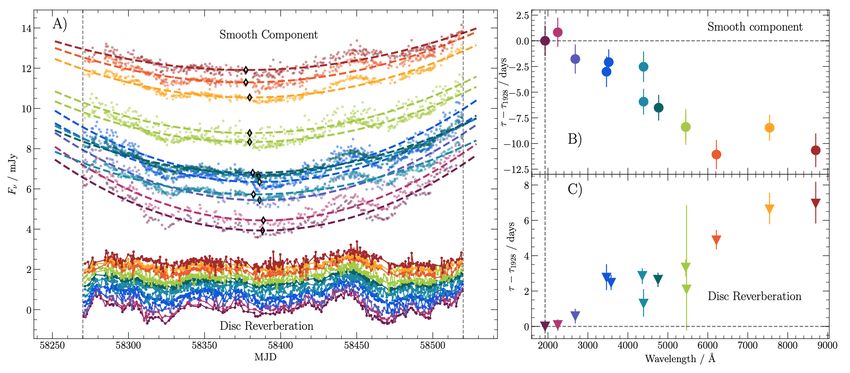
Fairall 9: Two variability components

 Hernández Santisteban+ 2020, MNRAS, 498, 5399
Fairall 9: Lag Spectrum

 ∝ λ1.26±0.21 Balmer jump

ICCF

• Lags larger than
 predicted!

• Evidence for
 diffuse continuum Paschen jump
 in the lag
 spectrum

 Hernández Santisteban+ 2020, MNRAS, 498, 5399

 18
Fairall 9: Dissecting the Variable Component

 F ( , t) = C( , t) · X0 (t) + S( , t)

 Galaxy AGN AGN
 Contribution low high
Aperture Photometry

 Credit: A. Barth

 Hernández Santisteban+ 2020, MNRAS, 498, 5399

 19
Fairall 9: Dissecting the Variable Component

 Hernández Santisteban+ 2020, MNRAS, 498, 5399

 20
AVA - AGN Variability Archive

 2020 LCO Key Project
Legacy Database for AGN variability studies! (PI Hernandez Santisteban)

 Hernández Santisteban, Horne & Edelson, in prep
Conclusions

 • Multi-mission echo mapping experiments are providing high-quality data to
 test accretion physics onto Supermassive black holes

 • Fairall 9 is a fantastic clean test-site for many experiments
 • Lags are consistent with thin accretion disc prediction: ∝ λ4/3
 • Two distinct variability components in opposite directions

 • New 2020 LCO Key Project will deliver 8 more targets for 3 more years!!!

 @Alymantara

 alymantara.com/idrm https://lco.global/science/keyprojects/
You can also read