The growth of distributed generation and associated challenges: A Great Britain case study
←
→
Page content transcription
If your browser does not render page correctly, please read the page content below
Received: 28 July 2021      Revised: 17 December 2021       Accepted: 18 January 2022                                    IET Renewable Power Generation
DOI: 10.1049/rpg2.12416

ORIGINAL RESEARCH PAPER

The growth of distributed generation and associated challenges:
A Great Britain case study

Samuel Gordon                               Connor McGarry                              Keith Bell

Department of Electronic and Electrical                   Abstract
Engineering, University of Strathclyde, Glasgow,
UK
                                                          Great Britain has reached high penetrations of distributed generation (DG). Historically,
                                                          there has been a lack of technical requirements for DG to provide system support and
Correspondence                                            for network operators to monitor, control and gather detailed information on DG instal-
Samuel J. Gordon, Department of Electronic and            lations. As a result, much of it is unobservable and uncontrollable. This work has analysed
Electrical Engineering, University of Strathclyde,
                                                          the available data sources for the amount, size and type of DG installations in GB. It is
Glasgow, UK
Email: samuel.gordon@strath.ac.uk                         found that the lack of transparency and consistency of data are likely to act as an obstacle
                                                          to the development of a more active distribution network. The impact that high DG has
Funding information                                       on system operation and system stability is discussed, including the potential for DG to
UK Engineering and Physical Sciences Research             offer flexibility services. A system disturbance in GB on August 9th 2019 brought a num-
Council (EPSRC); Centre for Doctoral Train-
ing in Future Power Networks and Smart Grids,             ber of issues into focus: Slow action to change inappropriate settings of DG loss-of-mains
Grant/Award Number: EP/L015471/1                          protection and the uncertainty that DG adds to the effectiveness of under frequency load
                                                          shedding schemes. Finally, it is argued that coordination between transmission and distri-
                                                          bution networks is central to addressing many of the challenges and is a key enabler to
                                                          utilising the flexibility available from DERs and releasing capacity for more DERs to be
                                                          connected.

1          INTRODUCTION                                                                        the system’s inertia and short circuit levels and changing its
                                                                                               dynamics.
The drive to decarbonise energy systems and reduction in                                          Denmark is an early example of a power system with high
the cost of renewable energy technologies have significantly                                   amounts of DG, reaching over 50% of installed capacity by
increased the share of electricity production taking place at the                              2007. At that time, an innovation project in hybrid network con-
distribution level. The increased use of distributed generation                                trol was launched by the TSO to address power system secu-
(DG), in particular wind and solar and other distributed energy                                rity problems associated with high DG [2]. Similar issues are
resources (DERs), such as energy storage devices, alters power                                 being experienced in Great Britain (GB) today and discussed
flows within electricity distribution networks and may require                                 in this paper. In Spain in 2006, the TSO commissioned a ded-
changes in an electric power system’s operation and commercial                                 icated control centre that receives real-time communication of
and regulatory arrangements [1].                                                               active power produced by generators with capacities of more
   High penetration of variable DG presents several challenges                                 than 1 MW. This has led to 99% of wind and 70% of PV
to power system planning, operation and control, including                                     capacity being observable, and plants of > 10 MW being able
but not limited to, accommodating DG capacity with a grow-                                     to respond to active power set points [3]. Germany also has a
ing need for management of distribution network constraints,                                   significant penetration of variable DG, leading to constraints
increasingly localised supply resulting in a less schedulable gen-                             at various voltage levels, with much of this DG installed at
eration portfolio for the transmission system operator (TSO)                                   lower voltages and not monitored. Curtailment of DG is possi-
and increased converter interfaced generation (CIG) reducing                                   ble by the German TSOs. However, it requires well-coordinated

This is an open access article under the terms of the Creative Commons Attribution License, which permits use, distribution and reproduction in any medium, provided the original work is
properly cited.
© 2022 The Authors. IET Renewable Power Generation published by John Wiley & Sons Ltd on behalf of The Institution of Engineering and Technology

IET Renew. Power Gener. 2022;1–14.                                                                                                                 wileyonlinelibrary.com/iet-rpg      1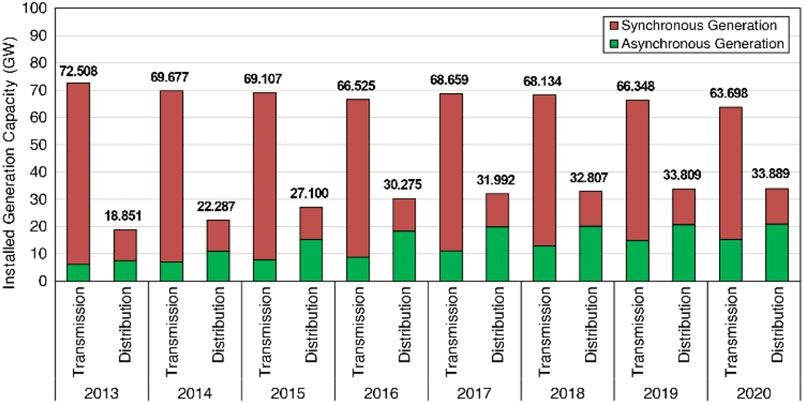
2                                                                                                                           GORDON ET AL.

communications as they must contact the various regional and
medium voltage control centres to make a request for manual
adjustment [3].
    Some areas of GB have now achieved high penetration of
variable DG. Initially, technical rules were underdeveloped as
connections to distribution networks in GB were made with a
‘fit and forget’ design approach and with an assumption of a
strong transmission system. This led to shortcomings in DG
technical requirements, including a lack of visibility and con-
trol, the under-exploitation of grid support functionality and
overly sensitive protection settings which can reduce power sys-
tem resilience [4, 5]. In GB, there has also been a lack of com-   FIGURE 1      Generation mix in GB transmission and distribution
mon protocols for recording DG data leading to uncertainty in
the amounts and types of DG at various locations in the net-
work. Therefore, uncertainties arise when considering DG in        is transparency of network data. There are three main sources
operational processes, modelling and technical system studies.     of DG data in GB: (1) Future energy scenarios (FES) pub-
    This paper discusses system challenges associated with the     lished by National Grid Electricity System Operator (NGESO)
growth of DG, assessing them through the lens of what has          which outlines credible growth scenarios for the whole elec-
happened in GB. The remainder of the paper is organised as         tricity system; (2) the UK Government’s Department for Busi-
follows: Section 2 provides an assessment of the amounts of        ness, Energy & Industrial Strategy (BEIS) which publishes his-
DG embedded within the GB power system. Section 3 reviews          toric energy data and trends; and (3) Long Term Development
operational issues related to system balancing, active network     Statements (LTDS) published by Distribution Network Oper-
management and quasi-steady state voltage control. Section 4       ators (DNOs) for each licence area. Each data source is cre-
discusses the influence that DG has on the system’s response to    ated by a different organisation with different intentions. When
disturbances, reflecting on existing issues exposed by a power     compared, significant variation can be observed in reports of
system disturbance event in GB in 2019, as well as the influence   DG installed capacities, technology groupings/labelling and the
of DG on system fault levels. Section 5 concludes the paper.       granularity of data, making it problematic to combine features
The contributions of this paper are summarised as follows:         from each data source [6].
                                                                      The LTDS are part of a DNO’s distribution licence condi-
∙ Analysis of the available sources of data for DG in GB have      tions with the primary function of providing data for genera-
  been reviewed, compared, and analysed to provide a detailed      tion developers and potential new loads to assess and evalu-
  overview of the amounts and types of DG installed in the sys-    ate local connection opportunities. In July 2020, and since the
  tem. This analysis highlights discrepancies between the avail-   publication of [6], the ‘embedded capacity registers’ published
  able DG data records and reveals a lack of availability and      as part of the LTDS have been standardised and expanded to
  transparency of consistent data for DG that can act as an        include further information such as site location and the type
  obstacle to planning and operating a well-coordinated whole      of connection that the DER has [7]. This improvement in data
  electricity system.                                              collection should, in theory, improve network forecasting and
∙ This work provides an overview of the challenges arising         planning functions for the TSO and assist the DNO to transi-
  from the growth of DG, focussing on those that affect the        tion to a distribution system operator (DSO) [1, 5]. Currently,
  secure operation of the power system in GB. As a result          the LTDS is reported in a common overall format but is gen-
  of this review, the importance of building in observabil-        erated independently for each of the 14 DNO licence areas in
  ity and controllability to DG connections is highlighted, in     GB.
  order to reduce uncertainty in system operation and improve
  responses to system disturbances.
∙ Finally, examples of mitigating actions, ongoing innova-         2.1       Current DG installations
  tion projects and changes to codes and market structures
  that have occurred in GB are given throughout the paper.         Figure 1 shows DG, connected to all DNO licence areas in GB
  Moreover, key questions are raised that remain unanswered        and split by technology type, as a proportion of total registered
  and require addressing as the system continues to become         installed generation capacity, according to the LTDS data and
  increasingly distributed.                                        the transmission entry capacity register as of 2019 [8]. As the
                                                                   LTDS does not include installations with capacities of less than
                                                                   1 MW, data for micro-PV installations from BEIS have been
2   DISTRIBUTED GENERATION IN GB:                                  included [9], with the assumption that PV makes up the vast
TYPE, SIZE AND LOCATION                                            majority of small installations. The ‘Embedded’ generation cat-
                                                                   egory is generation that has connected to the distribution net-
A key influence on an ability to study and plan for the effi-      work yet has contracted with National Grid to obtain rights of
cient operation of a power system with high penetrations of DG     access to the transmission network and is therefore ‘visible and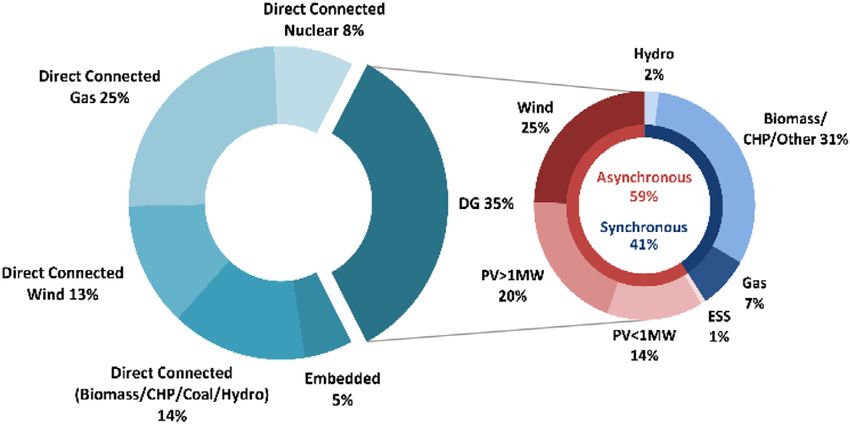
GORDON ET AL.                                                                                                                                                3

TABLE 1        Project size at different voltage levels (LTDS) for projects of greater than 1 MW

                                            DG ≤ 11 kV                   11 kV < DG ≤ 33 kV                33 kV < DG ≤ 132 kV               Transmission

No. of sites (> 1 MW)                       1,902                        1,175                             127                               152
Total installed capacity (MW)               7,385                        16,600                            8,297                             65,683
Mean capacity (MW)                          3.9                          14.1                              65.3                              432.1

FIGURE 2 Distributed generation technologies, installed at different
distribution voltages in GB

                                                                                     FIGURE 3 Ratio of installed DG capacity at 11 and 33 kV to the sum of
controllable’. DG, which makes up 35% of total installed gen-                        DNO peak substation demands
eration capacity, is largely unobservable and uncontrollable by
the TSO. 59% of DG is asynchronous with a variable renew-                            ratio of DG capacity to local demand, the greater impact DG
able energy source. 41% of DG is synchronous generation with                         has on the wider system due to (1) a reduction in net demand
a storable fuel source. However, much of the synchronous DG                          seen by the transmission system, (2) an increasing occurrence
lacks the plant level and network level controls to be utilised for                  of ‘reverse power flow’ supplies to the transmission network
system operation.                                                                    and (3) increased variability in net transmission demand as true
    Table 1 shows the increase in the number of projects con-                        demand is being supplied by variable DG.
nected at lower distribution voltages and their relative sizes. DG                      Figure 3 shows the ratio of installed DG to demand where
connections that are above 1 MW in size and connected at 11 kV                       DG(11) is all generation connected at 11 kV and below and
or below make up 23% and 8% of distribution connected and                            DG(33) is all generation connected at 33 kV and below. The
total connected capacity, respectively. However, they represent                      ratio considers total installed capacity for DG and the com-
57% of the total number of sites. As the connection voltage level                    bined annual peak of all primary substation demands in each
increases, the mean project size increases and the number of                         area. Diversity in both demand and generation is not consid-
connections reduces significantly. This information shows the                        ered; the ratios are therefore intended only as a guiding metric
extent of the challenge for improving visibility within distribu-                    to identify DNO licence areas with high DG capacity.
tion networks, with a sizeable amount of capacity located across                        Visibility of power flows within distribution networks, par-
numerous sites at lower distribution voltages.                                       ticularly in 11 kV and low voltage (LV) networks has histori-
    For the sub-1 MW category, the mean capacity of each site is                     cally been poor, partly due to lack of need. However, growth in
small due to the volume of installations on residential and com-                     peak demand, network complexity and decentralisation call for
mercial buildings. According to BEIS data for solar PV deploy-                       greater visibility across network voltage levels, which is a chal-
ment [9], by December 2019 a total of 1,000,552 solar PV instal-                     lenge for current data systems and architectures [5, 10]. Further-
lations existed in GB, which make up 12,858 MW of PV capac-                          more, there are currently no common data sharing protocols
ity. Of this, 99.5% of installations are less than 50 kW. However,                   or mechanisms for network monitoring data [5]. It is impor-
the data for the number of installations cannot be reconciled                        tant that energy system data can be shared across platforms and
with the LTDS data due to lack of consistency when categoris-                        meets the needs of multiple types of users, including the DSO
ing projects. Despite the introduction of ‘embedded capacity                         to make decisions and open up flexibility markets, flexible ser-
registers’, sub-1 MW DG capacity must still be inferred from                         vice providers and consumers while respecting privacy and con-
various other sources such as subsidy registers.                                     sumer protection.
    Figure 2 shows the installed capacity of each technology type
at different distribution voltage levels. To give a more accu-
rate representation of small-scale solar PV installed on resi-                       2.2           Energy from distributed generation
dential and commercial premises, an estimate of 5,277 MW of
PV capacity made-up of installations less than 1 MW has been                         Using the estimates of the installed capacities for different tech-
estimated from [9] and included in Figure 2. The higher the                          nologies across GB, the associated energy outputs have been
4 GORDON ET AL.
TABLE 2 Estimated DG energy output for 2019
2019 CFs Average CFs
2011–2019
LTDS Total Output 2019 Implied contribution
installed from DG Output from of LTDS DG to demand
Type capacity (GW) CF % (TWh) CF % DG (TWh) (%)
Other 11.45 54.90 55.07 56.20 56.37 15.92
Storage 0.28 7.28 0.18 11.30 0.28 0.05
Gas 2.78 43.02 10.48 38.80 9.45 3.03
PV 12.80 11.16 12.51 10.60 11.89 3.62
Hydro 0.78 38.76 2.65 36.30 2.48 0.77
Wind 9.23 31.42 25.40 30.40 24.58 7.34
Total 37.32 – 106.29 – 105.05 30.73
estimated by using the 2019 UK average capacity factors (CFs)
published by BEIS through the Digest of UK Energy Statis-
tics (DUKES). DUKES Table 6.5 [11] which provides CFs
for renewable technologies and Table 5.10 [12] for conven-
tional technologies are primarily used. The relevant 2019 CFs
are applied to the 2019 LTDS installed capacities in Table 2 for
the applicable technology types, as are the average CFs from
the years 2011–2019. The bulk of the ‘Other’ category from the
LTDS data is expected to be predominately bioenergy technolo-
gies such as Anaerobic Digestion, Biofuel and Waste Incinera- FIGURE 4 Installed generation capacity, split into synchronous and
tion, as well as combined heat and power (CHP) plant using nat- asynchronous generation connected to the transmission and distribution
ural gas. Therefore, the average capacity factor of the bioenergy networks in GB
technologies given in DUKES Table 6.5 and CHP from [13] is
applied to ‘Other’ technologies. The capacity factor for pumped
storage as per NGESO in [14] is applied to all ‘Storage’ tech-
nologies. Finally, the implied contribution of DG energy out-
put to the total demand of 346 TWh in 2019 [15] is provided.
The total demand includes system losses (26 TWh, or 7.6% of
demand) and energy industry use (24 TWh, 6.9% of demand)
[15].
It is noted that there is a high installed capacity of ‘Other’
technologies and therefore the capacity factor applied signifi-
cantly influences the overall final estimate. This introduces an
increased level of uncertainty in the estimate of energy contri-
bution from DG. Better labelling of data, monitoring and visibil- FIGURE 5 Growth of individual DG technologies from 2011–2020
ity of the operating regimes for the ‘Other’ technologies would
allow a more confident estimate of energy supplied by these
types of DG. Additionally, the UK average capacity factors used asynchronous generation, primarily variable onshore wind and
here are expected to vary compared with figures solely for GB. solar. This is demonstrated in Figure 5, which provides the his-
toric trends for the individual technologies that underpin what is
shown in Figure 4. An increase in renewable synchronous gener-
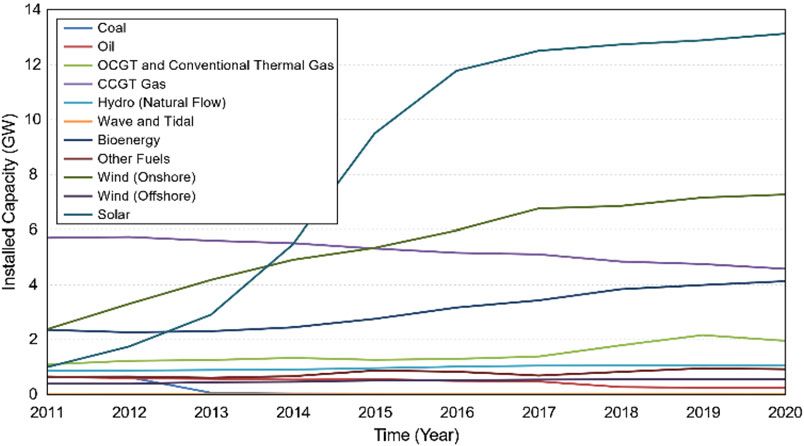
2.3 Growth trends for distributed generation ation, specifically bioenergy, is also evident which has countered
a reduction in CCGT capacity using natural gas. In the same
Figure 4 shows the installed capacity connected to the Transmis- period, asynchronous generation also grew substantially on the
sion and Distribution (T and D) networks for the period 2013– transmission network, with significant additions of onshore and
2020 inclusive [16]. In this period, DG grew substantially, stim- offshore wind connections. Also, during this period, both the
ulated by government incentives such as Feed-in Tariffs (FiT). overall installed capacity and the share of synchronous gener-
Installed capacity on the distribution network grew by an aver- ation in the transmission network reduced following closure
age of more than 10% per year, driven by additions in renewable of thermal plant. This combination of factors results in a lessGORDON ET AL. 5
TABLE 3 Installed generation capacities for three net-zero FES 2021 economic and political enabling environment, rapid growth in
scenarios in the transmission and distribution networks the renewable energy sector can continuously surpass long term
Transmission Distribution growth forecasts.
Installed Capacity (GW) 2030 2050 2030 2050
Leading the way 137.1 178.1 61.6 141.5 3 OPERATIONAL CHALLENGES OF
Consumer transformation 125.4 233.1 56.0 124.2 AN INCREASINGLY DISTRIBUTED
System transformation 121.2 220.1 47.1 85.1
SYSTEM
The growth of DG and the concurrent reduction in trans-
mission connected synchronous generation, as discussed in
schedulable and less dispatchable generation portfolio for the Section 2.3 and shown in Figure 4, can affect many areas
TSO [17]. of power system operation, notably related to system bal-
In NGESO’s FES 2021 [18], four scenarios are outlined ancing and management of voltages. In this section we dis-
which describe credible pathways for how the future of energy cuss these challenges. Many of them result in increased uncer-
and networks might evolve between now 2020 and 2050, three tainty in transmission system operation as well as a need for
of these meet net-zero emissions by 2050. These three scenar- improved coordination between the transmission and distribu-
ios: ‘Consumer Transformation’, ‘System Transformation’, and tion (T&D) systems in order to facilitate whole electricity system
‘Leading the Way’ all predict a significant increase in connected operation.
generation capacity in both transmission and distribution net-
works. ‘Leading the Way’ and ‘Consumer Transformation’ sce-
narios both lead to a higher uptake of decentralised generation 3.1 Transmission system operation in GB
than the ‘System Transformation’ scenario, but all of them show
significant DG capacity being added to the system. Solar PV National electricity system operation in GB at the time of writ-
capacity is projected to dominate in comparison with other tech- ing is performed by the Electricity System Operator part of
nologies, though significant uptakes of onshore wind, hydro- National Grid, NGESO (equivalent to a TSO though without
gen and storage are anticipated across the discussed scenarios. responsibility for owning, maintaining and developing the trans-
Table 3 shows the installed capacity for each scenario calculated mission network’s assets). NGESO must operate the system
from [19]. in compliance with the security and quality of supply standard
The LTDS includes data for ‘accepted’ generation projects (SQSS) [23], such that the system remains stable and secure dur-
in each licenced network area. Accepted DG are those that ing normal conditions and following a single fault event. This
have signed grid connection agreements with the DNO, but involves balancing supply and demand through the Balancing
projects may be on hold, for example, due to lack of a credi- Mechanism (BM) and ancillary services and determining the
ble business case following withdrawal of subsidies. Since the optimal re-dispatch of generation or controllable loads during
withdrawal of support in 2017, the UK Government recognised each trading period of the market.
that “there is a risk that if we were to rely on merchant deploy- Examples of typical intervening operational actions include
ment of these technologies alone at this point in time, we may managing transmission line thermal constraints or dispatching
not see the rate and scale of new projects needed in the near- additional synchronous generation to increase the system’s iner-
term to support decarbonisation of the power sector and meet tia to aid management of system frequency or ensure suffi-
the net zero commitment at low cost” [20]. Subsequently, they cient reactive power is available for voltage support [24]. ‘Con-
have allowed ‘established’ technologies, which include onshore strained on’ generation is typically out-of-merit in the uncon-
wind and solar PV of > 5MW, to again apply for centrally strained wholesale market and connected to the transmission
awarded, government-backed contracts for difference for low system. Its use for system inertia often requires curtailment
carbon generation [20]. of output from renewable generators, usually wind, [25, 26].
Several ‘accepted’ projects may never get built. However, The costs of these operational actions are recovered from all
many projects could go ahead in the near term, given the participants in the GB BM and ultimately passed through to
right market conditions. The total accepted connections would customers.
increase DG capacity by 60% from 37,611 to 60,836 MW. Of
this, 29% would be connected at or below 11 kV and 75% at
33 kV. This shows the scale of capacity in the distribution net- 3.2 Operation at low net transmission
work that, in principle, is already reserved for connections that system demand
are yet to be built.
Each year BEIS publishes energy projections, including As previously noted, DG in GB is mostly unobservable by the
installed capacity for renewable energy. The forward projections TSO and its output is a function of its technical availability and
for 2019 were 25 GW in 2011, 41 GW in 2015 and 44 GW the available energy resource, that is, it is not dispatched by the
in 2018 [21]. However, capacity for renewable energy at end short-term market and, at least for variable renewable sources,
of 2019 stands at 47.4 GW [22], showing that, given the right its output is decoupled from demand. Generation participating6 GORDON ET AL.
in the GB wholesale market is scheduled by its owners in merit To increase the amount of downward flexibility, a new tem-
order. Any available intermittent renewable sources will typically porary system service termed Optional Downward Flexibility
be scheduled before any conventional thermal generation due to Management (ODFM) was introduced in 2020 by NGESO and
its low short-run marginal costs. Baseload nuclear power plants approved by the regulator (Ofgem) [32]. The purpose of ODFM
also typically have a lower marginal cost than more flexible gas is to ensure that flexible generation can be reduced to match
plants due to high start-up costs and are committed for longer demand. It does this by instructing DG to reduce its output to
time periods. Therefore, it is becoming increasingly challenging zero or by increasing demand, both of which increase net trans-
to balance the system during periods of low demand, particu- mission system demand. The majority of providers were dis-
larly when outputs from renewable generation are high and the tributed solar and wind generators, but also included demand
demand gets close to, and in some periods may fall below, the turn-up assets. During 2020, the service was instructed five
level of inflexible or uncontrollable generation on the system times with a total cost of approximately £7 m. Three of these
[25]. The TSO may need to curtail output from DG over which, occasions were over a bank holiday weekend in May, which
up to the time of writing, it has had extremely limited control. would be expected to see low demand; the volume of actions
Critical operating conditions related with low demand and the required was between 411 and 3,177 MW of downward re-
lack of controllability of DG were exposed during the COVID- dispatch [27].
19 pandemic which, in March 2020, led to the first national lock- The low demand seen during the COVID-19 pandemic, and
down in GB. The shift in day-to-day activities of people across the need to introduce the ODFM reserve product exposes the
the entire country had a significant impact on the demand pro- challenge of operating the system with high amounts of unob-
file of the electricity system. In general, domestic use of elec- servable and uncontrollable DG. More enduring solutions to
tricity increased while commercial and industrial demand fell. improve the amount of downward flexibility available to the
According to NGESO [27], the reduction of the in-day demand system operator include its ongoing reforms of power reserve
during April and May 2020 was in the range of 5–20% and products and facilitation of wider access to the BM, which, as
the overnight demand in the range of 2–15%. An indepen- discussed in Section 3.5, still requires removal of barriers to
dent assessment described weekday demand as resembling what entry and is dependent on uptake from DERs. However, it is
would normally be seen at a weekend [28]. On the 28th of June noted that these are transmission system solutions. DSO led
2020 the lowest ever national transmission system demand of solutions could also be used to address this challenge, for exam-
13.4 GW was recorded. The greatest effect on the demand pro- ple through more active operation and local energy balancing
file was a reduced peak demand [29], which would be expected within the distribution networks. In order to facilitate DSO led
as people are less bound by conventional business operating solutions improved T&D coordination is required. (See Sec-
hours. tion 3.8).
The pandemic meant that low levels of net demand as seen
from the transmission system were experienced some years ear-
lier than had been expected. During low demand conditions 3.3 Voltage control
with high renewable outputs, the number of actions required
to secure the system is often increased and incurs additional As traditional means of voltage control from synchronous gen-
costs. According to [30], the average costs of balancing the sys- erators decreases and load patterns change due to the high
tem for the last decade have been around 5% of the cost of penetration of intermittent DG, new approaches for voltage
generation production and have been marginally increasing in control are required [3]. To address the need for voltage con-
the last 5 years as the share of variable renewable generation trol at the T/D interface, a challenge exists to determine the
has increased. However, for the second quarter of 2020 (during amount of reactive power available at the interface node [33].
which severe social restrictions were in place), system balancing This requires additional visibility and control at the DG plant
costs rose sharply, adding 20% to the cost of generation. level but must also be simultaneously coordinated with trans-
The supressed demand and high DG output created various former tap changer control to achieve the desired effect at the
additional challenges for the TSO [27, 31], including: transmission system. Under G59 regulations [34] which were
superseded by G99 in 2019 [35], DGs in Britain were not
■ Downward flexibility—this is required to reduce generation required to be capable of regulating active and reactive power or
on the system to match demand during low demand condi- providing voltage droop control at the point of common cou-
tions, accounting for forecasting errors and to ensure suffi- pling. Through a lack of need, DGs tended not to install power
cient margin exists to contain high system frequency. plant control systems to interface with the grid. However, while
■ Voltage management—lower power flows across the net- the inverters may be capable of regulating reactive power very
work increase reactive gain; meanwhile, fewer generators are quickly, as it was not a requirement during the project design
available to provide voltage support (discussed further in stage, the DG owner will seek reimbursement of costs for any
Section 3.3). lost active power due to limits of converter ratings and financial
■ System stability—operating with a high share of power incentives to make any required changes to plant controls.
electronic interfaced generators reduces system inertia and In the past these services would have been provided as a
increases the risk of unintended operation of DG protec- mandatory grid code requirement for a large generator. A study
tion (discussed further in Section 4.1). to address voltage issues in the southwest of England indicatesGORDON ET AL. 7
that dynamic voltage support from DGs would help with the such, there is a requirement for additional data exchange with
management of transmission limits. However, at present and NGESO which has its own coordination and security challenges
due to lack of foresight at the time of connection of the DG, the (see Section 3.8).
only way to change the DG’s power factor is to send a techni- Even with improved techniques, uncertainties affecting fore-
cian to site to make a manual adjustment and is therefore highly casting will remain, for example, due to the lack of visibility of
unpractical and inflexible [36]. DG in GB, the dispersed nature of different technologies and
Methods to encourage and enable DG to participate in volt- variations in local weather conditions. Therefore, there is also a
age control will require improvements to DG control systems, requirement for modelling techniques that support uncertainty
improved monitoring on DNO networks and, where the DG quantification [38, 39].
is to support transmission system voltage constraints, coordina-
tion between DNO and TSO systems. One project which has
demonstrated this is discussed in Section 3.8. 3.5 DG providing flexibility
Flexibility—the ability of a resource to vary its state in light of
3.4 New uncertainties in operational variations in system conditions or sudden changes—has typi-
forecasting cally been provided by large, transmission connected generators.
However, a broader range of flexible DER are starting to par-
In GB, NGESO has been the main party in need of forecasts of ticipate in balancing and ancillary service markets operated by
demand and, in more recent years, of output from transmission NGESO in response to (1) an opening up of access to these
connected wind generators. The methods it uses are relatively markets to small service providers in the range of 1–100 MW
mature due to the longstanding energy balancing requirement. capacity, and (2) to allow some services to be delivered by aggre-
However, there are many new sources of uncertainty stemming gated assets [40–42]. However, barriers to entry for DG remain,
from the continued growth of DERs. As highlighted through- mainly the result of a high cost of compliance with a number of
out this paper, the vast majority of DG is un-scheduled and different codes [43].
uncontrolled, with much of it driven by weather dependent vari- In recent years there has also been rapid growth in flexibility
able sources (see Section 2). It therefore offsets the true system services being procured by the DNOs in GB. Starting in 2018
demand as seen by NGESO at the boundary between transmis- with 116 MW of flexibility being contracted, this has increased
sion and distribution, that is, at the grid supply points (GSPs). 16-fold in three years to 1.6 GW being contracted in the period
This results in it becoming increasingly difficult to accurately up to July 2021 [44]. These services are typically procured to
forecast the aggregated national demand, potentially resulting manage peak demands, for example due to load growth, as an
in higher energy imbalance for the ESO to manage close to alternative to network re-enforcement. Therefore, participants
real time. Based on this need and in the absence of monitor- are limited to dispatchable types of DG able to provide active
ing of DG, the aggregated GSP demand forecasts currently power turn-up or demand that can provide a turn-down service.
account for distributed solar and wind by obtaining the capacity For variable DG such as wind or solar, these services would
and location of DG from public databases (BEIS) and utilising require a suitably sized co-located energy storage system.
weather data from the station in closest proximity to renewable The ability of DERs to provide multiple services, that is, to
generators to form generation output forecasts [37]. However, ‘stack’ them—from the same physical asset—to improve their
one project ongoing at the time of writing aims to improve fore- revenues can maximise their value and therefore can lead to
casting by incorporating advanced statistical and machine learn- higher participation. There remain some contractual or regu-
ing techniques to obtain more frequent forecasts per GSP and latory barriers to revenue stacking and there is judged to be
improve forecast accuracy [37]. further room to coordinate different T&D services over dif-
Ambitions by DNOs to more actively manage resources con- ferent timescales [45]. For example, given the right protections
nected to their networks and better utilise available network against risk of non-delivery, actions to help limit peak power
capacity—a change characterised as one of becoming DSOs— flows on a distribution network thus enabling deferral of net-
have led to a need for them to develop operational forecasting work reinforcement might be combined with short term non-
capabilities [37]. Amongst other things, this will enable DSOs locational services such as frequency response for the TSO.
to identify potential threats to regional security of supply and Having clear rules and a supportive regulatory environment is
allow for more accurate identification of a need for conges- crucial to unlocking the value of flexibility for participants [46].
tion management ahead of time. These improvements will pro-
vide better notice to perform the required actions such as,
re-dispatch of generation, flexing of demand and re- 3.6 Active network management schemes
configuration of the network that each take time to be carried
out. In addition, the optimal utilisation of storage requires confi- To accommodate the growth of intermittent DG, active net-
dence in system conditions over a period of time. Regional DSO work management (ANM) schemes are being deployed by
operational forecasting can also benefit the TSO and national DNOs in GB [47, 48]. To date, ANM connections have typ-
demand and generation forecasts, as DSOs are ultimately best ically been offered to generators applying to connect to con-
placed to model and predict energy flows on their networks. As strained areas of the distribution network where the DG8 GORDON ET AL.
connection would otherwise have triggered network reinforce- 3.8 Transmission and distribution system
ments due to, for example, the risk of thermal overloads. coordination
The relatively high cost of network reinforcement required to
accommodate the DG project would largely be borne by the New technical and market frameworks, operational processes
applicant and would often be prohibitively high. ANM connec- and information exchanges are required to facilitate T&D coor-
tions allow generators to connect more quickly and at a lower dination. There are different ways in which this can be achieved
cost by including provisions for automatically curtailing their and various structural and functional models have been pro-
output during constrained periods. DG developers must accept posed in the literature which, in general, vary the roles and
the cost of unsold energy generation, coupled with the long- responsibilities that are adopted by the TSO and the DSO [1,
term risk that the business case could diminish over time due to 49, 52–54].
changing system conditions impacting the level of curtailment. As discussed in Section 3.5, market rules in GB have been
The authors in [1] argue that the DNO is best placed to man- amended to allow an increasing amount of DERs to participate
age the curtailment risk for ANM connected projects, given that in the balancing mechanism and contribute to ancillary service
they are the only party with enough knowledge of the network markets. There are also increasing opportunities to offer flexi-
to appropriately forecast and have control over network con- bility services to the DSO. A suitable coordination model must
straints. The DNO could be incentivised to do so by paying cater for the effective provision of both transmission and dis-
towards the cost of lost energy through a price for curtailment tribution level services from DERs while respecting distribu-
contracted in the connection agreement. tion network constraints. In this setting, a hierarchical model has
been proposed to provide reduced operational complexity and
a high level of efficiency where use is made of a DSO’s detailed
3.7 Service conflict with ANM schemes knowledge of the distribution network while allowing a TSO to
procure services from DERs. In such a model, the DSO coor-
For the most part, procurement of flexibility exists to resolve dinates and dispatches the DERs and validates the delivery of
the issues faced by each system or network operator, and much services to the TSO [49, 52]. However, it has been argued that
work remains in the move towards a ‘whole electricity system’ there is a potential conflict of interest for the DSO when val-
set of grid management services. Both DNOs and the TSO have idating service bids, operating its own network, and managing
the potential to benefit from flexible resources located in distri- and investing in network assets [52, 53]. This might be resolved
bution networks. However, enhanced observability of the signif- by introducing another party to operate the distribution net-
icant amounts of DG in the system and coordination between work and procure services, separate from asset ownership, that
the actions of both system operators is required. The potential is, an independent DSO (IDSO), a structure that is similar to
for conflicting actions and the need for cooperation are widely that of the legally separated network owner and system oper-
recognised and highlight the necessity to improve observability ator arrangement for electricity transmission in GB. However,
of the distribution networks and better transparency of grid data the addition of an IDSO adds complexity as multiple new enti-
[49]. ties may be required, that is, for each DSO area. It would also
ANM systems can exacerbate or create further challenges. be counter to the direction taken by the GB regulator in recent
The schemes operate without being visible to the TSO. years where it has encouraged each DSO to make decisions on
While transmission and distribution constraint conditions the mix of operational and asset-based actions it takes and the
might coincide—for example, high wind and low demand minimisation of its ‘totex’—the total of capital and operating
conditions—and an ANM action may benefit both constraints expenditure—required to deliver services to network users over
(e.g. by curtailing distribution connected wind located within the medium to long-term [55].
an export-constrained transmission region), actions required by Another important aspect of coordination is the data
a DNO or the TSO might be in conflict. For example, when exchanges required between DERs, DSOs, potential IDSOs and
the TSO requests an adjustment from DER providing a fre- TSOs. The data that is required to be exchanged will depend
quency management service, an ANM system will observe the on the type of structural model being adopted, for example, the
change in power flow across a monitored distribution constraint location of interface points and the responsibilities of the parties
and automatically alter the allowable output of the ANM con- [1]. In general, data exchange requirements include (1) informa-
nection, thus offsetting the effect seen at the transmission sys- tion on system parameters such as DG type, capacity and loca-
tem and potentially requiring the TSO to procure the response tion and network characteristics (such as discussed in Section 2),
again from elsewhere. Furthermore, the forecasting uncertainty (2) real-time network data such as to provide operational visibil-
of transmission constraints will be increased, as the TSO is ity and dispatch instructions, and (3) market data relevant to a
unaware whether the net load observed includes or excludes particular DER, for example, service volume or active power
DG located behind an ANM system [50]. forecasts [56].
In order to avoid conflict, the ODFM service described in A recent practical example of T&D coordination is the
Section 3.2 is not available to assets that have an ANM contract Power Potential project in GB involving one of the DNOs,
with a DNO [51]. However, this does not prevent other ANM UKPN, and NGESO. It has developed a distributed energy
systems counteracting the actions from non-ANM generators resource management system (DERMS) which gathers bids
delivering ODFM. from DERs and presents a day-ahead and real-time view ofGORDON ET AL. 9
services to NGESO at the GSP level and represents a mar- 4.2 Unintended operation of DG protection
ket driven rather than bilateral approach [57]. The project has
conducted live-trials with DERs to provide dynamic voltage The planning of DG technical requirements and lack of visibil-
control services to manage voltage constraints in the trans- ity and control mean that DG has not traditionally contributed
mission network, such as those discussed in Section 3.3. The towards maintaining the stability of the system in the same way
system can also facilitate active power services while manag- that larger transmission system connected generating units do.
ing potential conflict with ANM connections [58]. The Power This is mainly attributed to DGs not being required to remain
Potential project represents a DSO-led solution, where the TSO connected to the system during disturbances. Loss of mains
would provide signals to the DSO, such as information on con- (LoM) protection is designed to disconnect DG and prevent
straints and the flexibility service volumes it requires and access unintentional islanded operation on the distribution network.
them through DERs. However, the project did not address The two original schemes and settings used in GB are based
the simultaneous procurement of TSO and DSO flexibility on the static sensing of RoCoF being > 0.125 Hz/s, or a
services. voltage angle deviation of 6 degrees under Vector Shift (VS).
The low net demand as seen from the transmission system In a low inertia system, protection devices with these settings
during the COVID-19 related societal lockdowns, driven by are overly sensitive and can undesirably trip DG off the sys-
extremely low demand combined with high DG output, have tem in response to faults on the transmission network, even
anticipated similarly low transmission demand conditions that when the original fault is cleared, contributing further to the
were not expected to arise for a few years as DG capacity con- power imbalance and worsening the effects of the original
tinued to grow. Development of appropriate arrangements to disturbance [4].
manage the whole system and coordinate T&D are therefore Updates in 2017 to the Engineering Recommendation
increasingly urgent. G59/3-3, which is the DG connection standard in GB, stipu-
lated that VS was banned and old RoCoF settings were not per-
mitted on new or existing plant [34]. Since April 2019 the new
4 IMPACT OF DG ON POWER SYSTEM G99 connection standard requires DG to have RoCoF protec-
STABILITY AND RESPONSES TO FAULTS tion settings of 1 Hz/s with a time delay of 0.5 s [35].
Regardless of these technical code mandates, DG owners
Our analysis in Section 2 suggests that 59% of DG in Britain have been slow to change protection settings and changes
is converter-fed, intermittent and asynchronous, a proportion proved difficult to enforce [63]. The risk of disconnecting
that is expected to increase. Some of the key operability chal- large volumes of DG remains the dominant factor through-
lenges for the TSO are associated with a reducing system inertia out 2020 when managing system inertia [24]. NGESO must
and reducing fault infeed (herein termed the Short Circuit Level either procure more frequency containment reserve from ancil-
or SCL), caused by the displacement of large transmission con- lary service markets or must constrain down the largest single
nected synchronous generation. Significant amounts of DG in infeed to comply with the SQSS and maintain system secu-
the system contribute to these effects, which are described in rity. This operational action will become increasingly expen-
the following subsections. sive until the ‘Accelerated LoM change programme’ is com-
pleted to retroactively update DG protection settings [64]. How-
ever, as of December 2020, the reduction in the RoCoF LoM
protection risk was not yet enough to reduce the operational
4.1 Challenges with high DG in a low costs [24].
inertia system
The inertial response of the power system is an inherent physical 4.3 Low frequency demand disconnection
response of synchronous generation to a sudden imbalance in
generation and load [59]. Converter-fed equipment that is used During extreme contingencies, that is, those that are more
today is fundamentally different from a synchronous machine severe than normal design contingencies, the scheduled fre-
in that it does not have a rotating mechanical mass that is syn- quency response holding may be insufficient to cover demand,
chronously coupled with the electrical network. Therefore, it causing frequency to fall outside of operational limits. To pre-
does not provide inertia [60]. With a low inertia comes a higher vent reaching underfrequency protection limits of generating
rate of change of frequency (RoCoF) during a power imbal- equipment and collapse of system frequency, in many coun-
ance [61] that can cause unintended operation of DG protec- tries an under-frequency load shedding (UFLS) scheme is in
tion systems. Faster frequency response and reserve services are place to automatically disconnect blocks of demand with the
therefore required, and conventional frequency response ser- aim of restoring system frequency and allowing a new equilib-
vices become unsuitable [62]. In addition, low inertia and high rium to be reached. In GB, UFLS is known as Low Frequency
DG challenge the operation of existing systems embedded in Demand Disconnection (LFDD). As DG penetration increases
the distribution network which influence the resilience of the and demand is increasingly met locally, the effectiveness of the
whole system. LFDD scheme is challenged, and its level of success becomes10 GORDON ET AL.
dependent on the demand and generation mix downstream of In addition, another scenario in [70] shows that had all of the
each relay at the time of operation. Without visibility of DG, expected net demand been disconnected by the first stage of
uncertainty is introduced into the amount of true demand on LFDD relays, the frequency would have quickly recovered to
the system at any given time and, therefore, the net effect of within operational limits, saving numerous instructions by the
automatic load shedding on system frequency when activated is system operator for generators to increase their output. Follow-
uncertain. Studies have shown that the LFDD scheme in GB ing the August 9th event, the GB regulator recommended that
can be less effective with low system inertia and with a high a fundamental review of the LFDD scheme is needed taking
penetration of DG, including at today’s levels of installed DG account the impact of DG [63].
capacity [65], [66], Therefore, the settings of the LFDD scheme The event reveals some key questions regarding how the GB
require further review in order to retain its effectiveness such system is operated and the uncertainties with high penetrations
that it can be relied upon in a wide range of system operating of DG including:
conditions.
Theoretical novel approaches for LFDD schemes have been ■ How much DG really tripped from the system, and why?
proposed in the literature which use additional information The amounts of DG lost, for which reasons and at which
and measurements to compute the required load shedding and locations during the event are based on estimates by the
provide an adaptive approach to account for changing system DNOs. This is largely because, many years after signifi-
conditions. However, many of them require an improved mea- cant volumes of DG started to be connected, the DNOs
surement and communication infrastructure in the distribution lack detailed monitoring of it. In their report on the event,
network [67, 68], and there are many practical risks and bar- Ofgem made the following statement regarding lessons
riers that accompany a complete re-design of a scheme that learnt for DNOs: “The DNOs lack of consistent and com-
demands a high dependability. In [66], shorter-term solutions plete information on the operational characteristics and
are evaluated. These include relocating relays to lower voltage performance of distributed generators in response to the
levels, i.e. closer to the bulk of demand, and reducing the time network fault, demonstrates the scale of the visibility issue
delay between LFDD stages. These are argued to be more read- surrounding distributed generation. Significant improve-
ily available solutions and show potential improvements relative ments are required in the data availability, adequacy and
to the present-day scheme. Similar potential solutions are also communication between the DNOs and the ESO to sup-
being investigated by NGESO [69]. port management of system operation. DNOs must have
a much more detailed understanding of their networks in
order to more actively manage them as they transition
4.4 Reflections on the August 9th 2019 GB towards becoming DSOs.” [63].
disturbance ■ Is the “accelerated” programme to change LoM protection
on DG accelerated enough? And will it sufficiently remove
A single lightning strike to an overhead transmission line on the concern of DG tripping off the system unexpectedly?
August 9th 2019 led to the combined loss of two large gen- ■ How much frequency response should be held, and how
erators, Hornsea offshore wind farm and Little Barford gas should variable DG be treated when considering response
plant, as well as a significant loss of DG due to the operation holdings?
of VS, RoCoF or internal protection against under frequency.
The total loss of power infeed from DG is estimated between
1300 to 1500 MW across the event. This can be compared to a 4.5 Effects of DG on short circuit level
total transmission connected generation loss of 1378 MW. Over
the course of the event, frequency response and reserve hold- The short circuit level at any given point in the power system is
ings became exhausted, and the system frequency dropped to the amount of current that would flow if there was a short cir-
48.8 Hz, triggering the first stage of LFDD, and cutting supplies cuit fault at that point. SCL depends on the impedance between
to 1.15 million customers [63]. the fault and sources of fault current, which includes passive
The significant amount of DG that was lost during the elements in the network, for example, lines and transformers, as
August 9th event had substantial ramifications, by both con- well as the capability and behaviour of sources which feed cur-
tributing towards the loss of infeed, and reducing the net effect rent into a fault, for example, generators and motors. During
of the LFDD scheme. It is reported that 892 MW of demand network faults, synchronous and induction machines behave as
was disconnected by stage 1 LFDD relays, yet the net demand a voltage source behind an impedance and provide a high asym-
reduction seen by the transmission system was reported to be metrical fault current which decays over the transient period of
350 MW [63]. This indicates that approximately 550 MW of the fault [71]. The main sources of fault currents in the transmis-
DG was disconnected by LFDD relay operation. Analysis of sion network are large synchronous generators, their response
the event in [70] showed that if the VS LoM protection had is instantaneous, proportionate, and continuous and they can
been removed from the system, preventing the loss of 150 MW provide a short circuit current in the region of 6–7 times their
of DG at the beginning of the event, the system frequency and nominal rating [72].
RoCoF would have remained above the thresholds for the oper- In contrast with synchronous generators, the fault response
ation of LFDD and RoCoF protection settings, respectively. of most converter interfaced devices used in modern powerGORDON ET AL. 11
systems is driven by their control systems and the control strate- 4.5.2 Short Circuit Levels in the transmission
gies in place to interface with the grid. Voltage source converters networks
(VSC) are commonly used and are capable of quickly controlling
the active and reactive current that is exchanged with the grid. In contrast to the main concern on distribution networks, SCL
However, these currents must remain within the limited short- is reducing significantly on many parts of the transmission net-
term rated capability of the power electronic switches. Depend- work in GB with the displacement of large synchronous gen-
ing on the type of converter, fault current contributions are in eration by CIG in both T & D networks, See Figure 4. This
the range of up to 2 or 3 per unit in the first 1 to 2 cycles and reduction in the available SCL in the transmission system can
between 1 to 1.5 per unit thereafter [73, 74]. But, in general, it introduce a broad set of operational challenges which impact
is assumed that the current limiting function is very close to the the resilience of the system to network faults, including increas-
rating of the converter. ing the severity of a voltage depression close to a fault on the
transmission network and compromised performance of pro-
tection systems [80, 81].
4.5.1 Short circuit levels in the distribution Due to the increase in DG, the contribution from the dis-
networks tribution system to the transmission system SCL is generally
increasing. However, this contribution is limited by the high
For DG, in the previous G59 connection code [34] under- impedance of the grid transformers [72], and remedial actions
voltage protection settings were designed to detect a genuine for increasing transmission system SCL are generally expected
fault on the distribution network and then disconnect. How- to be most effective at transmission voltages [82]. Furthermore,
ever, no dynamic fault ride through was required from the DG the amount of any contribution from DG also depends on
plant. In order to support the transmission system during faults, the nature of the DG and how it is controlled. The authors
the newer G99 connection code [35] defines fast fault current note that the vast majority of DG in the system currently
injection requirements for DG, where operation is not required will have been designed according to the earlier G59 require-
beyond 1 per unit of rated current. ments and, therefore, any contribution from DG is difficult
In the distribution networks, the significant amounts of DG to predict and will be subject to whatever the default con-
that have been added have created an increasing trend of SCL, trol system settings are for the individual converter manufac-
where the main challenge is limiting the maximum fault cur- turer at the time of installation. Hence, any contribution from
rent to within the rating of the DNOs’ switchgear. Exceeding DG should not be considered reliable when assessing minimum
these ratings becomes a health and safety and network secu- SCL.
rity risk. Even though CIGs have a relatively low fault current
contribution compared with synchronous generators, new con-
nection applications in the distribution network often trigger
the need to reinforce the DNO switchgear, especially at loca- 5 CONCLUSIONS
tions that already have electrically close synchronous generation,
for example, waste to power or CHP plant, or relatively low This paper has discussed challenges associated with the devel-
impedance connections to a part of the transmission network opment and operation of distributed generation (DG), using
that has high SCL. This can add high costs to connection works Great Britain (GB) as a case study. It has reviewed the amounts
and has become a major constraint to new DG connections in and types of DG that are installed in GB. This analysis high-
many areas in GB [75]. lights that there can be considerable discrepancies between the
Determining the contribution from a DG connection to the available DG data records and that there has been a lack of
SCL is typically done via desktop studies using industry stan- availability and transparency of consistent data for DG instal-
dards IEC60909 [76] or ER G74 [77]. These standards assume lations. This lack of data has been argued to act as an obsta-
static worst-case conditions and, in reality, the switchgear will cle to the development of a more active distribution network
spend a significant amount of time at well below its rating dur- and planning and operating a well-coordinated whole electricity
ing normal operation. Active fault level monitoring has been system.
explored by some of the GB DNOs to release capacity for new The development of DG is a market-led response to
connections and actively manage the network [78, 79], with one government-initiated incentives and reductions in the cost of
DNO proposing to implement this technology into business key technologies, notably wind and solar generation. It promises
as usual in the next price control period from 2023 to 2028 a location of generation that is closer to demand and the poten-
[75]. The fault level monitors will need to communicate in real- tial for many more actors to provide ‘flexibility services’ such as
time to the network operator or an automated system to take the ability to change output to help in management of power
an action to reduce fault level, for example, through network flows or to provide frequency containment reserve. While rel-
reconfiguration. Any actions taken will need to be consistent evant market platforms are now being opened up to service
with those taken for other reasons such as congestion manage- providers that have capacities of less 100 MW, further action
ment, voltage control and provision of frequency containment is needed to address barriers such as limits to the ‘stacking’ of
reserve. revenues.You can also read