The Indonesian Throughflow response to Indo-Pacific climate variability
←
→
Page content transcription
If your browser does not render page correctly, please read the page content below
The Indonesian Throughflow response to Indo-Pacific
                      climate variability
                                 Janet Sprintall, Adèle Révelard

     To cite this version:
    Janet Sprintall, Adèle Révelard. The Indonesian Throughflow response to Indo-Pacific climate vari-
    ability. Journal of Geophysical Research. Oceans, Wiley-Blackwell, 2014, 119 (2), pp.1161 - 1175.
    �10.1002/2013jc009533�. �hal-01496468�

                                 HAL Id: hal-01496468
                https://hal.archives-ouvertes.fr/hal-01496468
                                     Submitted on 3 Jan 2022

    HAL is a multi-disciplinary open access            L’archive ouverte pluridisciplinaire HAL, est
archive for the deposit and dissemination of sci- destinée au dépôt et à la diffusion de documents
entific research documents, whether they are pub- scientifiques de niveau recherche, publiés ou non,
lished or not. The documents may come from émanant des établissements d’enseignement et de
teaching and research institutions in France or recherche français ou étrangers, des laboratoires
abroad, or from public or private research centers. publics ou privés.
                                              Copyright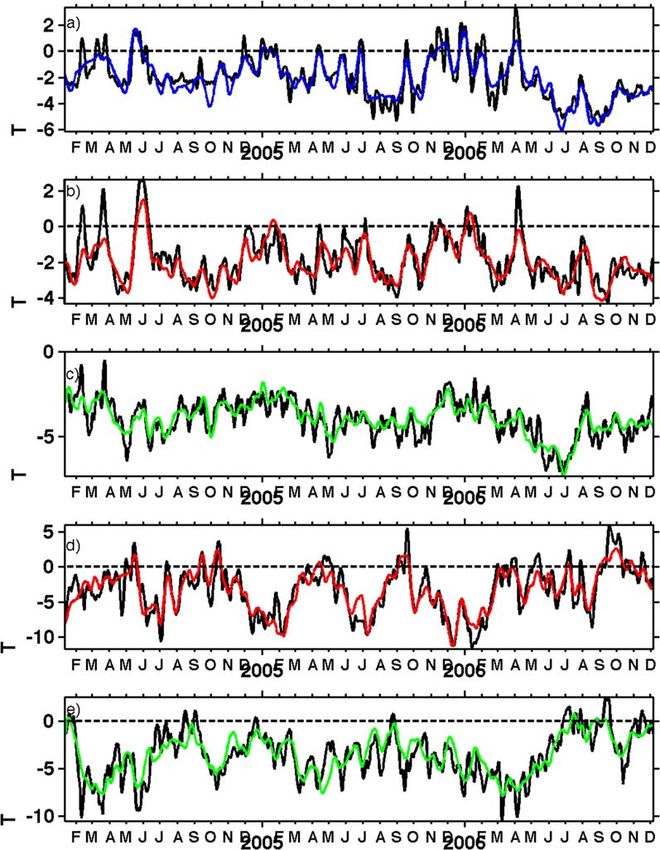
PUBLICATIONS
Journal of Geophysical Research: Oceans
RESEARCH ARTICLE                              The Indonesian Throughflow response to Indo-Pacific climate
10.1002/2013JC009533
                                              variability
Special Section:                                                           velard2
                                              Janet Sprintall1 and Adèle Re
Western Pacific Ocean
                                              1
Circulation and Climate                        Scripps Institution of Oceanography, U.C. San Diego, La Jolla, California, USA, 2LOCEAN/IPSL, Universit
                                                                                                                                                      e Pierre et Marie
                                              Curie, Paris, France
Key Points:
 A proxy 18 year Indonesian
  Throughflow (ITF) transport time
                                              Abstract The Indonesian Throughflow (ITF) is the only open pathway for interocean exchange between
  series is developed                         the Pacific and Indian Ocean basins at tropical latitudes. A proxy time series of ITF transport variability is
 Increased ITF transport related to          developed using remotely sensed altimeter data. The focus is on the three outflow passages of Lombok,
  enhanced Pacific tradewinds since
  early 1990s
                                              Ombai, and Timor that collectively transport the entire ITF into the Indian Ocean, and where direct velocity
 Indian Ocean dynamics dominate              measurements are available to help ground-truth the transport algorithm. The resulting 18 year proxy time
  Pacific ENSO variability in ITF outflow       series shows strong interannual ITF variability. Significant trends of increased transport are found in the
  passages
                                              upper layer of Lombok Strait, and over the full depth in Timor Passage that are likely related to enhanced
                                              Pacific trade winds since the early 1990s. The partitioning of the total ITF transport through each of the
Correspondence to:
 J. Sprintall,
                                              major outflow passage varies according to the phase of the Indian Ocean Dipole (IOD) or El Nin       ~o-Southern
jsprintall@ucsd.edu                           Oscillation (ENSO). In general, Pacific ENSO variability is strongest in Timor Passage, most likely through the
                                              influence of planetary waves transmitted from the Pacific along the Northwest Australian shelf pathway.
Citation:                                     Somewhat surprisingly, concurrent El Nin ~o and positive IOD episodes consistently show contradictory
Sprintall, J., and A. Revelard (2014), The   results from those composites constructed for purely El Nin   ~o episodes. This is particularly evident in
Indonesian throughflow response to
Indo-Pacific climate variability,
                                              Lombok and Ombai Straits, but also at depth in Timor Passage. This suggests that Indian Ocean dynamics
J. Geophys. Res. Oceans, 119, 1161–           likely win out over Pacific Ocean dynamics in gating the transport through the outflow passages during
1175, doi:10.1002/2013JC009533.               concurrent ENSO and IOD events.

Received 21 OCT 2013
Accepted 10 JAN 2014
Accepted article online 15 JAN 2014
Published online 19 FEB 2014                  1. Introduction
                                              The Indonesian Throughflow (ITF) is the leakage of water from the western Pacific into the south-eastern
                                              tropical Indian Ocean through the Indonesian archipelago (Figure 1). As such, the ITF provides the only
                                              major low-latitude oceanic pathway for the transfer of climate signals and their anomalies in the global ther-
                                              mohaline circulation. The volume, heat, and freshwater carried by the ITF are known to impact the state of
                                              the Pacific and Indian Oceans, and modulate regional climate variability through altering the regional air-
                                              sea exchange and precipitation patterns over many time scales [e.g., Nicholls, 1989; Godfrey, 1996; Schneider,
                                              1998; Lee et al., 2002; Vranes et al., 2002; Potemra and Schneider, 2007; Song et al., 2007; Lee and McPhaden,
                                              2008; Tokinaga et al., 2012]. In turn, winds over the Pacific and Indian Oceans as well as the regional Indone-
                                              sian seas impact the ITF through the excitation and propagation of planetary waves [Clarke and Liu, 1994;
                                              Meyers, 1996; Sprintall et al., 2000; Potemra, 2001; Wijffels and Meyers, 2004; McClean et al., 2005].
                                              On annual and longer time scales, the ITF is driven by the large-scale pressure difference that exists
                                              between the Pacific and Indian Ocean basins [Wyrtki, 1987]. The pressure gradient is set up because, on
                                              average, the Pacific easterly trade-winds result in a higher sea level on the western tropical Pacific side of
                                              the Indonesian archipelago compared to the monsoonally regulated sea level in the ITF exit region of the
                                              south-eastern Indian Ocean. Most models and observations suggest a weaker ITF during El Nin     ~o in response
                                              to the Pacific trade-wind relaxations or reversals that subsequently lead to a lower western Pacific sea level
                                              [Clarke and Liu, 1994; Meyers, 1996; Gordon et al., 1999]. The opposite conditions are expected to prevail dur-
                                                       ~a. Pacific Ocean interannual wind anomalies potentially force low-frequency equatorial and off-
                                              ing La Nin
                                              equatorial Rossby waves that interact with the western Pacific maritime boundary to excite a coastally
                                              trapped response that propagates through the Indonesian seas, along the northwest coast of Australia, and
                                              then offshore into the Indian Ocean [Wijffels and Meyers, 2004; McClean et al., 2005; England and Huang,
                                              2005]. Like ENSO, the Indian Ocean Dipole (IOD) appears to influence the ITF transport via remotely forced
                                              Kelvin waves related to the equatorial Indian Ocean wind anomalies [Sprintall et al., 2009; Drushka et al.,

SPRINTALL AND REVELARD                                      C 2014. American Geophysical Union. All Rights Reserved.
                                                             V                                                                                                      1161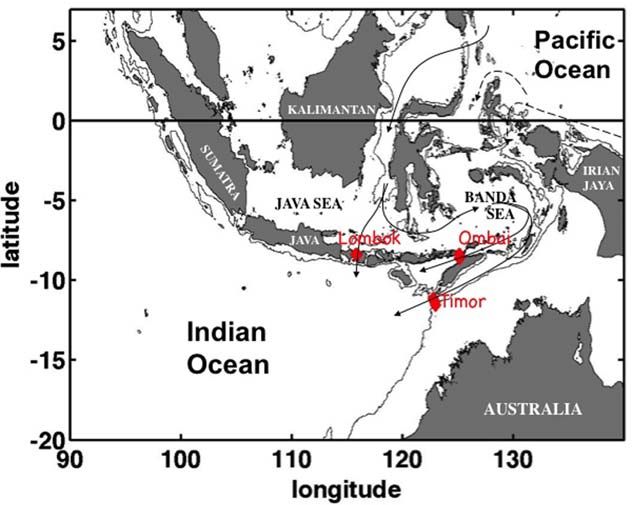
Journal of Geophysical Research: Oceans                                                           10.1002/2013JC009533

                                                                                                              2010]. However, because of the
                                                                                                              frequent concurrence of ENSO
                                                                                                              and IOD events [Murtugudde
                                                                                                              et al., 1998; Saji et al., 1999; Feng
                                                                                                              et al., 2001; Potemra and Schnei-
                                                                                                              der, 2007], it is often difficult to
                                                                                                              tease out the individual effect of
                                                                                                              each climate mode on the ITF
                                                                                                              variability.
                                                                                                                The recent 3 year International
                                                                                                                Nusantara Stratification and
                                                                                                                Transport (INSTANT) program
                                                                                                                provided the first simultaneous
                                                                                                                full-depth velocity and transport
                                                                                                                measurements in the major
                                                                                                                inflow and outflow passages of
                          Figure 1. Map of the Indonesian seas showing pathways of the Indonesian Throughflow    the ITF [Sprintall et al., 2004; Gor-
                          from the Pacific Ocean into the Indian Ocean. Lombok, Ombai, and Timor Straits are the
                          major outflow passages of the ITF where moorings were located as part of INSTANT (red  don et al., 2010]. The INSTANT
                          diamonds).                                                                            time period was characterized by
                                                                                                                a weak warm phase of ENSO (El
                          Nin~o) from the initial deployment in January 2004 until October 2005, followed by a brief cool phase (La
                          Nin~a) until April 2006, with stronger El Nin     ~o conditions occurring until the mooring recovery in December
                          2006. The developing El Nin      ~o conditions in the Pacific during this latter period also coincided with a strong
                          IOD positive phase in the Indian Ocean that terminated in December 2006 to January 2007 [Vinayachandran
                          et al., 2007; Horii et al., 2008]. While the 3 year time series alone is not sufficient to comprehensively resolve
                          the interannual signal, significant transport variability during the INSTANT period was linked to ENSO and
                          the IOD [Sprintall et al., 2009; Gordon et al., 2008]. The strong positive phase of the IOD in late 2006
                          appeared to decrease the ITF transport through the outflow passages at depth, but the transport in the
                          upper 150 m layer was stronger, hence somewhat negating the expected weakening associated with the
                          concurrent 2006 El Nin     ~o [Sprintall et al., 2009]. In contrast, during the 2004 El Nin ~o when the IOD was near
                          zero, the ITF transport was reduced in the upper 150 m surface layer but enhanced at depth. Clearly, the rel-
                          atively short 3 year record makes it difficult to separate the competing remote influences from the IOD and
                          ENSO and thus provide an adequate description of how these low-frequency fluctuations impact the ITF
                          transport. Observational programs such as INSTANT can be logistically difficult and expensive to maintain
                          over time scales long enough to be important to climate variability. The challenge is to develop a proxy
                          measurement of the ITF transport that adequately captures the dominant time scales of throughflow
                          dynamics, and in turn, improves our ability to understand its relationship to longer-term climate variability.
                          Thus, while recent observational and modeling studies have furthered our knowledge of the interannual vari-
                          ability of the ITF, many questions remain unanswered that provide the fundamental drivers of this study. How
                          does the partitioning of the total ITF transport through the major ITF passages vary according to the phase of
                          the IOD or ENSO? Are the changes in transport in response to local or large-scale remote wind forcing? To
                          address these issues, we will develop ITF proxy measurements using the 18 year remotely sensed altimetry
                          record. Our focus is on the three outflow passages of Lombok, Ombai, and Timor, where the direct INSTANT 3
                          year transport measurements are available to help mold and ground-truth the algorithm needed to convert
                          the sea level data to ITF transport information. Together, these three outflow straits comprise the total ITF
                          transport that enters into the southeast Indian Ocean. However, the gating of the total ITF transport through
                          each major outflow passage potentially varies according to the phase of the IOD and/or ENSO, although this
                          has yet to be thoroughly constrained by observations. Each strait transports waters with different temperature
                          and salinity characteristics [Sprintall et al., 2009; Atmadipoera et al., 2009], and consequently each strait will
                          have a different impact on the heat and freshwater transports that enters into Indian Ocean.
                          This paper is organized as follows. Section 2 discusses the data sets used in this study, and section 3
                          describes the partial-linear regression technique used to develop the 18 year proxy time series. Section 4
                          evaluates variability and long-term trends in the transport time series, and also examines how the

SPRINTALL AND REVELARD                  C 2014. American Geophysical Union. All Rights Reserved.
                                         V                                                                                                     1162
Journal of Geophysical Research: Oceans                                                             10.1002/2013JC009533

                           Table 1. Classification of Years When El Ni~
                                                                     no or La Ni~
                                                                                na Events Coincided With
                                                                                                            partitioning of the total ITF transport
                           a Positive or Negative Indian Ocean Dipole (IOD) Event From 1993 Through         through each major outflow passage
                           2010                                                                             varies according to the phase of the
                                              Negative IOD         No IOD event            Positive IOD     IOD or ENSO. A discussion follows in
                           El Ni~
                                no                               2002, 2004, 2009        1994, 1997, 2006   section 5 to assess how these changes
                           No ENSO event         1996          1993, 2001, 2003, 2008
                                                                                                            vary in response to local and large-
                           La Ni~
                                na             1998, 2010      1995, 1999, 2000, 2005         2007
                                                                                                            scale remote wind forcing. Conclu-
                                                                                                            sions follow in Section 6.

                          2. Data
                          The in situ transport data used in this study were measured as part of the INSTANT program (Figure 1).
                          During the 3 year INSTANT deployment period from January 2004 through December 2006, two moorings
                          were deployed in Lombok Strait (sill depth 300 m), two moorings were deployed in Ombai Strait (sill
                          depth 3250 m), and four moorings were deployed in the wider Timor Passage (western sill depth 1890
                          m). Mooring velocity instrumentation was fairly similar on all moorings, with an upward-looking acoustic
                          Doppler current profiler (ADCP) deployed to resolve the surface to lower-thermocline flow and discrete
                          current meters at depth. To estimate the total volume transport through each of these major outflow
                          straits, the velocity profiles were vertically linearly interpolated onto a 10 m depth grid, then laterally
                          interpolated into 1 km bins between the moorings and extrapolated to the strait side-walls using various
                          models (see Sprintall et al., [2009], for more details). In the following analysis, the daily transport values
                          correspond to the ‘‘best’’ interpolation scheme [Sprintall et al., 2009] that use a constant shear model for
                          the missing near-surface layer and a linear cross-passage interpolation scheme. As noted above, in all
                          three passages a clear phase break was observed at 150 m depth where the transport anomalies above
                          and below this depth exhibited opposing directions on interannual time scales [Sprintall et al., 2009]. Ver-
                          tical decomposition of transport profiles in the outflow passages into two modes has previously been
                          suggested using both models [Potemra et al., 2003] and observations [Molcard et al., 2001]. Hence, in the
                          following, separate proxies will be developed for transport integrated over the upper layer (0–150 m) and
                          lower layer (150 m to sill depth). The sign-convention is that transport into the Indian Ocean (i.e., the ITF)
                          is negative.
                          The sea level anomaly (SLA) data used here to develop proxy measurements of the ITF comes from gridded
                          delayed-time maps distributed by Aviso. The version utilized is the reference version (DT-MSLA-‘‘ref’’), in
                          which data sets are based on at least two satellites with the same groundtrack. The daily data are available
                          from October 1992 to January 2011 and have a resolution of 1/3 longitude by 1/3 latitude.
                          The ocean surface wind and pseudostress is provided by NASA’s Cross-Calibrated Multi-Platform (CCMP)
                          project that includes cross-calibrated satellite winds derived from a combination of many radar scatterome-
                          ters [Atlas et al., 2011]. We use the CCMP FLK Level 3.5 wind product that has a resolution of 1/4 longitude
                          by 1/4 latitude and are monthly.
                          To examine the relationship of our proxy ITF time series to large-scale climate modes, we use the weekly
                          ENSO and IOD indices based on sea surface temperature (SST) anomalies. A positive SST anomaly corre-
                          sponds to a warm El Nin  ~o phase and a negative anomaly to a cold La Nin  ~a phase. Typically, an El Nin
                                                                                                                                  ~o event
                          begins in boreal spring and peaks in the following fall/winter, although there are occasional exceptions to
                          this generality (e.g., 1994). To evaluate the corresponding ENSO phase of each month, we use the recent
                          Oceanic Nin~o Index (ONI) from the NOAA Climate Prediction Center that is based on the detrended
                          NINO3.4 SST anomalies centered on 30 year base periods that are updated every 5 years so as to account
                          for longer-term secular trends. For the IOD, we use the index time series based on the difference in SST
                          anomaly between the tropical western and the tropical south-eastern Indian Ocean [Saji et al., 1999] pro-
                          vided by the Japan Agency for Marine-Earth Sciences and Technology (JAMSTEC). A positive IOD event/
                          index corresponds to when the SST is anomalously cold in the eastern Indian Ocean and anomalously warm
                          in the western Indian Ocean. The reverse occurs during negative events. IOD episodes are much more
                          phase locked to the seasonal cycle than ENSO episodes, and typically begin during the monsoon boreal
                          spring transition and peak during the boreal fall. Table 1 lists those years that correspond to negative and
                          positive phases of both the IOD and ENSO.

SPRINTALL AND REVELARD                    C 2014. American Geophysical Union. All Rights Reserved.
                                           V                                                                                                  1163
Journal of Geophysical Research: Oceans 10.1002/2013JC009533
3. Methodology
The idea that ITF transport could be estimated from sea-level differences between the Pacific and Indian
Oceans was first proposed by Wyrtki [1987], who suggested that the large-scale pressure difference
between the two basins provided the forcing of the ITF on annual and longer time scales. The concept was
initially explored in the Indonesian region using sea level differences and patterns from tide gauges [Wyrtki,
1987; Clarke and Liu, 1994]. The advent of the global satellite era provoked further exploration of the rela-
tionship between the altimetric sea level record with the ITF transport determined using both numerical
model output [Potemra et al., 1997; Potemra, 2005], and temperature profiles measured along three expend-
able bathythermograph (XBT) transects within the Indonesian seas [Wijffels and Meyers, 2004]. Such an
approach has also been used or proposed for various moored time series arrays [e.g., Imawaki et al., 2001;
van Sebille et al., 2010; Ferrari et al., 2012]. The strategy of these particular studies was to align their in situ
moored arrays with a collocated altimetric track and develop a transport-local sea level relationship to sub-
sequently extend the observed time series.
In this study, proxy transports are developed using the regional SLA regressed onto the in situ measured ITF
transport within the three major outflow passages of Lombok Strait, Ombai Strait, and Timor Passage [Sprin-
tall et al., 2009]. The obvious advantage in the proposed analysis over the previous proxy ITF studies is that
actual observed ITF transport measurements within the passages are available. Further, in our study we
exploit the premise that it is primarily the large-scale Indo-Pacific pressure gradient that drives the ITF on
interannual time scales [Wyrtki, 1987]. Hence, we develop the relationship using the regional SLA fields
rather than use the locally aligned SLA, which also alleviates the issues of accuracy in the altimetric sampling
near the coast in these relatively narrow passages.
3.1. Technique for Development of Proxy Transports
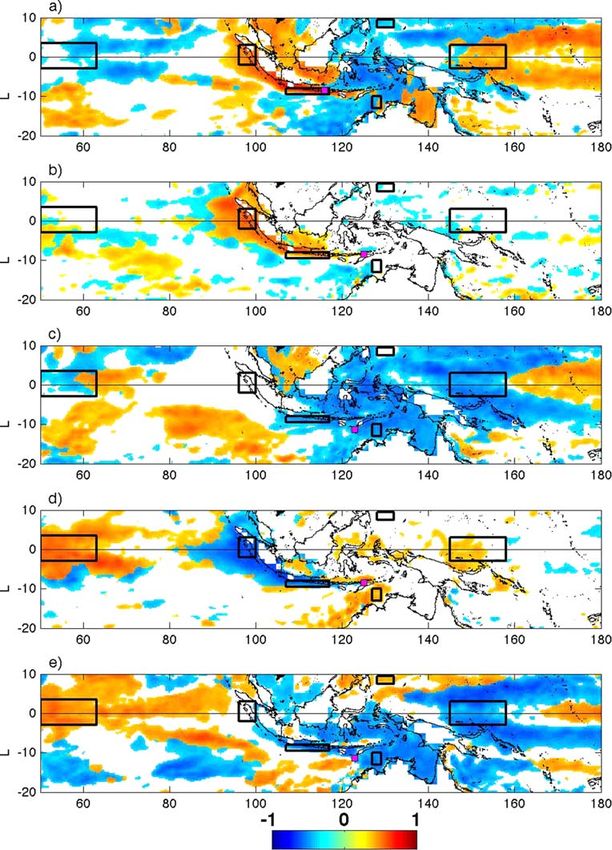
Strong correlations exist between the regional SLA and the INSTANT transport time series in each outflow
passage over the upper 150 m depth layer (Figures 2a–2c) and the layer beneath this (Figures 2d–2e). In the
upper layer, Lombok (Figure 2a) and Ombai (Figure 2b) Straits show very similar correlation patterns, with
highly significant positive correlations in the south-east Indian Ocean along the wave guide of the south
coasts of Sumatra and Java, as well as in the western Pacific region. Positive correlations are of the sense
that an increase in SLA is associated with reduced transport into the Indian Ocean (recall that the ITF trans-
port is negative). In contrast, the upper layer in Timor Passage has little correlation with the south-east
Indian Ocean wave guide, and is mostly negatively correlated with the SLA in the western Pacific and inter-
nal Indonesian seas, suggesting a stronger ITF corresponds to higher sea level (Figure 2c). This relationship
holds in the western Pacific for the lower layer of Timor Passage (Figure 2e), while in the Indian Ocean the
positive correlation suggests a reduced ITF with higher sea level, as in the lower layer of Ombai Strait (Fig-
ure 2d).
Similar to that found by Potemra [2005], the highest transport-SLA correlations (Figure 2) generally occur in
regions of known dynamical influence on ITF variability through remote and local wind forcing. As suc-
cinctly put by Wijffels and Meyers [2004], this likely reflects the fact that the Indonesian seas lie at an ‘‘inter-
section of oceanic waveguides’’ from the Pacific and Indian Oceans. Six regions are identified that
consistently showed the strongest transport-SLA correlations (Figure 2). We exploit this tight relationship
through the linear, lagged partial regression model,
0
XX
QITFðtÞ 5 aij gi ðt2dtj Þ (1)
i j
to develop a proxy-ITF transport time series Q’ITF that at time t is expressed as a sum of the average sea level
anomaly in each box gi at time lag dtj with coefficients aij representing the respective weight of the ith SLA
box at the jth time lag. All transport and sea level time series were demeaned and normalized to have unit
variance before performing the least squares fit, so the coefficients represent the transport change associ-
ated with a one-unit standard deviation change in the sea level time series. The coefficients and lags were
determined from a least squares fit of the 3 year upper (0–150 m) and lower (150 m—sill depth) layer
INSTANT transport in each of the three passages with, in the first instance, the sea level in all six boxes. A
broad range of time lags was applied covering from 140 days which is roughly equivalent to the time Pacific
SPRINTALL AND REVELARD C 2014. American Geophysical Union. All Rights Reserved.
V 1164Journal of Geophysical Research: Oceans 10.1002/2013JC009533
sea level signals take to
reach the eastern Indian
Ocean [Masumoto and
Meyers, 1998; Wijffels and
Meyers, 2004] to 0 days
(i.e., immediate local
response). Note that by
including all possible sea
level boxes and time
lags, we are able to
reproduce the observed
INSTANT transport series
nearly perfectly. How-
ever, then the prediction
becomes too tuned to
the variability captured
at the same frequencies
as occur in the observed
training data set, and so
become unreliable for
developing longer-term
proxies for studies of
low-frequency variability.
In our methodology, the
skill of the contributed
fit from each sea level
box and lag combination
was assessed through
standard t tests that
determine significance
of each coefficient fol-
lowed by application of
boot-strapping techni-
Figure 2. (a) Maximum correlation between SLA and INSTANT transport through (a) Lombok, (b) ques [Efron and Gong,
Ombai, and (c) Timor over the 0–150 m depth layer; and transport through (d) Ombai and (e) Timor
from 150 m to the sill depth. Moorings in each strait are marked by a magenta square. Boxes show
1983] that reduce the
regional SLA used in forming the proxy transports. size of the training data
set to test sensitivity of
the derived regression coefficients. In the end, this resulted in each transport time series through the three
passages typically represented by three to four terms in equation (1) that represented the lags and regional
boxes that had the strongest correlations. As discussed below, in nearly all cases these optimal lags and
regional boxes also made sense from a dynamical point of view.
The resulting best fit linear prediction model given by equation (1) does a good job of capturing the low-
frequency variability and shows significant correlations of 0.8 with the respective observed time series in
each strait (Figure 3). The best agreement occurs in the shallower Lombok Strait where the total amount of
variance accounted for by the lagged partial regression model is 80% (Figure 3a). Here sea level in the
region south of Java at zero lag (aSJ,0 5 1.26) and in the equatorial Indian Ocean at 120 day lags
(aIND,120 5 20.75) influence the transport variability in the shallow Lombok Strait emphasizing the impor-
tance of Indian Ocean processes. In Ombai Strait, the lagged model accounts for 70% of the total variance
in both the upper (Figure 3b) and lower layer (Figure 3d) transport. As in Lombok Strait, sea level south of
Java has the strongest correlation with transport variability in the upper (aSJ,7 5 0.88) and lower
(aSJ,14 5 1.66) layers, with the lags consistent with the phasing of the passage of Kelvin waves from south of
Java into Ombai Strait. Somewhat surprisingly, the deeper layer in Ombai Strait is also influenced by sea
level variability near Darwin at 21 day lag (aDAR,21 5 20.66), and has a relatively quick response to sea level
variability 14 days earlier in the western Pacific (aWP,14 5 0.74). Consistent with the Pacific Ocean wave guide
SPRINTALL AND REVELARD C 2014. American Geophysical Union. All Rights Reserved.
V 1165Journal of Geophysical Research: Oceans 10.1002/2013JC009533
influence along the north-
west Australian shelf [Wijf-
fels and Meyers, 2004], in
Timor Passage the sea level
variability near Darwin
influences the upper layer
transport (Figure 3c) on rel-
atively short time lags of 7
days (aDAR,7 5 20.85) and
the lower layer (Figure 3e)
on longer time scales
(aDAR,120 5 21.17), while
the western Pacific sea
level variability influences
the deep Timor transport
over a range of time lags
(aWP,0 5 20.92 to
aWP,120 5 20.5). Including
the sea level variations
from the Indian Ocean and
south of Java only margin-
ally improved the skill of
the prediction in Timor’s
lower layer, but made a
significant contribution to
the upper layer
(aSJ,7 5 0.93). Although
included in Wyrtki’s [1987]
original analysis, sea level
variability at Davao had
negligible influence on
transport through all the
Figure 3. Time series of observed (black) and predicted (color) transports (Sv) in (a) Lombok, (b) outflow passages.
Ombai, and (c) Timor over the depth range 0–150 m; and (d) Ombai and (e) Timor over the depth
range from 150 m to sill depth during the INSTANT program (2004–2006). The derived coefficients
from the multiregression
models (1) are then
applied to the SLA from the identified binned regions at the optimized lags to extend the proxy time series
to the length of the altimeter mission record (i.e., from January 1993 through January 2011).
3.2. Comparison of the Proxy Transport With Independent Observations
There exist relatively few in situ measurement time series in the outflow passages other than the INSTANT
program with which to independently validate our proxy transports. Over the time span of the proxy trans-
ports, only Ombai Strait [Molcard et al., 2001] provides some data for comparison, although as discussed
below, there are some issues that complicate direct comparison with the derived proxy time series.
Ombai Strait transport was measured by a mooring deployed from December 1995 through November
1996 [Molcard et al., 2001]. The single mooring was deployed at the same location as the Ombai South
mooring deployed during INSTANT, and as such should capture the main core of the ITF that lies in the
southern part of Ombai Strait [Sprintall et al., 2009]. However, the reversals associated with the eastward
flowing South Java Current and Undercurrent system that hug the northern walls of Ombai Strait that were
captured by the Ombai North mooring during INSTANT [Sprintall et al., 2010] would be missed by the single
mooring in 1996. In addition, the vertical resolution of the velocity-measuring instruments distributed along
the mooring line in 1996 was not as dense as during INSTANT, in particular during 1996 only two current
meters were located below 150 m at 1020 m and 1220 m (compare Figure 3 in Molcard et al. [2001] with
Figure 3 in Sprintall et al. [2009]). The transport from the 1996 Ombai mooring velocity data was estimated
SPRINTALL AND REVELARD C 2014. American Geophysical Union. All Rights Reserved.
V 1166Journal of Geophysical Research: Oceans 10.1002/2013JC009533
a) using the same vertical and
cross-passage interpolation
Transport (Sv)
0 scheme as applied to the
INSTANT time series used to form
−5
the proxy (see section 2), and
−10 integrated over the upper 150 m
D J F M A M J J A S O N (Figure 4a) and from 150 m to sill
1996 depth (Figure 4b).
b)
Transport (Sv)
Despite the apparent short-
0 comings of the comparison, the
1996 Ombai transport and the
−5 concurrent predicted proxy trans-
port time series show very similar
−10
patterns, with significant correla-
D J F M A M J J A S O N
1996 tions of 0.68 in the upper layer
and 0.51 in the lower layer. The
Figure 4. (a) Upper layer (0–150 m) and (b) lower layer (150 m—sill depth) predicted mean and standard deviations
proxy (red) and observed (black) transport in Ombai Strait in 1996.
over the complete time period
are 21.8 6 0.9 Sv proxy transport
and 21.3 6 0.9 Sv observed transport for the upper layer, and 24.2 6 2.8 Sv proxy transport and 22.9 6 1.4
Sv observed transport for the lower layer. The poorer agreement with the lower layer largely stems from
the beginning of the record, when the predicted proxy transport is nearly twice that of the observed trans-
port in December 1995 (Figure 4b). This period coincides with the arrival of a Kelvin wave in Ombai Strait
[Molcard et al., 2001] and the transport reversal associated with the wave is evident in both the observed
and predicted transport in the upper layer (Figure 4a). The significantly larger predicted transport in the
lower layer is consistent with that observed in Ombai Strait during INSTANT, when during Kelvin wave
events the main core of the westward flowing ITF extends from 150 m to 600 m [Sprintall et al., 2009]. It is
likely that the vertical instrument configuration during the 1996 observation period missed this contribution
from the deeper ITF and so somewhat underestimates the lower layer transport (Figure 4b).
4. Transport Variability
Our goal is to use the resultant 18 year ITF proxy time series to investigate the dominant time scales of
throughflow dynamics and improve our understanding of the response of the ITF to interannual climate
modes such as ENSO and IOD. In this section, we first compare the seasonal cycle based on the annual and
semiannual harmonics from this 18 year proxy time series with the 3 year INSTANT time series. Our focus is
then on the longer term variability, and we form ‘‘interannual’’ anomalies by removing the seasonal cycle
and low pass (180 days) filtering the proxy time series. The resultant time series is used to examine long-
term trends, as well as an attempt to tease out how the partitioning of the total ITF transport through each
of the major outflow passage varies according to the phase of the IOD or ENSO.
4.1. The Seasonal Cycle
The circulation and transport within the Indonesian seas has a large seasonal variation due to the influence
of the reversing annual wind patterns associated with the Asian-Australian monsoon system [Clarke and Liu,
1993; Masumoto and Yamagata, 1996; Sprintall et al., 2009]. Relatively dry winds blow from the southeast
across the region during the Southeast Monsoon (SEM) of June–August, while moist warm air blows from
the west during the Northwest Monsoon (NWM). Between these times, the monsoon transition is marked
by westerly wind bursts as the intertropical convergence zone crosses the equator in both the Pacific and
the Indian Oceans.
In the upper 150 m, there is generally good agreement between phases of the seasonal cycle from the 3 year
INSTANT time series and that from the predicted 18 year proxy time series (Figure 5). It is important to note
that there is no reason to expect perfect agreement, since the two time series differ in length and cover differ-
ent phases of the ENSO and IOD cycles that likely modulate the phenology of the seasonal transport. Maxi-
mum transport in the upper layer occurs during the peak of the SEM in Timor Passage, and at the end of the
SPRINTALL AND REVELARD C 2014. American Geophysical Union. All Rights Reserved.
V 1167Journal of Geophysical Research: Oceans 10.1002/2013JC009533
a) SEM in Lombok (August–Septem-
ber) and Ombai (September–
0
October). The semiannual signal is
Transport (Sv)
−2
not quite as enhanced in the
upper layer of the predicted Lom-
−4 bok and Ombai Strait annual cycle
(Figure 5a). Transport through the
−6 deeper Ombai Strait is minimum
J F M A M J J A S O N D
during the monsoon transition
b) periods of April and September
0 when the downwelling Wyrtki jets
Transport (Sv)
−2 reverse the transport at depth
−4
(Figure 5b). Although the phasing
of the deep semiannual signal is
−6
quite good, differences in magni-
−8
tude of 1–2 Sv occur between
−10
J F M A M J J A S O N D the observed and proxy trans-
ports during these semiannual
c) peaks (Figure 5b). The predicted
0
and INSTANT transport of the
Transport (Sv)
−5 lower layer of Timor Strait agree
well, and the proxy time series
−10
depicts the strong semiannual
−15 signal that shows different phas-
ing with Ombai Strait (Figure 5b).
−20
J F M A M J J A S O N D The full depth transports (from the
addition of the upper and lower
Figure 5. Seasonal time series of predicted (solid) and observed (dashed) transports in
layer transports) show remarkably
Lombok Strait (blue), Ombai Strait (red), and Timor Passage (green) over the depth range
(a) 0–150 m; (b) 150 m to sill depth; and (c) full depth. Seasonal transports are estimated good agreement with the observed
from harmonics with both a semiannual and annual component. Total full depth trans- total transport (Figure 5c).
port summed over all three passages is shown in black in Figure 5c.
4.2. Interannual Variability and Long-Term Trends
Anomalous interannual proxy transport time series were produced by removing the seasonal cycle from the
original time series then low-pass filtering with a 180 day Hamming filter (Figure 6). As noted, the 3 year
INSTANT period (2004 through 2006) was characterized by remarkably similar interannual transport anoma-
lies in all three outflow passages [Sprintall et al., 2009]. However, the 18 year proxy time series shows that
conformity of response in all three passages is not always the case (Figure 6). There are occasional periods
when there is similarity in the variability between any two of the outflow passages, such as upper layer
Lombok and Ombai transport from 1995 through 1999, upper layer Timor and Lombok transport from 2004
through 2010, and lower layer Timor and Ombai transport from 1996 through 1999 (Figure 6). Then there
are other periods when there is very little conformity in transport variability between any of the passages.
The relationship of this transport variability to ENSO and IOD phases will be discussed in section 4.3.
There is a considerable change in the characteristics of the transport through Lombok Strait from 2006
through 2010 (Figure 6a). In particular, stronger episodic transport into the Indian Ocean occurred in 2006,
2008, and 2009 after a prolonged period of weak variability in the earlier part of the decade. This latter period
also directly coincides with a dramatic change in the velocity upstream in Makassar Strait, when the core of
subsurface velocity maximum shoaled from 140 m to 70 m depth and also substantially strengthened,
resulting in a 47% increase in transport [Gordon et al., 2012]. After a drawn-out period of mild El Nin ~o like con-
ditions in the early decade of the 21st century, Gordon et al. [2012] attributed the change in the vertical profile
as a response to the return of stronger contrasting La Nin ~a and El Nin~a transitions in 2006. It is likely that the
change in the nature of the transport downstream through Lombok Strait is due to the same phenomena.
In the mid-1990s, the tropical Pacific easterlies strengthened and this intensification is thought responsible
for the rising sea level trend in the western tropical Pacific observed in both the AVISO sea level and
SPRINTALL AND REVELARD C 2014. American Geophysical Union. All Rights Reserved.
V 1168Journal of Geophysical Research: Oceans 10.1002/2013JC009533
a) regional tide gauge records [Mer-
1 rifield, 2011]. Since it is this higher
Transport (Sv)
0.5 Pacific sea level that is thought to
0 drive the ITF on annual and lon-
−0.5 ger time scales [Wyrtki, 1987], we
−1 might expect an increased ITF
−1.5 transport over the 20 year period,
94 95 96 97 98 99 00 01 02 03 04 05 06 07 08 09 10 11 as suggested by a suite of ocean
data assimilation products and
4
b) ocean models [Lee and McPha-
den, 2008; Merrifield et al., 2009;
Transport (Sv)
2 Lee et al., 2010; Merrifield and
Maltrud, 2011]. A significantly
0 increased ITF transport of 0.6
Sv over the 18 year time period is
−2
observed in both the upper layer
94 95 96 97 98 99 00 01 02 03 04 05 06 07 08 09 10 11 of Lombok Strait and Timor Pas-
sage (both passages have linear
c) trends of 20.04 6 0.003 Sv per
4 year), with a similar increase
Transport (Sv)
2
observed in the lower layer of
Timor Passage (20.042 6 0.003
0
Sv per year) (Figure 6). However,
−2 a decrease in ITF transport in
−4 both the upper and lower layers
94 95 96 97 98 99 00 01 02 03 04 05 06 07 08 09 10 11
of Ombai Strait of 0.5 Sv
(0.03 6 0.001 Sv per year) and
Figure 6. Time series of predicted transports in Lombok Strait (blue), Ombai Strait (red),
and Timor Passage (green) over the depth range (a) 0–150 m; (b) 150 m to sill depth; and 2.5 Sv (0.135 6 0.003 Sv per
(c) full depth. Total full depth transport summed over all three passages is shown in black year) also occurs over the 18 year
in Figure 6c.
period, respectively. Subse-
quently, there is only a small decrease of 0.5 Sv in total ITF transport through all three passages over the 18
year period.
4.3. Response to ENSO and IOD Phase
As a first step toward teasing out the potential partitioning of the transport through each outflow strait in
response to the phase of ENSO and the IOD, composites of the transport time series were formed according
to whether the period consisted of either solely an El Nin~o or La Nin~a event, or of a coincident El Nin
~o (La
~a) event with a positive (negative) IOD phase (Table 1). In the 18 year time series, there were no coinci-
Nin
dent El Nin~o events with negative IOD events, and only one year had a coinciding La Nin ~a and IOD positive
event (Table 1), so given the relatively small sample size, we will not discuss the transport response of the
ITF during these concurrent phases. Both IOD and ENSO phases typically begin in the boreal spring and
peak (ENSO) or terminate (IOD) in the boreal winter. Once ENSO peaks, the processes that facilitate the
event’s demise the following spring tend to kick in [McGregor et al., 2013]. Hence, in order not to introduce
any alias due to these competing terminating processes, the composites will be constructed to span from
July through December. The long-term trend of each time series (e.g., Figure 6) was removed before form-
ing the composites.
In the upper 150 m, transport through both Lombok and Timor Passage is significantly reduced during El
Nin~o events (Figure 7a). However, in Ombai Strait, the reduction in the upper layer is not significant (red
bars in Figure 7a show the standard error of the mean passes through zero), while in the deeper layer below
150 m the transport is 0.5 Sv stronger than normal during El Nin~o events (Figure 7b). The competing impact
of the transport changes in both the upper and lower layer cancel out any anomalous transport changes in
the total transport (Figure 7c). Subsequently, the expected response of a reduced total ITF to the relaxation
in the Pacific wind field during El Nin~o events [Wyrtki, 1987] occurs only in the upper layer of Lombok and
Timor. A time series of the composite suggests this begins in October, around 5 months following the onset
SPRINTALL AND REVELARD C 2014. American Geophysical Union. All Rights Reserved.
V 1169Journal of Geophysical Research: Oceans 10.1002/2013JC009533
a) d) ~o event and contin-
of an El Nin
1.5 1.5
ues until the following boreal
1 1 spring (not shown). In contrast,
Transport (Sv)
0.5 0.5 when an El Nin ~o event coincides
0 0 with a positive IOD event, the
transport through all three straits
−0.5 −0.5
is stronger in the upper 150 m,
−1 −1 particularly Lombok and Ombai
−1.5 −1.5 (Figure 7d), and significantly
Lo Om Ti Lo Om Ti reduced by 0.5 Sv in the lower
b) e) layers below 150 m of both
1.5 1.5 Ombai and Timor Passage (Figure
1 1 7e). In the upper layer of Lombok
Transport (Sv)
0.5 0.5 and Ombai, the enhanced ITF
0 0 begins only one month after the
onset of the positive IOD/ENSO
−0.5 −0.5
event in May, reaches a maxi-
−1 −1 mum around November and
−1.5 −1.5 then quickly diminishes in Janu-
Lo Om Ti Lo Om Ti ary (not shown). In the lower
c) f) layer of both Ombai and Timor,
1.5 1.5 the reduced ITF begins around
1 1 July, is maximum around Decem-
Transport (Sv)
0.5 0.5 ber and returns to normal the fol-
lowing February. These timings
0 0
are consistent with positive IOD
−0.5 −0.5
phases [Saji et al., 1999].
−1 −1
~a events,
In the case of solo La Nin
−1.5 −1.5
there is significantly more trans-
Lo Om Ti Lo Om Ti
port through Timor Passage in
Figure 7. Anomalous transport through Lombok (Lo), Ombai (Om), and Timor(Ti) during both the upper 150 m (Figure 8a)
(left) solo El Nino events and (right) coincident El Ni~
no and positive IOD events over the and below 150 m (Figure 8b),
(a and d) upper 150 m depth, (b and e) from 150 m to sill depth, and (c and f) full depth. with a total anomalously strong
The red lines indicate standard error for each estimate.
transport of 1.0 Sv (Figure 8c).
There is no significant impact of solo La Nin ~a events on the transport through either Lombok or Ombai
Straits. When La Nina events coincide with negative IODs, there is reduced transport in the upper layer of
all three straits, but particularly Timor Passage (Figure 8d) and stronger transport at depth through Ombai
Strait and weaker transport at depth through Timor Passage (Figure 8e). However, since there are only two
years when these events coincide (Table 1), the error bars are large and the results should be treated with
caution.
5. Relationship of Transport to Winds and Large-Scale Forcing
The relationship of the ITF transport variability to the remote wind forcing from the Indian and Pacific
Oceans during concurrent ENSO and IOD events has received much attention from numerical modelers
[e.g., Murtugudde et al., 1998; Feng et al., 2001; England and Huang, 2005; Potemra and Schneider, 2007].
Equatorial boxes of wind stress anomalies in the Indian Ocean and Western Pacific Ocean show that during
concurrent ENSO and IOD events (Table 1), the wind stresses are correlated but out of phase (Figure 9)—a
modulation of the Walker circulation. This partial anticorrelation between Pacific and Indian equatorial zonal
winds can result in a partial cancellation of the wind effect on the ITF transport: the anomalous Indian east-
erlies and Pacific westerlies both tend to drop dynamic height in the ITF region, and thus the large-scale
pressure gradient driving the ITF may not be much affected. However, during these concurrent events the
Pacific wind changes are much weaker compared to those in the Indian Ocean, sometimes by as much as
50%, suggesting that the partial cancellation effect may not be the complete story.
SPRINTALL AND REVELARD C 2014. American Geophysical Union. All Rights Reserved.
V 1170Journal of Geophysical Research: Oceans 10.1002/2013JC009533
a) d) Examination of the spatial pat-
1.5 1.5
terns of SLA and zonal wind
1 1 stress anomalies during ENSO
Transport (Sv)
0.5 0.5 and IOD events in boreal fall
0 0 (September through November)
better illustrates the large-scale
−0.5 −0.5
variability and here we suggest
−1 −1
how this variability imparts on
−1.5 −1.5 the observed patterns of ITF
Lo Om Ti Lo Om Ti transport. During solo El Nin ~o
b) e) events, as expected the SLA pat-
1.5 1.5
tern is dominated by an eastward
1 1 positive sea level gradient in the
Transport (Sv)
0.5 0.5 tropical Pacific (Figure 10a), while
0 0 the zonal winds are out of phase
but of near equal anomalous
−0.5 −0.5
strength in the Pacific and Indian
−1 −1
Oceans leading to divergence
−1.5 −1.5 and suppressed precipitation
Lo Om Ti Lo Om Ti over the Indonesian archipelago
c) f) [Meyers et al., 2007]. During these
1.5 1.5 solo El Nin~o periods, there is
1 1 reduced upper layer flow in both
Transport (Sv)
0.5 0.5 Lombok and Timor Straits (Figure
0 0 7a). This expected response of
the ITF transport to El Nin~o con-
−0.5 −0.5
ditions is likely driven by the low-
−1 −1 frequency Pacific wind stress curl
−1.5 −1.5 variability generating Rossby
Lo Om Ti Lo Om Ti waves that induce coastal-
trapped waves propagating pole-
Figure 8. Anomalous transport through Lombok (Lo), Ombai (Om), and Timor(Ti) during
(left) solo La Ni~
na events and (right) coincident La Ni~
na and negative IOD events over the
ward along the coast of Irian Jaya
(a and d) upper 150 m depth, (b and e) from 150 m to sill depth, and (c and f) full depth. and North-west Australia through
The red lines indicate standard error for each estimate. Timor Passage, as well as west-
ward through the Banda Sea and
into Lombok Strait [Clarke and Liu, 1994; Meyers, 1996; Potemra, 2001; Wijffels and Meyers, 2004]. During con-
current El Nin ~o and positive IOD episodes there are significantly stronger easterly winds evident in the east-
ern equatorial Indian Ocean (Figure 10d). These winds have resulted in the lower sea level evident along
the Sumatra and Java coasts (Figure 10c) as a result of upwelling Kelvin waves [e.g., Sprintall et al., 2009]
and/or due to offshore Ekman transport [Potemra and Schneider, 2007]. In either event, both phenomena
would act to enhance the upper layer transport (e.g., Figure 7d). The weaker transport at depth is likely in
response to the intermittent but strong downwelling Kelvin waves, such as occurred during the 2006 co-
IOD and ENSO episodes [Horii et al., 2008].
~o events, during solo La Nin
In contrast to solo El Nin ~a events there is only marginal impact on the SLA
patterns across the tropical Pacific (Figure 11a) in response to the stronger easterlies during this ENSO
phase (Figure 11b). Interestingly, there is slightly higher SLA in the latitude bands around 5–10 (Figure
11a) that could possibly be related to off-equatorial Rossby waves driving significantly stronger transport
through Timor Passage during these events (Figures 8a and 8b) [e.g., McClean et al., 2005]. During con-
current La Nin~a and negative IOD events, there is a strong SSH response in both the Pacific and Indian
Ocean basins (Figure 11c) compared to solo La Nin ~a events (Figure 11a), with higher SLA evident
throughout the Indonesian archipelago. In the tropical Indian Ocean, the anomalous westerly winds
force downwelling Kelvin waves that reverse the transport in the upper layer of the outflow passages
(Figure 8d).
SPRINTALL AND REVELARD C 2014. American Geophysical Union. All Rights Reserved.
V 1171Journal of Geophysical Research: Oceans 10.1002/2013JC009533
0.8
Eq. Indian Ocean
0.6 Eq. West Pacific
Pseudo Zonal Wind Stress (m /s2)
0.4
2
0.2
0
−0.2
−0.4
−0.6
−0.8
−1
−1.2
92 93 94 95 96 97 98 99 00 01 02 03 04 05 06 07 08 09 10
Figure 9. Equatorial pseudo zonal wind stress (m2 s22) in the western Pacific (red) and Indian Ocean (blue).
10 10
0 0
−10 −10
−20 0 20
10 10
0 0
−10 −10
80 100 120 140 160 180 200 80 100 120 140 160 180 200
−1 −0.5 0 0.5 1
Figure 10. (top) Sea level (cm) and (bottom) pseudo zonal wind (m2 s22) stress anomalies in September–November during (left) El Ni~
no
events and (right) concurrent El Ni~
no and positive IOD events.
10 10
0 0
−10 −10
−20 0 20
10 10
0 0
−10 −10
80 100 120 140 160 180 200 80 100 120 140 160 180 200
−1 −0.5 0 0.5 1
Figure 11. (top) Sea level (cm) and (bottom) pseudo zonal wind stress (m2 s22) anomalies in September–November during (left) La Ni~
na
events and (right) concurrent La Ni~
na and negative IOD events.
SPRINTALL AND REVELARD C 2014. American Geophysical Union. All Rights Reserved.
V 1172Journal of Geophysical Research: Oceans 10.1002/2013JC009533
6. Conclusions
An 18 year proxy ITF transport time series was developed using a linear, lagged partial regression relationship
from a 3 year observed transport time series through each of the three main outflow passages—Lombok,
Ombai and Timor—and the regional SLA variability. Our approach exploited the relationship between the ITF
transport and the large-scale Indo-Pacific sea level gradient that Wyrtki [1987] suggested as being wind-driven,
although Andersson and Stigebrandt [2005] suggest the gradient may be a result of stratification differences.
The proxy time series was used to examine long-term changes in the ITF transport, how the partitioning of the
total ITF transport through each of the major outflow passage varies according to the phase of the IOD or
ENSO, and how these changes vary in response to local and large-scale remote wind forcing.
Overall, only Timor Passage consistently behaved as expected under ENSO conditions: weaker transport
was observed in the upper layer during composite El Nin ~o events, and stronger transport was observed in
both upper and lower layer transport during composite La Nin ~a events. This Timor-Northwest Australian
shelf pathway for low-frequency Pacific forcing has been identified in the past in relationship to ENSO vari-
ability [e.g., Meyers, 1996; Wijffels and Meyers, 2004; McClean et al., 2005; England and Huang, 2005], and
more recently in relationship to the transmission of decadal time-scale thermocline and sea level anomalies
[Schwarzkopf and Bo €ning, 2011]. In addition, trends showed a significant increase in transport through Timor
Passage over the past 18 years, most likely in response to the increase in sea level and strengthening trade
winds in the western Pacific that have been recorded since the early 1990s [Lee and McPhaden, 2008; Merri-
field, 2011; Merrifield and Maltrud, 2011; Feng et al., 2011]. However, on decadal and longer time scales,
numerous studies have suggested that there is likely to be a weakening of the Walker Circulation in
response to a warming climate [Vecchi et al., 2006; Held and Soden, 2006; Tokinaga et al., 2012] and that this
should act to diminish the size and strength of the ITF [Wainwright et al., 2008; Sen Gupta et al., 2012], result-
ing in a shoaling thermocline with cooling on the corresponding isopycnal surfaces in the Indian Ocean
[Alory et al., 2007; Wainwright et al., 2008]. Our results suggest that this large-scale Pacific driven variability
will most strongly impact the outflow through Timor Passage that lies along the main transmission pathway
from the Pacific.
In Lombok Strait, similar to Timor Passage the upper layer transport decreased in response to El Nin ~o
events, however there was no transport response at all in Lombok Strait during La Nin ~a events. There was
also a significant increase in transport in Lombok Strait over the 18 year transport record, and in particular,
substantial transport increases were evident during the 2006–2010 period. As noted above, this latter vari-
ability is most likely related to upstream changes in the nature of the flow through Makassar Strait [Gordon
et al., 2012]. Interestingly Gordon et al. [2012] attributed the change in the Makassar Strait profile as being
ENSO induced: during El Nin ~o episodes there is enhanced flow of freshwater from the Sulu Sea into the sur-
face layer of the Sulawesi Sea that acts to block the inflow of warm Pacific surface water resulting in a
deeper, cooler velocity core into Makassar Strait, while during La Nin ~a episodes there is little input from the
Sulu Sea leading to an increase and shoaling of the warm Pacific water into Makassar Strait. Such a direct
~a events,
link to ENSO variability is not as clear in the Lombok Strait transport, especially in relation to La Nin
although this may be because of the stronger influence of IOD episodes on Lombok Strait variability, as dis-
cussed further below. However, it is clear that the increase in Lombok transport into the Indian Ocean
occurred in tandem with the enhanced inflow via Makassar Strait, and furthermore it is evident that much
of this additional inflow exited via Lombok Strait as opposed to via Ombai Strait, which was characterized
by a decrease in transport over this same period.
It is worth explicitly pointing out that we also examined our ITF time series for any correlation or coherence
with central Pacific or so-called Modoki El Nino [Ashok et al., 2007]. However, there was a near-zero relation-
ship between the ITF transport through any of the outflow passages and a Modoki El Nin ~o index. Actually,
this is not so surprising since warm events that peak in the central/western Pacific typically show negligible
thermocline depth anomalies, so that the recharge/discharge processes often associated with ENSO events
are weak or absent [Capotondi, 2013]. Since these processes are intimately linked to the large-scale sea level
gradient that drives the ITF on interannual time scales, this gels with the lack of response in ITF transport
variability to Modoki El Nin ~o conditions.
Even with an 18 year time series, we were unable to cleanly separate out the impact of ENSO from IOD vari-
~o events that
ability on the transport through the exit passages. This is primarily because of the six El Nin
SPRINTALL AND REVELARD C 2014. American Geophysical Union. All Rights Reserved.
V 1173Journal of Geophysical Research: Oceans 10.1002/2013JC009533
occurred over the 18 years, three co-occurred with positive IOD events, and of the six La Nin ~a events only
two co-occurred with negative IOD events so limiting their statistical dependability. In addition, the differ-
ent responses are also likely dependent on the strength of the events. For example, stronger El Nin ~os are
~os tend to be weaker [Kug and Kang, 2006]. None-
thought to initiate positive IOD events, while solo El Nin
theless, those composites composed of concurrent El Nin ~o and positive IOD episodes consistently showed
contradictory results from those composites constructed for purely El Nin ~o episodes. This is particularly evi-
dent in Lombok and Ombai Straits, but there is also a significantly strong response at depth in Timor Strait.
This suggests that Indian Ocean dynamics likely win out over Pacific Ocean dynamics in gating the collec-
tive transport through the outflow passages during concurrent ENSO and IOD events.
Our study concludes with an important caveat: full-depth velocity and property measurements are still
needed in the outflow passages to verify these proxy transports and to obtain the climatically meaningful
direct estimates of the heat and freshwater transport profiles into the Indian Ocean. Such measurements
are presently underway in Ombai Strait and Timor Passage (S. Wijffels, personal communication, 2013). Still,
with such a relatively short record it will likely remain difficult to tease out the competing remote influences
from ENSO and the IOD on the ITF transport variability. Clearly, a longer proxy time series will serve as an
important building block for better assessing long-term climate trends such as the changing Walker Circula-
tion, that are likely to result in a varying ITF that impacts the Indo-Pacific region and beyond.
Acknowledgments References
This work was support by NASA grant
NNX13AO38G. The study was initiated Alory, G., S. E. Wijffels, and G. Meyers (2007), Observed temperature trends in the Indian Ocean over 1960–1999 and associated mecha-
during an internship by Ms. Adèle nisms, Geophys. Res. Lett., 34, L02606, doi:10.1029/2006GL028044.
Revelard at Scripps Institution of Andersson, H.C., and A. Stigebrandt. (2005), Regulation of the Indonesian throughflow by baroclinic draining of the North Australian Basin,
Oceanography in 2012 supported by Deep-Sea Res. I, 52, 2214–2233, doi: 10.1016/j.dsr.2005.06.014.
Ecole Normale Superieure, Paris. We Ashok, K., S. K. Behera, S. A. Rao, H. Weng, and T. Yamagata (2007), El Ni~ no Modoki and its possible teleconnection, J. Geophys. Res., 112,
are gratefully indebted to Robert C11007, doi:10.1029/2006JC003798.
Molcard for providing the 1996 Atlas, R., R. N. Hoffman, J. Ardizzone, S. M. Leidner, J. C. Jusem, D. K. Smith, and D. Gombos (2011), A cross-calibrated, multiplatform ocean
mooring data from Ombai Strait. The surface wind velocity product for meteorological and oceanographic applications, Bull. Am. Meteorol. Soc., 92, 157–174, doi:10.1175/
ENSO index was downloaded from 2010BAMS2946.1.
http://www.cpc.ncep.noaa.gov/ Atmadipoera, A., R. Molcard, G. Madec, S. Wijffels, J. Sprintall, A. Koch-Larrouy, I. Jaya, and A. Supagat (2009), Characteristics and variability
products/analysis_monitoring/ of the Indonesian Throughflow Water at the Outflow Straits, Deep Sea Res., Part I, 56(11), 1942–1954, doi:10.1016/j.dsr.2009.06.004.
ensostuff/ensoyears.shtml and the IOD Capotondi, A. (2013), ENSO diversity in the NCAR CCSM4 climate model, J. Geophys. Res., 118, 4755–4770, doi:10.1002/jgrc.20335.
index from http://www.jamstec.go.jp/ Clarke, A.J., and X. Liu (1993), Observations and dynamics of semiannual and annual sea levels near the eastern equatorial Indian Ocean
frcgc/research/d1/iod/HTML/ boundary, J. Phys. Oceanogr., 23, 386–399.
Dipole%20Mode%20Index.html. The Clarke, A. J., and X. Liu (1994), Interannual sea level in the northern and eastern Indian Ocean, J. Phys. Oceanogr., 24, 1224–1235.
altimeter products were produced by Drushka, K., J. Sprintall, and S. T. Gille (2010), Vertical structure of Kelvin waves in the Indonesian Throughflow exit passages, J. Phys. Ocean-
Ssalto/Duacs and distributed by Aviso, ogr., 40, 1965–1987.
with support from CNES (http://www. Efron, B., and G. Gong (1983), A leisurely look at the bootstrap, the jackknife, and cross-validation, Am. Stat., 37(1), 36–48.
aviso.oceanobs.com/duacs/). The England, M. H., and F. Huang (2005), On the interannual variability of the Indonesian Throughflow and its linkage with ENSO, J. Clim., 18,
CCMP wind data were obtained from 1435–1444.
the Physical Oceanography Distributed Feng, M., G. Meyers, and S. E. Wijffels (2001), Interannual upper ocean variability in the tropical Indian Ocean, Geophys. Res. Lett., 28, 4151–
Active Archive Center (PO.DAAC) at 4154.
the NASA Jet Propulsion Laboratory, Feng, M., C. W. B€ oning, A. Biastoch, E. Behrens, E. Weller, and Y. Masumoto (2011), The reversal of the multi-decadal trends of the equatorial
Pasadena, CA (http://podaac.jpl.nasa. Pacific easterly winds, and the Indonesian Throughflow and Leeuwin Current transports, Geophys. Res. Lett., 38, L11604, doi:10.1029/
gov). 2011GL047291.
Ferrari, R., C. Provost, A. Renault, N. Senn echael, N. Barre, Y.-H. Park, and J. H. Lee (2012), Circulation in Drake Passage revisited using new
current time series and satellite altimetry: 1. The Yaghan Basin, J. Geophys. Res., 117, C12024, doi:10.1029/2012JC008264.
Godfrey, J. S. (1996), The effect of the Indonesian Throughflow on ocean circulation and heat exchange with the atmosphere: A review, J.
Geophys. Res., 101, 12,217–12,237.
Gordon A. L., R. D. Susanto, and A. Ffield (1999), Throughflow within Makassar Strait, Geophys. Res. Lett., 26, 3325–3328.
Gordon, A. L., R. D. Susanto, A. Ffield, B. A. Huber, W. Pranowo, and S. Wirasantosa (2008), Makassar Strait Throughflow, 2004 to 2006, Geo-
phys. Res. Lett., 35, L24605, doi:10.1029/2008GL036372.
Gordon, A. L., J. Sprintall, H. M. van Aken, R. D. Susanto, S. E. Wijffels, R. Molcard, A. Ffield, W. Pranowo, and S. Wirasantosa (2010). The Indo-
nesian Throughflow during 2004–2006 as observed by the INSTANT program, Dyn. Atmos. Oceans, 50, 115–128.
Gordon, A. L., B. A. Huber, E. J. Metzger, R. D. Susanto, H. E. Hurlburt, and T. R. Adi (2012), South China Sea Throughflow Impact on the Indo-
nesian Throughflow, Geophys. Res. Lett., 39, L11602, doi:10.1029/2012GL052021.
Held, I. M., and B. J. Soden (2006), Robust responses of the hydrological cycle to global warming, J. Clim., 19, 5686–5699, doi:10.1175/
JCLI3990.1.
Horii, T., H. Hase, I. Ueki, and Y. Masumoto (2008), Oceanic precondition and evolution of the 2006 Indian Ocean dipole, Geophys. Res. Lett.,
35, L03607, doi:10.1029/2007GL032464.
Imawaki, S. H. Uchida. H. Ichikawa, M. Fukasawa, S. Umatani, and the ASUKA group (2001), Satellite monitoring the Kuroshio transport
south of Japan, Geophys. Res. Lett., 28, 17–20, doi:10.1029/2000GL011796.
Kug, J.-S., and I.-S. Kang (2006), Interactive feedback between ENSO and the Indian Ocean, J. Clim., 19, 1784–1801.
Lee, T., and M. J. McPhaden (2008), Decadal phase changes in large-scale sea level and winds in the Indo-Pacific region at the end of the
20th century, Geophys. Res. Lett., 35, L01605, doi:10.1029/2007GL032419.
SPRINTALL AND REVELARD C 2014. American Geophysical Union. All Rights Reserved.
V 1174You can also read