Interevent time distribution and aftershock frequency in non stationary induced seismicity
←
→
Page content transcription
If your browser does not render page correctly, please read the page content below
www.nature.com/scientificreports
OPEN Interevent‑time distribution
and aftershock frequency
in non‑stationary induced
seismicity
Richard A. J. Post1,2, Matthias A. J. Michels3, Jean‑Paul Ampuero4, Thibault Candela5,
Peter A. Fokker5,6, Jan‑Diederik van Wees5,6, Remco W. van der Hofstad1,2 &
Edwin R. van den Heuvel1*
The initial footprint of an earthquake can be extended considerably by triggering of clustered
aftershocks. Such earthquake–earthquake interactions have been studied extensively for data-rich,
stationary natural seismicity. Induced seismicity, however, is intrinsically inhomogeneous in time and
space and may have a limited catalog of events; this may hamper the distinction between human-
induced background events and triggered aftershocks. Here we introduce a novel Gamma Accelerated-
Failure-Time model for efficiently analyzing interevent-time distributions in such cases. It addresses
the spatiotemporal variation and quantifies, per event, the probability of each event to have been
triggered. Distentangling the obscuring aftershocks from the background events is a crucial step
to better understand the causal relationship between operational parameters and non-stationary
induced seismicity. Applied to the Groningen gas field in the North of the Netherlands, our model
elucidates geological and operational drivers of seismicity and has been used to test for aftershock
triggering. We find that the hazard rate in Groningen is indeed enhanced after each event and
conclude that aftershock triggering cannot be ignored. In particular we find that the non-stationary
interevent-time distribution is well described by our Gamma model. This model suggests that 27.0(±
8.5)% of the recorded events in the Groningen field can be attributed to triggering.
The damage caused by a single earthquake can extend far beyond its direct impact as a result of triggering addi-
tional aftershocks. Hence, the quantification of earthquake–earthquake interactions has been of prime impor-
tance among seismologists to assess time-dependent hazard. In induced-seismicity studies (e.g. related to water
injection, fracking or gas production) it may be even more challenging to untangle the direct impact of varying
human actions from delayed effects of transient aftershock s equences1–4; a sufficiently large data set may often
not be available to model the full spatiotemporal process. Quantification of this triggering is crucial for moving
towards a better understanding of the physical mechanisms governing induced seismicity. This research is a step
towards distinguishing each earthquake as a background or triggered event.
Space–time clustering of natural earthquakes is traditionally captured in a self-exciting spatio-temporal point
process, i.e., Hawkes process5. This process is defined via a hazard rate, the instantaneous event rate, partitioned
into a background rate of events and a triggering function describing the interaction between events. The process
can be simulated and fitted with the Epidemic-Type Aftershock-Sequence (ETAS) m odel6–9. It can describe spa-
tial background variability and magnitude-dependent triggering, and is often used in practice. In steady state it
contains besides the background rate up to four additional fit parameters, which together determine the fraction
of triggered aftershocks10. As an alternative, a non-parametric probabilistic algorithm to quantify the background
rate, assumed stationary, has been proposed11. Both methods facilitate the construction of declustered earthquake
1
Department of Mathematics and Computer Science, Eindhoven University of Technology, 5600 MB Eindhoven,
The Netherlands. 2Institute for Complex Molecular Systems, Eindhoven University of Technology, 5600
MB Eindhoven, The Netherlands. 3Department of Applied Physics, Eindhoven University of Technology,
5600 MB Eindhoven, The Netherlands. 4Université Côte d’Azur, IRD, CNRS, Observatoire de la Côte d’Azur,
Géoazur, Nice, France. 5Applied Geosciences, Netherlands Organisation for Applied Scientific Research (TNO),
3508 TA Utrecht, The Netherlands. 6Department of Geosciences, Utrecht University, 3584 CB Utrecht, The
Netherlands. *email: e.r.v.d.heuvel@tue.nl
Scientific Reports | (2021) 11:3540 | https://doi.org/10.1038/s41598-021-82803-2 1
Vol.:(0123456789)www.nature.com/scientificreports/
catalogs (i.e., with triggered events removed) by applying stochastic declustering. A graphical methodology based
on space–time–magnitude nearest-neighbor distance between earthquakes has been introduced to establish the
existence of two statistically distinct populations of background and triggered earthquakes12. The non-parametric
and graphical methods rely on a constant expectation of earthquake–earthquake distances and aim at empirically
obtaining information from the data without making additional assumptions on the underlying mechanism. For
induced seismicity the facts (1) that the dynamic is non-stationary and (2) that the available data may be limited,
make it extremely challenging to empirically estimate the hazard changes. ETAS-based methods that account for
variations in seismicity (i.e. seismic swarms and induced seismicity) by estimating non-stationary background
rates at time scales down to ten days are gaining attention3,4,13–21, e.g. by considering a sequence of time bins
with piecewise constant backgrounds. The number of parameters then rapidly increases with the number of time
bins. Nevertheless, background events and aftershocks have been accurately modeled in large induced-seismicity
catalogs, containing up to thousands of e vents13–16,18,20,21. But such catalog sizes may not always be available, in
which case the ETAS parameter estimates may become highly uncertain.
Triggering can also be studied from a survival-analysis point of view, where the focus is not on the cumula-
tive number of events but on the interevent-time distribution. Stationary distributions for recurrence times
of earthquakes on naturally active faults have been proposed based on the theory of self-organized criticality
(SOC)22,23. It has then been argued that recurrence times on a single fault follow a Weibull distribution, while
interevent times within a sufficiently large area are well approximated by an Exponential distribution: event times
are then considered to be i ndependent24. Joint modelling of fault-specific loading and unloading events is done
via so-called renewal models25. In practice this may often be impossible due to the limited number of events and
uncertainties in event location and event–fault association. In line with the SOC concept, scaling approaches have
been successful in collapsing stationary interevent-time distributions of large seismicity data sets onto universal
curves that suggest a (two-parameter) Gamma d istribution26–29, but an ETAS-based model with four parameters
has also been g iven30,31. Processes obeying stationary Gamma-like interevent-time distributions have also been
studied in other phenomena, e.g. rock fracture and creep or shear in disordered m aterials32–36. Deviation from
Exponential distributions has been presented as evidence for underlying physical correlations between events,
but this has also been debated37–39.
An interevent-time distribution is uniquely defined by its hazard function, also known as the hazard rate40,
for details see “Methods” and Supplemental text S1.1. For the Gamma distribution the hazard function at time
u since the last event reads
uk−1 exp (−u/τ )
h0 (u, τ , k) = , (1)
τ k Ŵ(k, u/τ )
where τ is the (time-)scale parameter, k is the shape parameter, and Ŵ(k, u/τ ) is the upper incomplete Gamma
function. The expected interevent time, being inversely proportional to the average event rate, equals kτ . For
k = 1 the Gamma distribution simplifies to the memoryless Exponential distribution, which lacks event inter-
actions and describes the interevent times of the background Poisson process, with average event rate τ −1. For
k < 1 the exponential factor in the probability-density function should in the asymptotic limit of very large u
still be determined by the rate τ −1 of the uncorrelated background events41,42. In real data a correction appears
at finite but large u when high background rates give rise to strongly overlapping aftershock sequences and thus
also to uncorrelated pairs of subsequent aftershocks. The correction is not rigorously exponential in u but may
in practical data fitting easily be interpreted as such, which leads to overestimation of the background rate28. This
effect applies to Gamma- as well as ETAS-based models. (Values k > 1 are unphysical since then the additional
aftershocks would increase the average interevent time above the background Poisson value.) For stationary
distributions the shape parameter k has indeed been recognized as the ratio of background-to-total events, with
τ −1 the background r ate41,42.
Gas production in the Groningen field in the North of the Netherlands has resulted in induced seismicity
with a rapidly increased non-stationary activity, amounting to a catalog of 397 events above the magnitude of
completeness M = 1.3 in the period 1995–2018 (Fig. 1a)43–51. The gas withdrawal causes reservoir compaction
and associated stress build-up along pre-existing faults. When the stress reaches a threshold value, faults may be
activated, induced earthquakes start to nucleate and seismic energy is r eleased2. The development of the reser-
voir compaction (see Fig. 1d) causes the non-stationarity and hinders the use of the conventional statistical or
probabilistic methods typically developed for stationary cases. There is no clear consensus on the importance of
earthquake–earthquake interaction for Groningen’s induced s eismicity44,47,49,50. Uncorrelated human-induced
triggers of seismic activity may, via earthquake–earthquake interaction, each entail internally correlated bursts
of duration longer than the minimal time resolution. The times between these triggers will be Poissonian dis-
tributed. The unavoidable thresholding of the catalog by a minimal magnitude, and the time resolution, will
split individual bursts into separately observed events of minimal duration. This creates a catalog of such events
including correlated aftershocks and with short interevent times that modify the Poisson distribution, while hid-
ing silent earthquake excursions below the t hreshold37,39,52. To decluster such a limited and thresholded catalog
and stochastically identify the original uncorrelated operational triggers will be the purpose of this paper, with
Groningen as a case study. This requires generalizing the conventional statistical methods and simultaneously
addressing the clearly visible spatial heterogeneity in activity and fault density over the field (Fig. 1c). In the case
of substantial earthquake–earthquake interaction, the approach should be able to quantify the likeliness for each
event to have been triggered by another event (Fig. 1b). It is only after answering this question that the direct
effect of human action on induced seismicity can be faithfully quantified.
Scientific Reports | (2021) 11:3540 | https://doi.org/10.1038/s41598-021-82803-2 2
Vol:.(1234567890)www.nature.com/scientificreports/
Average interevent time [day]
a 150
b Event timepoints
400
Total events
2000 2005 2010 2015
100 Years
200
50 Background event
Triggered event
0 0
2000 2005 2010 2015
Years
Compaction rate [m/day]
c Event density [m-2] d ×10-5
Compaction rate
5×10⁻⁹
6 12 1 2
1
0 33 155 42 4 0
Compaction rate
2000 2005 2010 2015
Years
14 55 42 6
Compaction [m]
Compaction
0.2
1 19 6 1
0.1
2000 2005 2010 2015
Compaction
Figure 1. Groningen-field local characteristics and non-stationary induced earthquakes. (a) Yearly average
interevent time (days) between two subsequent events in the field (green dots) and the evolution of the total
number of events (blue line) from October 1995 until October 2018. (b) For each event (light grey) it is
unknown whether this is a background (red) or a triggered event (purple). (c) Schematic overview of the faults
(solid grey) in the field and the probability-density map (m−2) of the induced-earthquake locations in the
period 1995–2018 ( M ≥ 1.3, n = 397). The field is divided into 15 grid cells and the total number of events per
cell is presented. (d) The average compaction rate (m/day) and total compaction (m) of the ground soil over
time for the two highlighted regions. For the red region the swing in compaction rate is due to the seasonal
swing in gas production.
Results
Temporal non‑stationarity. Modeling non-stationary seismicity brings complications far beyond those
of steady state. With sufficient data these have already been addressed successfully by ETAS models14–16,18,20,21.
But since our purpose is to consider the added complication of small catalogs we therefore choose as an alter-
native the Gamma form (1). It is admittedly more empirical, but it has a minimum number of parameters and
contains the Poisson process for k = 1. Gamma-type data collapse has been observed in interevent statistics of
steady-state cases, see e.g.26,29,42, although deviations may occur at the shortest interevent times27,28,30,31. As a
non-stationary extension we propose a Gamma Instantaneous Accelerated-Failure-Time (IAFT) model. In this
case the hazard for k = 1 still equals 1/τ (t), independent of the time u since a previous event, giving rise to a
non-homogeneous Poisson process. We assume that case to represent the memoryless process of the operation-
ally induced background events, with rate 1/τ (t), while k < 1 decreases the expected interevent time and thus
indicates the presence of aftershocks. There is no unique modification of the Gamma distribution to account
for non-stationarities and accurately model the process for k < 1. To define our modified hazard, we choose to
start from the process-controlled background rate and keep the functional
form (1). We allow the background
rate to depend on J time- and space-varying covariates y = y1 , . . . , yJ , e.g. injection/production rate. For the
background rate in region x we introduce the functional relation
J
1/τx (t) = exp j=1 βj yj (x, t) /τ0 , (2)
where yj (x, t) equals the value of the jth covariate at time t since the starting point, in region x, and βj represents
the effect of the jth covariate. We employ the exponential function to guarantee a positive background rate, and
a linear first-order approximation of its argument. Note that this way of modeling the background rate does
not depend on the choice for the Gamma distribution and could also be used in e.g. an ETAS model. When
we assume that covariates are approximately constant in regions, the total background rate is the sum over the
time-dependent background rates of all regions:
(3)
1/τ (t) = x∈X 1/τx (t),
where X equals the field of interest. To distinguish between the global time t and interevent time u, let tl represent
the point in time when the previous event occurred. Our Gamma IAFT model is then defined by linking the field
hazard rate h at time t = tl + u to the total background rate at that time as:
Scientific Reports | (2021) 11:3540 | https://doi.org/10.1038/s41598-021-82803-2 3
Vol.:(0123456789)www.nature.com/scientificreports/
h(u, tl , k) = h0 (u, τ (tl + u), k). (4)
In words, the Gamma IAFT hazard at time t = tl + u equals the hazard rate of a standard Gamma distribution
with shape parameter k, but ‘accelerated’ with the time-scale parameter τ (tl + u) of that instantaneous time.
Note that h depends on the interevent time u via the functional form of h0 (u, τ , k), as well as via a change in the
global time t = tl + u. Since the scale parameter τ (t) does change over the global time scale, the process is no
longer renewal, in the sense that the interevent times remain not identically d istributed53.
The earthquake process follows the hazard rate (4) and we assume that the background process is Exponential
with hazard rate 1/τ (t). The hazard can then be partitioned in the background rate 1/τ (tl + u) and the additional
hazard due to triggering, h(u, tl , k) − 1/τ (tl + u). An event that occurs at time t = tl + u is thus triggered with
probability
h(u, tl , k) − 1/τ (tl + u)
ptriggered (u, tl , k) = , (5)
h(u, tl , k)
for a formal proof see Supplemental text S4.1. Thus, interevent times giving rise to a substantial difference
h(u, tl , k) − 1/τ (tl + u) are likely the result of earthquake–earthquake interaction. The triggering probabilities
(5) will be used to estimate which fraction of the past events are aftershocks.
If the covariates, and thus τ (tl + u), are approximately constant during an interevent period, the interevent-
time distribution is well approximated by a Gamma distribution and k can be interpreted as the fraction of
background events. If however the covariates do change rapidly, the interevent-time distribution is more complex.
The fraction of background events then deviates from k, but it can still be derived from the sum of background
probabilities (for details, see Supplemental text S5; this implies that our method of dealing with non-stationarity
can, if necessary, also be applied to suitable more-parameter modifications of the Gamma distribution).
Spatial non‑stationarity. So far we have focused on the temporal non-stationarity of the hazard. Induced-
seismicity studies often work with limited data, where most events are neighboring. The estimates of the Gamma
IAFT model will therefore be improperly biased towards the behavior of active regions. Such spatial heterogene-
ity over the field should be incorporated in our hazard function to prevent overfitting. In the absence of inter-
action, i.e., the Exponential (k = 1) case, the hazard for the field equals 1/τ (t) and is by virtue of (3) uniquely
partitioned in the local background rates. In the case k < 1, the hazard (4) cannot be partitioned in such a way
and weighting is needed to assign events to the different regions. A logical choice in line with (3) is to divide the
total-field hazard through weights proportional to the local background rates:
1/τx (tl + u)
hx (u, tl , k) = h(u, tl , k). (6)
1/τ (tl + u)
This weighted approach will give due emphasis to the intensity in the less active regions and thus prevent
overfitting of the seismically active regions. In practice, one can use regions within which the covariates y vary
somewhat to mitigate the impact of event-location uncertainty; so we use regional cumulative covariates instead
(e.g. the total length of faults). The time-varying model defined by Eqs. (1)–(6), with pre-specified covariates,
can be fitted to the data set of observed interevent times by maximizing the probabilistic likelihood. Information
criteria54 can be used to decide between different models with different subsets of candidate covariates and to
select a final model for the field under study.
The final model should be both temporally and spatially validated. The interpretation of the parameters and
the estimation of the fraction of triggered events are only valid when the Gamma IAFT model fits the data of
interest well.
Case study: triggering in the Groningen gas field. We have partitioned the Groningen field into 15
equally sized regions, such that each cell contains a reasonable number of events (Fig. 1c). As candidate covari-
ates we have considered the average compaction rate (m/day), the average cumulated compaction (m), the total
length of faults (m) in the (x, y)-plane, the average fault dip (degrees), the fraction of faults with a strike angle
between 45◦ and 90◦, the average fault throw (m) and the average throw-to-thickness (of reservoir) ratio per
region. These covariates have been standardized for stability of the numerical optimization of the likelihood.
Furthermore, we considered a critical total compaction by introducing a truncation cap, mimicking the compac-
tion level at which all faults in a region have reached their fault strength. The final model has been selected by
fitting on the 1995–2018 catalog.
As dominant covariates we identified the total compaction (C), the compaction rate (Ċ), the total fault length
(F), the percentage of faults with a strike between 45◦ and 90◦ (S), the throw-to-thickness ratio (R) and the
truncation cap (c), such that
(7)
1/τx (t) = exp βC min{yC (x, t), c} + i∈Y βi yi (x, t) /τ0 ,
where Y := {Ċ, F, S, R}. The shape-parameter estimate k̂ is found to be 0.73 (0.031); the estimates of τ0, β and of
the cap variable c are given in Table 1. Note that in real catalogs, short interevent times cannot be detected because
waveforms of successive events overlap in s eismograms55–57. Parameter estimates obtained while ignoring this
thresholding might therefore be biased. However, in the case study, with one minute as the shortest interevent
time, a fit with a five minutes threshold does not deviate from the presented results. For details on the model
fitting see Supplementary text S2.
Scientific Reports | (2021) 11:3540 | https://doi.org/10.1038/s41598-021-82803-2 4
Vol:.(1234567890)www.nature.com/scientificreports/
k log(τ0 ) βĊ βF βS βR βC c
0.73 (0.03) 9.49 (0.97) 6.32 ×10⁻⁶ 3.44 (0.62) -1.44 (0.42) 23.80 (0.84)
2.60 ×10⁴ (9.50 ×10³) 0.24 (0.44 × 10⁻²)
(1.64 × 10⁻⁶)
Table 1. Gamma IAFT-model parameter estimates and corresponding standard errors for the Groningen case.
a b Groningen catalog
Gamma IAFT model
Global Gamma IAFT model
0.20 200
(Truncated) compation [m]
Total events since 2014
0.15
100
0.10
0
1996 2000 2005 2010 2015 2014 2015 2016 2017 2018
Years Years
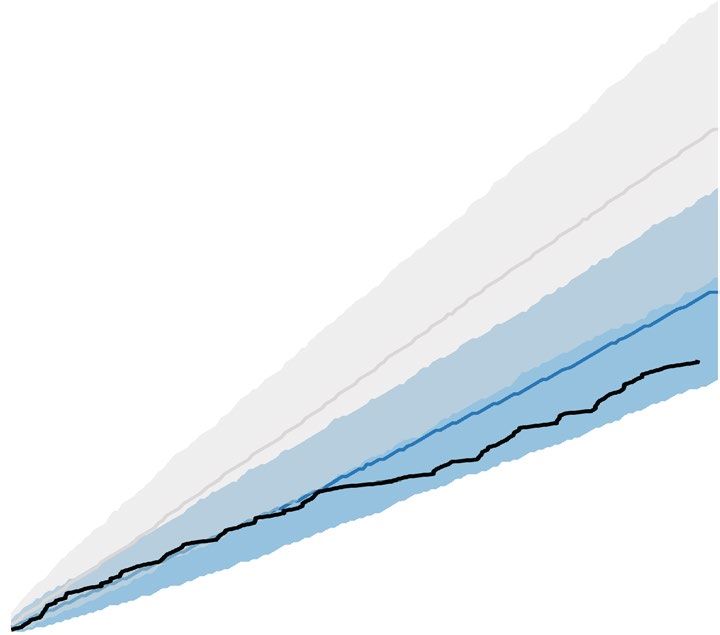
Figure 2. Results from the Gamma IAFT model for the Groningen case. (a) The evolution of the truncated total
compaction (m) in the most active region (Loppersum, black, indicating critical stress from the end of 2007)
compared to the compaction in the two regions highlighted in Fig. 1c. (b) Groningen catalog during the period
2014–2018 (black) and the median of thousand predicted catalogs using the (local) Gamma IAFT model (blue),
respectively the global Gamma IAFT model that ignores spatial heterogeneity (grey). The 2.5% and 97.5% point-
wise quantiles are presented as shaded areas (fit details in Supplemental text S3.3). Note that, after an offset in
the first half of 2016, the real event rate still closely equals the median model prediction.
a 1.00 Model without triggering b
Gamma IAFT model 0.08 Model without triggering
1-e-x Gamma IAFT model
P(Accumulated hazard ≤ x)
0.75
Background rate
0.3 0.06
0.50
0.2
0.04
0.1
0.25
0 0.02
0 0.1 0.2 0.3
0
0 1 2 3 4 2000 2005 2010 2015
x Years
Figure 3. The effect of clustering in Groningen. (a) The left tail of the empirical distributions of the integrated
hazard over each interevent period for the Exponential (k = 1, red) and the Gamma (blue) IAFT models. These
accumulated hazards should follow a unit Exponential distribution (black; Cox–Snell t est58). The number of
interevent times with a low accumulated hazard is overestimated in the (k = 1)-model (inset: zoom), thus this
model results in fewer short interevent times than observed in Groningen. (b) Background rate (events per day)
based on the ML-estimates of the Exponential IAFT (red) and Gamma IAFT (blue) models.
The estimated value of the cap variable indicates that all faults in the Loppersum region became critically
stressed at the end of 2007, when the total compaction was 0.24 m in this most active region (Fig. 2a).
Our non-stationary Gamma IAFT model proved to fit the multi-year seismicity rate and the temporal event clus-
tering in the Groningen catalog very well. We have validated this by analyzing the distribution of the total accumu-
lated (or integrated) hazard during the interevent period. It should follow a unit Exponential distribution when the
true interevent-time distribution is used58, see Fig. 3a and “Discussion”. We can statistically accept that this is the case
(Kolmogorov–Smirnov test, p = 0.68). Furthermore, we did verify randomness of the model residuals over time
Scientific Reports | (2021) 11:3540 | https://doi.org/10.1038/s41598-021-82803-2 5
Vol.:(0123456789)www.nature.com/scientificreports/
Figure 4. Gamma IAFT model compared to other models. (a) Estimated probability-density function (pdf)
for the time-scaled interevent times, u/τ̂ (tl + u), using a logarithmic binning of the 396 interevent times
(black dots). For each estimate of the pdf a 95% confidence interval is presented, for details see Supplemental
text S3. Furthermore, the Ŵ(k̂, 1) pdf (blue) and the Exponential (k = 1, red) pdf scaled by k̂ are presented. (b)
Distribution of interevent times from 500 Groningen-based synthetic ETAS catalogs, with a mean aftershock
fraction equal to 0.766, scaled by the background rate at the time of events, u/τ (tl + u) (dashed orange). A
Gamma IAFT-model fit to all simulated interevent times follows the same distribution (blue).
(Wald–Wolfowitz runs test, p = 0.16), as well as the spatial (multinomial) event-count distribution over regions
(Tailored χ 2-like test, p = 0.24, for details see Supplemental text S3.2).
The sudden drop in gas production and associated compaction rate (Fig. 1d) in early 2014 can be used for
further validation: if our model appropriately describes the causal mechanisms, we should be able to predict what
happened after 2013 based on a model fitted on the 1995–2013 catalog only. And indeed the 2014–2018 catalog
falls well within the uncertainty margins predicted by the 1995–2013 fit (Fig. 2b). This invariant prediction sup-
ports the causal interpretation of the estimates found in our study59. With that interpretation, the model can be
used to analyze future hazards under hypothetical new production/compaction scenarios. For real seismicity
prediction it is crucial that such drivers, as in this case compaction, can also be predicted accurately.
Discussion
In this study we have introduced a novel Gamma IAFT model for analyzing interevent-time distributions and
estimating the aftershock frequency that will be particularly useful in data-scarce induced-seismicity studies. For
the Groningen gas field the estimated shape parameter k̂ significantly differs from 1, from which we conclude the
presence of clustering (Likelihood-ratio test, p < 0.0001). Figure 3a analyzes the distribution of accumulated
hazards and illustrates that the Exponential IAFT model underestimates the number of short interevent times
and thus underestimates the temporal clustering of events. The misfit of the Exponential IAFT model can be
overlooked when considering the fit to only the cumulative number of events, which obscures differences between
models (see e.g. Fig. S7). The difference between the background rates estimated from the Gamma IAFT-model
fit and the Exponential IAFT-model fit (Fig. 3b) highlights the importance of modelling clustering.
In our Gamma IAFT model k̂ does not a priori equal the fraction of background events. The fraction of trig-
gered events can be estimated from the sum of triggered-event probabilities (5), for details see Supplemental
text S4.2-3. For Groningen we find that 27.0% (95% CI 18.4%, 35.5%) of the past seismicity can be attributed
to aftershocks. The Groningen case presents a clear separation between the time scales on which τ (t) and h(u)
change as a function of their respective arguments, i.e., the background rate is approximately constant over the
course of an interevent period. The interevent-time distribution is thus accurately approximated by the Gamma
function and the estimated fraction of aftershocks indeed numerically equals 1 − k̂. As a consequence of the scale
separation, the temporal non-stationarity can be scaled out; the time-scaled data and the distribution Ŵ(k̂, 1) are
given in Fig. 4a. Based on our model each event can be stochastically labeled using its probability (5) of being
triggered, resulting in a stochastically declustered seismic catalog (see e.g. Fig. S13).
The risk of ignoring spatial heterogeneity, with results biased towards the faults in active regions,
can also
be shown. For this we fitted, instead of the local model (7), a model with global covariates y(t) = 15 x=1 y(x, t):
(8)
1/τ (t) = exp βC min yC (t), c + βĊ yĊ (t) /τ0 ,
(the maximum-likelihood estimates for this model based on the catalog up to 2013 have been listed in Table S7).
The uncertainty margins of the 2014–2018 catalog predicted from model (8) do not capture the real Groningen
catalog (Fig. 2b). Modelling spatial non-stationarity is thus of major importance to obtain causal effect estimates
of the operational parameters.
Scientific Reports | (2021) 11:3540 | https://doi.org/10.1038/s41598-021-82803-2 6
Vol:.(1234567890)www.nature.com/scientificreports/
In this research we assumed that the shape parameter k was stationary. To validate this assumption we fitted
the model for the periods 1995–2010 (k̂ = 0.775(0.045), n = 180) and 2011–2018 (k̂ = 0.715(0.041), n = 217).
The 95% confidence interval for the change in shape parameter (k2011-2018 − k1995-2010) equals (−0.18, 0.06). This
sensitivity analysis shows that the difference is small compared to the variability in the data and could very likely
occur assuming a constant k. Therefore we conclude that the increase in seismic activity in the Groningen field
should be mainly attributed to the change in human-induced background events rather than to an increased
earthquake-interaction mechanism.
Simulations with a Groningen-based temporal ETAS model indicate that the latter may still be in the class
of models that give rise to approximately Gamma IAFT interevent-time distributions, as exemplified in Fig. 4b
(for details see Supplementary text 5.1); the ETAS parameter estimates are highly uncertain here due to the
small catalog. Moreover, in this example the parameter-poor Gamma fit to the synthetic ETAS catalogs proves
more efficient than the ETAS fit to the synthetic ETAS catalogs. Here efficiency refers to the standard error of the
estimated fraction of aftershocks, which is higher in the ETAS fit than in the Gamma fit (Brown–Forsythe test,
p < 0.0001). Thus when a limited data set is available, the Gamma IAFT model, which also naturally extends
existing approaches of steady-state cases26,29,41,42, can be more useful to describe e.g. aftershock statistics because
of the lower uncertainty in the parameter estimation.
As mentioned in previous sections, with a Gamma-model fit (as well as an ETAS-model fit) the Poisson
background rate may be overestimated, due to overlapping aftershock sequences that introduce near-Poissonian
interevent times, while deviations from Gamma-type behavior may occur at the shortest interevent times27,28,30,31.
Our estimate of the fraction of aftershocks in the Groningen field heavily relies on the appropriateness of the
Gamma IAFT-model fit, which was validated using the distribution of the accumulated hazard. To verify how
sensitively this Cox–Snell test can detect deviations from a Gamma distribution, we simulated 397 events from
hypothetical (stationary) ETAS models with different aftershock fractions, choosing parameters that enforce
deviations from a Gamma distribution, for details see Supplemental text S5.2. For all settings, the distribution
of the accumulated hazard under a Gamma model did deviate from the unit Exponential distribution in at
least 79.0% of the 500 simulations. This high statistical power does support our choice for the Gamma model,
which gives that 27.0% (95% CI 18.4%, 35.5%) of the recorded events in the Groningen field can be attributed
to earthquake–earthquake triggering.
Our novel statistical approach is suitable for small data sets and allows quantitative model validation. Good-
ness-of-fit tests, in particular to exclude significant deviations at very short interevent times, are a crucial part of
the analysis. The Groningen case study illustrates the potential of the application of survival models in induced-
seismicity studies. But their applicability is broader. The methodology is non-specific and can also be applied to
other scenarios of induced seismicity or other hazards with spatiotemporal non-stationarities when data on the
hazard drivers are available (e.g. data on climate factors that induce spreading forest fires).
For small data sets parsimonious multivariate models should ideally be developed as well, to address the joint
distribution of interevent times, distances and m agnitudes60, which is ignored in our current approach. This
should complement spatio-temporal ETAS models that can effectively be used when enough data are available. To
that end the hazard of the IAFT model could be extended by including magnitudes of past events and distances
with respect to previous event locations. In such future research the trade-off between model complexity and
variability of the estimates should be central.
Our study can help to develop further insight in the relative importance between human-induced operational
forcing and triggered effects when data are scarce. Such insights will be crucial to develop safe clean-energy
solutions for our planet.
Methods
Methods are elaborately described in the Supplemental Information. Below, the main aspects of concepts, meth-
ods and data are highlighted.
Hazard function. In modeling the distribution of a random interevent time U, the central concept is the
hazard rate, equal to
P(U ≤ u + ǫ|U > u) d log(S(u))
h(u) = lim =− , (9)
ǫ→0 ǫ du
where S(u) = P(U > u) = 1 − F(u) is the survival function. In statistical
u seismology the instantaneous event rate
or hazard rate is often referred to as the intensity function. H(u) = s=0 h(s)ds is the integrated (or accumulated)
hazard, and f (u) = − dS(u)
du represents the probability-density function (pdf). Then,
S(u) = exp(−H(u)). (10)
Gamma Instantaneous Accelerated‑Failure‑Time model. In this research we model the hazard by
a Gamma hazard that is ‘accelerated’ as a result of a time-varying scale parameter τ (t). Equation (4) can be
expressed as
τ0 τ0
h(u, tl , k) = h0 u, τ0 , k , (11)
τ (tl + u) τ (tl + u)
for some baseline value τ0 and with function h0 as defined in (1). If the scale parameter τ (t) would be invariant
over time this model is an example of a (stationary) Accelerated-Failure-Time (AFT) model40. Since this is not
Scientific Reports | (2021) 11:3540 | https://doi.org/10.1038/s41598-021-82803-2 7
Vol.:(0123456789)www.nature.com/scientificreports/
the case in our study, the relation does differ at every instance of time, for which reason we refer to this new
model as an Instantaneous Accelerated-Failure-Time (IAFT) model. More details on the Gamma IAFT model
and details on parameter estimation are presented in Supplemental text S1. The Gamma IAFT model is used
to derive for each event the probability (5) of being a triggered event, as elaborated on in Supplemental text S4.
Data. In the Groningen case study we have used the publicly available earthquake catalog from October
1995 until October 2018 provided by the Royal Netherlands Meteorological Institute (KNMI). Events with a
magnitude lower than 1.3 were excluded from the c atalog61, leaving us with 396 interevent times (median of
11.0 days and interquartile range (IQR) of [3.23, 26.8]). The yearly average interevent time and the develop-
ment of the total event number over the period of interest are presented in Fig. 1a and the spatial distribution
of the events is shown in Fig. 1b. The stationary covariates, viz. total fault length (median 95 × 103 m and IQR
[54 × 103 , 11 × 104 ]), percentage of faults having a strike between 45 and 90 degrees (median 0.42 and IQR
[0.36, 0.48]) and throw-to-thickness ratio (median 0.12 and IQR [0.08, 0.26]) are derived from the geological
top Rotliegend surface model from the Nederlandse Aardolie Maatschappij (NAM), provided via the Netherlands
Organisation for Applied Scientific Research (TNO)62, and computed per grid cell as shown in Fig. 1c. The
local compaction rate (median 7.31 × 10⁻⁶ m/day and IQR [4.15 × 10⁻⁶ , 1.08 × 10⁻⁵ ]) and total compaction
(median 0.15 m and IQR [0.12, 0.18]) are derived from the compaction model provided by Shell63, see Fig. 1d.
Further details on the standardization of covariates is presented in Supplemental text S2.1.
Model selection. To model the interevent times in the Groningen field we write the Gamma scale parameter
as a function of (time-varying) local covariates. The candidate covariates are presented in Table S1. Maximum-
likelihood estimates of the parameters for different models, based on subsets of these candidate covariates, are
implemented using statistical software [R]64. Subsequently, Akaike’s information criteria (AIC) are used to select
the best model while preventing overfitting. More details on the model selection can be found in Supplemental
text S2. Details on the validation of the model are presented in Supplemental text S3.
Simulation. To simulate past-event catalogs based on the final model we rely on the survival-analysis rela-
tion F(u) = 1 − exp (−H(u)). In general a random variable with cumulative distribution function (cdf) F is
generated by drawing a realization of a Uniform [0, 1] random variable V and evaluating the inverse cdf at this
V, F −1 (V ). Equivalently, one could evaluate the survival function, S = 1 − F , at the random V. Our Gamma
IAFT model defines the hazard rate, the integrated hazard H(u), and thus the cdf. More details are presented in
Supplemental texts S3 and S5.
Data availability
The data that support the findings of this study are available from the corresponding author upon reasonable
request.
Received: 4 May 2020; Accepted: 17 November 2020
References
1. Zhai, G., Shirzaei, M., Manga, M. & Chen, X. Pore-pressure diffusion, enhanced by poroelastic stresses, controls induced seismicity
in Oklahoma. Proc. Natl. Acad. Sci. 116, 16228–16233. https://doi.org/10.1073/pnas.1819225116 (2019).
2. Candela, T., Wassing, B., ter Heege, J. & Buijze, L. How earthquakes are induced. Science 360, 598–600. https://doi.org/10.1126/
science.aat2776 (2018).
3. Brodsky, E. E. & Lajoie, L. J. Anthropogenic seismicity rates and operational parameters at the Salton Sea geothermal field. Science
341, 543–546. https://doi.org/10.1126/science.1239213 (2013).
4. Llenos, A. L., McGuire, J. J. & Ogata, Y. Modeling seismic swarms triggered by aseismic transients. Earth Planet. Sci. Lett. 281,
59–69. https://doi.org/10.1016/j.epsl.2009.02.011 (2009).
5. Reinhart, A. A review of self-exciting spatio-temporal point processes and their applications. Stat. Sci. 33, 299–318. https://doi.
org/10.1214/17-STS629 (2018).
6. Ogata, Y. Space-time point-process models for earthquake occurrences. Ann. Inst. Stat. Math. 50, 379–402. https://doi.
org/10.1023/A:1003403601725 (1998).
7. Zhuang, J., Ogata, Y. & Vere-Jones, D. Stochastic declustering of space-time earthquake occurrences. J. Am. Stat. Assoc. 97, 369–380.
https://doi.org/10.1198/016214502760046925 (2002).
8. Console, R., Murru, M. & Lombardi, A. M. Refining earthquake clustering models. J. Geophys. Res. Solid Earth 108, 2468. https://
doi.org/10.1029/2002jb002130 (2003).
9. Lombardi, A. M. SEDA: A software package for the statistical earthquake data analysis. Sci. Rep. 7, 44171. https://doi.org/10.1038/
srep44171 (2017).
10. Helmstetter, A. & Sornette, D. Subcritical and supercritical regimes in epidemic models of earthquake aftershocks. J. Geophys. Res.
Solid Earth 107, ESE10–1-ESE10–21. https://doi.org/10.1029/2001jb001580 (2002).
11. Marsan, D. & Lengliné, O. Extending earthquakes’ reach through cascading. Science 319, 1076–1079. https: //doi.org/10.1126/scien
ce.1148783 (2008).
12. Zaliapin, I., Gabrielov, A., Keilis-Borok, V. & Wong, H. Clustering analysis of seismicity and aftershock identification. Phys. Rev.
Lett. 101, 018501. https://doi.org/10.1103/PhysRevLett.101.018501 (2008).
13. Hainzl, S. & Ogata, Y. Detecting fluid signals in seismicity data through statistical earthquake modeling. J. Geophys. Res. Solid
Earth 110, 1–10. https://doi.org/10.1029/2004JB003247 (2005).
14. Llenos, A. L. & McGuire, J. J. Detecting aseismic strain transients from seismicity data. J. Geophys. Res. Solid Earth 116, B06305.
https://doi.org/10.1029/2010JB007537 (2011).
15. Daniel, G. et al. Changes in effective stress during the 2003–2004 Ubaye seismic swarm, France. J. Geophys. Res. Solid Earth. 116,
B01309. https://doi.org/10.1029/2010JB007551 (2011).
Scientific Reports | (2021) 11:3540 | https://doi.org/10.1038/s41598-021-82803-2 8
Vol:.(1234567890)www.nature.com/scientificreports/
16. Marsan, D., Reverso, T., Helmstetter, A. & Enescu, B. Slow slip and aseismic deformation episodes associated with the subducting
Pacific Plate offshore Japan, revealed by changes in seismicity. J. Geophys. Res. E Planets 118, 4900–4909. https://doi.org/10.1002/
jgrb.50323(2013).
17. Llenos, A. L. & Michael, A. J. Modeling earthquake rate changes in Oklahoma and Arkansas: Possible signatures of induced seis-
micity. Bull. Seismol. Soc. Am. 103, 2850–2861. https://doi.org/10.1785/0120130017 (2013).
18. Reverso, T., Marsan, D. & Helmstetter, A. Detection and characterization of transient forcing episodes affecting earthquake activity
in the Aleutian Arc system. Earth Planet. Sci. Lett. 412, 25–34. https://doi.org/10.1016/j.epsl.2014.12.012 (2015).
19. Llenos, A. L. & Michael, A. J. Characterizing potentially induced earthquake rate changes in the Brawley seismic zone, Southern
California. Bull. Seismol. Soc. Am. 106, 2045–2062. https://doi.org/10.1785/0120150053 (2016).
20. Reverso, T., Marsan, D., Helmstetter, A. & Enescu, B. Background seismicity in Boso Peninsula, Japan: Long-term acceleration,
and relationship with slow slip events. Geophys. Res. Lett. 43, 5671–5679. https://doi.org/10.1002/2016GL068524 (2016).
21. Jia, K. et al. Nonstationary background seismicity rate and evolution of stress changes in the Changning salt mining and shale-gas
hydraulic fracturing region, Sichuan Basin, China. Seismol. Res. Lett. 91, 2170–2181. https://doi.org/10.1785/0220200092 (2020).
22. Bak, P., Christensen, K., Danon, L. & Scanlon, T. Unified scaling law for earthquakes. Phys. Rev. Lett. 88, 10–13. https://doi.
org/10.1103/PhysRevLett.88.178501 (2002).
23. Abaimov, S. G., Turcotte, D. L., Shcherbakov, R. & Rundle, J. B. Recurrence and interoccurrence behavior of self-organized complex
phenomena. Nonlinear Process. Geophys. 14, 455–464. https://doi.org/10.5194/npg-14-455-2007 (2007).
24. Abaimov, S. G. et al. Earthquakes: Recurrence and interoccurrence times. Pure Appl. Geophys. 165, 777–795. https://doi.
org/10.1007/s00024-008-0331-y (2008).
25. Holliday, J. R., Turcotte, D. L. & Rundle, J. B. A review of earthquake statistics: Fault and seismicity-based models, ETAS and BASS.
Pure Appl. Geophys. 165, 1003–1024. https://doi.org/10.1007/s00024-008-0344-6 (2008).
26. Corral, Á. Long-term clustering, scaling, and universality in the temporal occurrence of earthquakes. Phys. Rev. Lett. 92, 108501.
https://doi.org/10.1103/PhysRevLett.92.108501 (2004).
27. Touati, S., Naylor, M. & Main, I. G. Origin and nonuniversality of the earthquake interevent time distribution. Phys. Rev. Lett. 102,
168501. https://doi.org/10.1103/PhysRevLett.102.168501 (2009).
28. Touati, S., Naylor, M., Main, I. G. & Christie, M. Masking of earthquake triggering behavior by a high background rate and implica-
tions for epidemic-type aftershock sequence inversions. J. Geophys. Res. Solid Earth. 116, B03304. https://doi.org/10.1029/2010J
B007544 (2011).
29. Davidsen, J. & Kwiatek, G. Earthquake interevent time distribution for induced micro-, nano-, and picoseismicity. Phys. Rev. Lett.
110, 068501. https://doi.org/10.1103/PhysRevLett.110.068501 (2013).
30. Saichev, A. & Sornette, D. “Universal” distribution of interearthquake times explained. Phys. Rev. Lett. 97, 078501. https://doi.
org/10.1103/PhysRevLett.97.078501 (2006).
31. Saichev, A. & Sornette, D. Theory of earthquake recurrence times. J. Geophys. Res. Solid Earth 112, B04313. https://doi.
org/10.1029/2006JB004536 (2007).
32. Baró, J. et al. Statistical similarity between the compression of a porous material and earthquakes. Phys. Rev. Lett. 110, 88702. https
://doi.org/10.1103/PhysRevLett.110.088702 (2013).
33. Davidsen, J., Stanchits, S. & Dresen, G. Scaling and universality in rock fracture. Phys. Rev. Lett. 98, 125502. https: //doi.org/10.1103/
PhysRevLett.98.125502 (2007).
34. Castellanos, D. F. & Zaiser, M. Avalanche behavior in creep failure of disordered materials. Phys. Rev. Lett. 121, 125501. https://
doi.org/10.1103/PhysRevLett.121.125501 (2018).
35. Lherminier, S. et al. Continuously sheared granular matter reproduces in detail seismicity laws. Phys. Rev. Lett. 122, 218501. https
://doi.org/10.1103/PhysRevLett.122.218501 (2019).
36. Kumar, P. et al. On interevent time distributions of avalanche dynamics. Sci. Rep. 10, 626. https://doi.org/10.1038/s41598-019-
56764-6 (2020).
37. Janićević, S., Laurson, L., Måløy, K. J., Santucci, S. & Alava, M. J. Interevent correlations from avalanches hiding below the detection
threshold. Phys. Rev. Lett. 117, 230601. https://doi.org/10.1103/PhysRevLett.117.230601 (2016).
38. Ramos, O. & Stojanova, M. Comment on “Interevent correlations from avalanches hiding below the detection threshold”. Phys.
Rev. Lett. 119, 188902. https://doi.org/10.1103/PhysRevLett.119.188902 (2017).
39. Janićević, S., Laurson, L., Måløy, K. J., Santucci, S. & Alava, M. J. Janićević et al reply. Phys.Rev. Lett. 119, 188901. https://doi.
org/10.1103/PhysRevLett.119.188901 (2017).
40. Smith, P. J. Analysis of Failure and Survival Data (CRC Press, Boca Raton, 2017).
41. Molchan, G. Interevent time distribution in seismicity: A theoretical approach. Pure Appl. Geophys. 162, 1135–1150. https://doi.
org/10.1007/s00024-004-2664-5 (2005).
42. Hainzl, S., Scherbaum, F. & Beauval, C. Estimating background activity based on interevent-time distribution. Bull. Seismol. Soc.
Am. 96, 313–320. https://doi.org/10.1785/0120050053 (2006).
43. Bourne, S. J. & Oates, S. J. Extreme threshold failures within a heterogeneous elastic thin sheet and the spatial-temporal development
of induced seismicity within the Groningen gas field. J. Geophys. Res. Solid Earth 122, 10299–10320. https://doi.org/10.1002/2017J
B014356 (2017).
44. Bourne, S. J., Oates, S. J. & van Elk, J. The exponential rise of induced seismicity with increasing stress levels in the Groningen gas
field and its implications for controlling seismic risk. Geophys. J. Int. 213, 1693–1700. https://doi.org/10.1093/gji/ggy084 (2018).
45. Dempsey, D. & Suckale, J. Physics-based forecasting of induced seismicity at Groningen gas field, the Netherlands. Geophys. Res.
Lett. 44, 7773–7782. https://doi.org/10.1002/2017GL073878 (2017).
46. Sijacic, D., Pijpers, F., Nepveu, M. & Van Thienen-Visser, K. Statistical evidence on the effect of production changes on induced
seismicity. Geol. Mijnbouw Neth. J. Geosci. 96, s27–s38. https://doi.org/10.1017/njg.2017.14 (2017).
47. Luginbuhl, M., Rundle, J. B. & Turcotte, D. L. Natural time and nowcasting induced seismicity at the Groningen gas field in the
Netherlands. Geophys. J. Int. 215, 753–759. https://doi.org/10.1093/GJI/GGY315 (2018).
48. Luginbuhl, M., Rundle, J. B. & Turcotte, D. L. Statistical physics models for aftershocks and induced seismicity. Philos. Trans. R.
Soc. A Math. Phys. Eng. Sci. 377, 20170397. https://doi.org/10.1098/rsta.2017.0397 (2019).
49. Candela, T. et al. Depletion-induced seismicity at the groningen gas field: Coulomb rate-and-state models including differential
compaction effect. J. Geophys. Res. Solid Earth 124, 2018JB016670. https://doi.org/10.1029/2018JB016670 (2019).
50. Muntendam-Bos, A. G. Clustering characteristics of gas-extraction induced seismicity in the Groningen gas field. Geophys. J. Int.
221, 879–892. https://doi.org/10.1093/gji/ggaa038 (2020).
51. Richter, G., Hainzl, S., Dahm, T. & Zöller, G. Stress-based, statistical modeling of the induced seismicity at the Groningen gas field,
The Netherlands. Environ. Earth Sci. 79, 252. https://doi.org/10.1007/s12665-020-08941-4 (2020).
52. Radiguet, M. et al. Triggering of the 2014 M w 7.3 Papanoa earthquake by a slow slip event in Guerrero, Mexico. Nat. Geosci. 9,
829–833. https://doi.org/10.1038/ngeo2817 (2016).
53. Karlin, S. & Taylor, H. M. A First Course in Stochastic Processes 2nd edn. (Academic Press, New York, 1975).
54. Akaike, H. A new look at the statistical model identification. IEEE Trans. Autom. Contr. 19, 716–723. https://doi.org/10.1109/
TAC.1974.1100705 (1974).
55. Kagan, Y. Y. Short-term properties of earthquake catalogs and models of earthquake source. Bull. Seismol. Soc. Am. 94, 1207–1228.
https://doi.org/10.1785/012003098 (2004).
Scientific Reports | (2021) 11:3540 | https://doi.org/10.1038/s41598-021-82803-2 9
Vol.:(0123456789)www.nature.com/scientificreports/
56. Kagan, Y. Y. & Houston, H. Relation between mainshock rupture process and Omori’s law for aftershock moment release rate.
Geophys. J. Int. 163, 1039–1048. https://doi.org/10.1111/j.1365-246X.2005.02772.x (2005).
57. Helmstetter, A., Kagan, Y. Y. & Jackson, D. D. Comparison of short-term and time-dependent earthquake forecast models for
southern California. Bull. Seismol. Soc. Am. 96, 90–106. https://doi.org/10.1785/0120050067 (2006).
58. Ogata, Y. Statistical models for earthquake occurrences and residual analysis for point processes. J. Am. Stat. Assoc. 83, 9–27. https
://doi.org/10.1080/01621459.1988.10478560 (1988).
59. Pfister, N., Bühlmann, P. & Peters, J. Invariant causal prediction for sequential data. J. Am. Stat. Assoc. 114, 1264–1276. https://
doi.org/10.1080/01621459.2018.1491403 (2018).
60. Gulia, L. et al. The effect of a mainshock on the size distribution of the aftershocks. Geophys. Res. Lett. 45, 13277–13287. https://
doi.org/10.1029/2018GL080619 (2018).
61. Dost, B., Ruigrok, E. & Spetzler, J. Development of seismicity and probabilistic hazard assessment for the Groningen gas field.
Geol. Mijnbouw Neth. J. Geosci. 96, s235–s245. https://doi.org/10.1017/njg.2017.20 (2017).
62. Nederlandse Aardolie Maatschappij. Technical Addendum to the Winningsplan Groningen 2016—Part 1: Summary & Production.
Tech. Rep. April, Nederlandse Aardolie Maatschappij B.V., Assen (2016).
63. Bierman, S., Randell, D. & Jones, M. No. SR.17.01246. Tech. Rep., Shell Global Solutions International B.V., Amsterdam (2017).
64. R Core Team. R: A Language and Environment for Statistical Computing (R Foundation for Statistical Computing, Vienna, 2019).
Acknowledgements
We thank the NAM for data on the faults and reservoir in the Groningen gas field, Shell for the compaction data
and the KNMI for the publicly available earthquake catalog. We thank J.N. Breunese (TNO), D.A. Kraaijpoel
(TNO), S. Osinga (TNO), Y. Raaijmakers (TU/e), Z. Zhan (TU/e) and G.A.O. Cremers (TU/e) for fruitful discus-
sions. The work of R.W. van der Hofstad is supported by The Netherlands Organisation for Scientific Research
(NWO) through VICI Grant 639.033.806 and the Gravitation Networks Grant 024.002.003. J.-P.A. was supported
by the French Government through the UCAJEDI Investments in the Future project managed by the National
Research Agency (Grant ANR-15-IDEX-01).
Author contributions
R.A.J.P. developed the model, analyzed the data and performed the simulation studies. M.A.J.M. initiated the
multidisciplinary project and analyzed the physics aspects of the model. E.R.H., M.A.J.M., J.-P.A., P.A.F., T.C.
and R.W.H. supervised the research and provided advice. R.A.J.P. wrote and M.A.J.M., J.-P.A., R.W.H. and E.R.H.
co-edited the Supplementary Information. R.A.J.P., M.A.J.M., T.C., J.-P.A. and E.R.H. contributed to the final
manuscript. R.A.J.P., M.A.J.M., T.C., P.A.F., J.-D.W., J.-P.A., R.W.H. and E.R.H. co-edited the final manuscript.
Competing interests
The authors declare no competing interests.
Additional information
Supplementary Information The online version contains supplementary material available at https://doi.
org/10.1038/s41598-021-82803-2.
Correspondence and requests for materials should be addressed to E.R.v.d.H.
Reprints and permissions information is available at www.nature.com/reprints.
Publisher’s note Springer Nature remains neutral with regard to jurisdictional claims in published maps and
institutional affiliations.
Open Access This article is licensed under a Creative Commons Attribution 4.0 International
License, which permits use, sharing, adaptation, distribution and reproduction in any medium or
format, as long as you give appropriate credit to the original author(s) and the source, provide a link to the
Creative Commons licence, and indicate if changes were made. The images or other third party material in this
article are included in the article’s Creative Commons licence, unless indicated otherwise in a credit line to the
material. If material is not included in the article’s Creative Commons licence and your intended use is not
permitted by statutory regulation or exceeds the permitted use, you will need to obtain permission directly from
the copyright holder. To view a copy of this licence, visit http://creativecommons.org/licenses/by/4.0/.
© The Author(s) 2021
Scientific Reports | (2021) 11:3540 | https://doi.org/10.1038/s41598-021-82803-2 10
Vol:.(1234567890)You can also read