Projected Changes in New Zealand Drought Risk - Deep South ...
←
→
Page content transcription
If your browser does not render page correctly, please read the page content below

Projected Changes in New Zealand
 Drought Risk
 An updated assessment using multiple drought indicators

 Prepared for Tonkin and Taylor,
as a contribution to the Deep South National Science Challenge project
 “Drinking water, drought and climate change”

 January 2020
Prepared by:
Abha Sood
Brett Mullan

For any information regarding this report please contact:
Abha Sood
+64-4-386 0577
abha.sood@niwa.co.nz

National Institute of Water & Atmospheric Research Ltd
Private Bag 14901
Kilbirnie
Wellington 6241

Phone +64 4 386 0300

NIWA CLIENT REPORT No: 2020011WN
Report date: January 2020
NIWA Project: TOT19301TOT19301

 Quality Assurance Statement

 Alan Porteous, Climate Scientist, NIWA
 Reviewed by:
 Wellington

 Formatting checked by: Patricia Rangel

 Approved for release by: Alison MacDiarmid

Image: Dry dam in Wairarapa drought [Dave Allen, NIWA]

This report should be referenced as:
Sood, A., Mullan, B. (2020). Projected changes in New Zealand drought risk: an updated assessment
using multiple drought indicators. NIWA Client Report 202001WN1
Contents

Executive summary ........................................................................................................... 10

1 Introduction ............................................................................................................ 11

2 Brief review of historic drought analysis and assessments......................................... 12

3 Climate Data and Drought Indices ............................................................................ 13
 3.1 Regional Climate data ............................................................................................. 14
 3.2 Calculation of daily New Zealand Drought Index (NZDI) ........................................ 17

4 Regional Impact ....................................................................................................... 20
 4.1 Time Evolution and Spatial Variability of 21st Century Droughts ........................... 20
 4.2 Multi-region droughts............................................................................................. 32

5 Drought Indicator Climatology Maps ........................................................................ 34
 5.1 SPI60 ....................................................................................................................... 35

6 Changes in intensity and duration of drought at study sites ...................................... 55

7 Discussion ............................................................................................................... 66

8 Acknowledgements ................................................................................................. 67

9 Glossary of abbreviations and terms ........................................................................ 68

10 References............................................................................................................... 68

Tables
Table 3-1: Listing of the six CMIP-5 models dynamically downscaled via NIWA’s regional
 climate model (RCM), and the scenarios and periods of the simulations. 15
Table 4-1: Number of days in the past, 1990s, two future, 2040s and 2090s periods and
 number of years (in brackets) where the “very dry” threshold is exceeded for
 Clim-NZDI for all six NZ-CMIP5 models and RCP8.5 emissions. 33
Table 6-1: The details of changes in drought characteristics across sites at the North and
 South Island as depict in Figs. 4-7, 4-13 and 6-1 to 6-7. The drought risk
 progressively increases over the century for all RCPs with lowest impact in the
 low emission scenario RCP2.6 and the highest in RCP8.5 unless otherwise
 stated. 56

Projected changes in New Zealand drought risk: An updated assessment
Figures
Figure 1-1: The water reservoir at Kiwitahi (left) that supplies water to Morrinsville,
 Waikato drying up during 2013 drought (NZ Herald, Christine Cornege) and
 Mangatangi Dam in the Hūnua Ranges that supplies water to Auckland was
 particularly low in late June 2019 (WATERCARE). 12
Figure 2-1: Total PED for July-May for years 1941/42 to 2012/13 for an average of 20
 stations in the Wairarapa. (Reproduced from section 2.11 of Porteous and
 Mullan, 2013). 13
Figure 3-1: Radiative Forcing of the Representative Concentration Pathways (left panel,
 from IPCC-AR5). The light grey area captures 98% of the range in previous
 Integrated Assessment Modelling scenarios, and dark grey represents 90% of
 the range. Simulated time series from 1950 to 2100 for global annual mean
 surface temperature (right panel, from IPCC-AR5). 14
Figure 3-2: Bias-adjusted sea surface temperatures, averaged over the RCM domain, for 6
 CMIP5 global climate models, and for the historical simulations (here 1960-
 2005) and four future simulations (RCPs 2.6, 4.5, 6.0 and 8.5), relative to 1986-
 2005. Individual models are shown by thin dotted or dashed or solid lines (as
 described in the inset legend), and the 6-model ensemble-average by thicker
 solid lines, all of which are coloured according to the RCP pathway. 16
Figure 3-3: The tail of distribution of individual DIs for the 6 CMIP5 model projections
 (coloured), their ensemble mean (grey) and the merged index, NZDI (black) for
 the historic reference period at one site. 19
Figure 4-1: The climate change signal for Clim-NZDI (first and second columns) and the
 SPI60 (third and fourth columns) of the model ensemble mean for RCP8.5
 emission scenario for the 2040s (first and third columns) and 2090s (second
 and fourth columns) time slices based on NZ-CMIP5 climate project data. The
 brown shades indicate increased drier conditions with respect to 1990s
 reference past period. 21
Figure 4-2: The 1990s (past, top) and the two future (2040s, middle; 2090s, bottom) time
 series of Clim-NZDI for all NZ-CMIP5 ensemble members for the RCP8.5
 emission scenario. The 1.50 threshold represents drought conditions. Different
 colours refer to the six global models. 22
Figure 4-3: The 1990s (past, top) and the two future (2040s, middle; 2090s, bottom) time
 series of SPI60 for all NZ-CMIP5 ensemble members for the RCP8.5 emission
 scenario. 23
Figure 4-4: The 1990s (past, top) and the two future (2040s, middle; 2090s, bottom) time
 series of SMD for all NZ-CMIP5 ensemble members for the RCP8.5 emission
 scenario. 24
Figure 4-5: The 1990s (past, top) and the two future (2040s, middle; 2090s, bottom) time
 series of SMDA for all NZ-CMIP5 ensemble members for the RCP8.5 emission
 scenario 24
Figure 4-6: The 1990s (past, top) and the two future (2040s, middle; 2090s, bottom) time
 series of PED60 for all NZ-CMIP5 ensemble members for the RCP8.5 emission
 scenario. 25
Figure 4-7: The mean annual cycle (July-June) with the drought classification (background
 colours) is presented above for Far North Northland location. The 20-year
 mean annual cycle for the six models (coloured, thin) and their ensemble mean
 (black, thick) in the left column in the historic period are compared with the
 ensemble mean for the four RCP’s at 2040s (middle column) and 2090s (right

Projected changes in New Zealand drought risk: An updated assessment
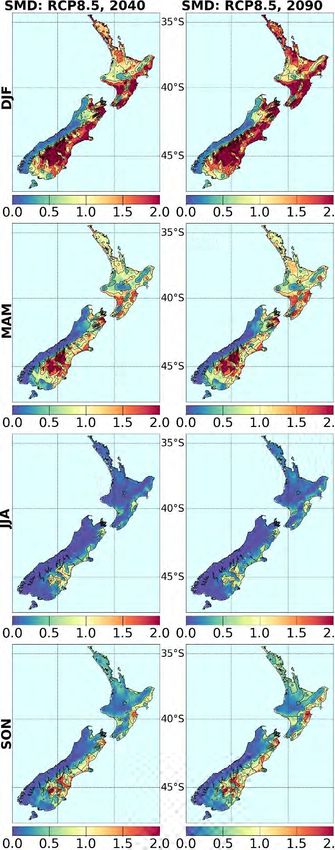
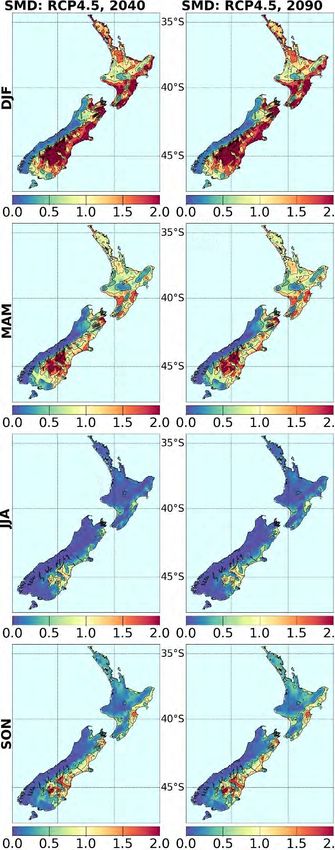
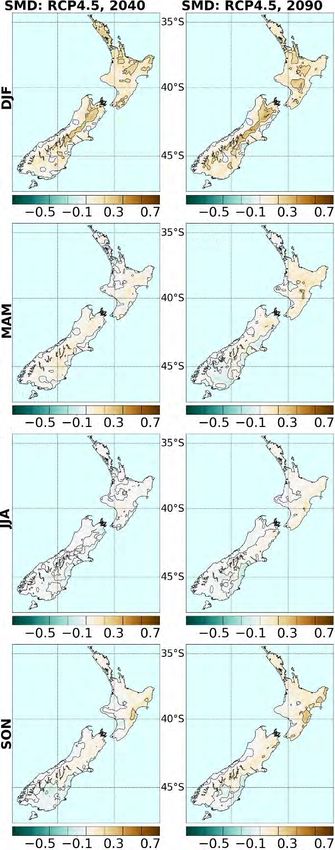
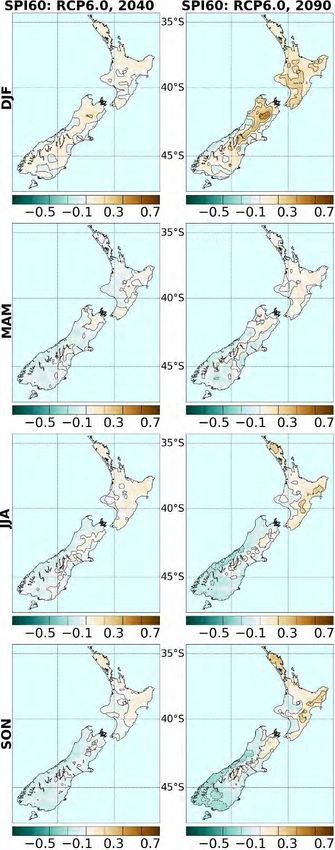
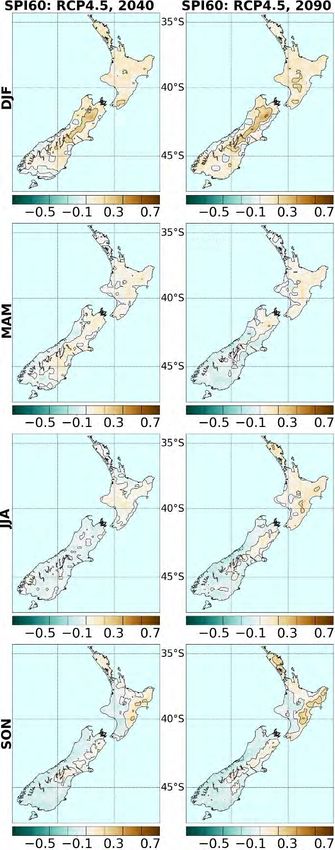
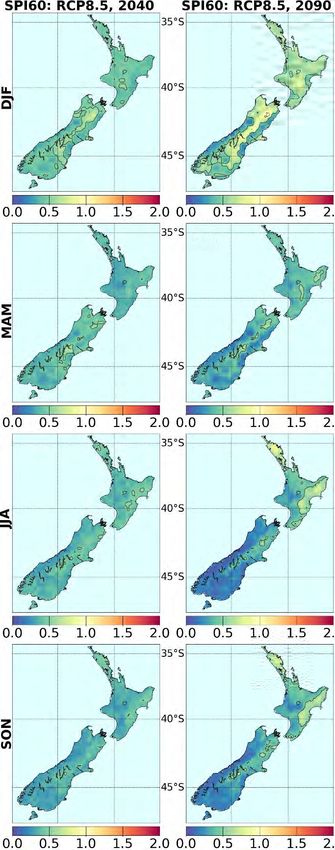
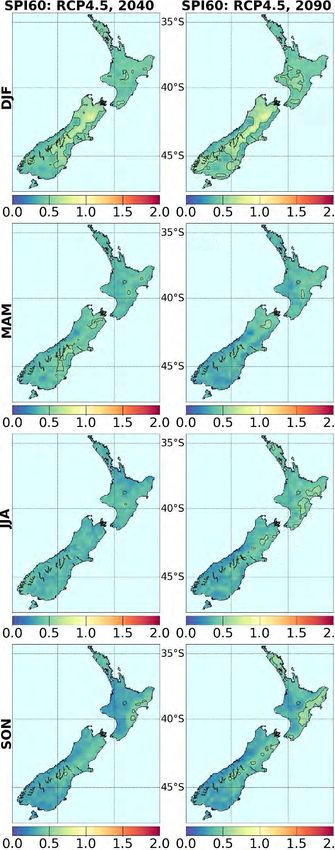
column). The drought behaviour at the three sites (Punakitere River, Wairoro
 stream and Lake Omapere) is very similar since they lie in close proximity to
 each other. 26
Figure 4-8: The 1990s (past, top) and the two future (2040s, middle; 2090s, bottom) time
 series of Clim-NZDI for all NZ-CMIP5 ensemble members for the RCP8.5
 emission scenario. The 1.50 threshold represents drought conditions. 27
Figure 4-9: The 1990s (past, top) and the two future (2040s, middle; 2090s, bottom) time
 series of SPI60 for all NZ-CMIP5 ensemble members for the RCP8.5 emission
 scenario. 28
Figure 4-10: The 1990s (past, top) and the two future (2040s, middle; 2090s, bottom) time
 series of SMD for all NZ-CMIP5 ensemble members for the RCP8.5 emission
 scenario. 28
Figure 4-11: The 1990s (past, top) and the two future (2040s, middle; 2090s, bottom) time
 series of SMDA for all NZ-CMIP5 ensemble members for the RCP8.5 emission
 scenario. 29
Figure 4-12: The 1990s (past, top) and the two future (2040s, middle; 2090s, bottom) time
 series of PED60 for all NZ-CMIP5 ensemble members for the RCP8.5 emission
 scenario. 30
Figure 4-13: The mean annual cycle (July-June) with the drought classification (background
 colours) is presented above for the central Canterbury site. The 20-year mean
 annual cycle for the six models (coloured, thin) and their ensemble mean
 (black, thick) in the left column in the historic period are compared with the
 ensemble mean for the four RCP’s at the middle (middle column) and the end
 of 21st century (right column 31
Figure 4-14: The total area (in %) at risk of drought (NZDI>1) for NZ-CMIP5 ensemble is
 shown in the top panel for one model (HadGEM2-ES. Larger area is under
 drought risk with Clim-NZDI > 1 more frequently in the 20-year time slice in
 2090s (red) than in the reference past time slice, 1990s (black). The risk of
 ‘back-to-back’ multi year drought is low and confined to small regions below
 10% nationally. 32
Figure 5-1: The seasonal climatology (1. And 2. columns) and the climate change signal (3.
 and 4. columns) of the model ensemble mean of SPI60 (that is SPI with 60-day
 reference period) for RCP2.6 emission scenario for the 2040s (1. and 3.
 columns) and 2090s (2. and 4. columns) time slices based on NZ-CMIP5 climate
 project data. The yellow to red colours indicate dry conditions in seasonal
 climatologies and brown shades indicate increased drier conditions with
 respect to 1990s reference past period. 35
Figure 5-2: The seasonal climatology (1. and 2. columns) and the climate change signal (3.
 and 4. columns) of the model ensemble mean of SPI60 (that is SPI with 60-day
 reference period) for RCP4.5 emission scenario for the 2040s (1. and 3.
 columns) and 2090s (2. and 4 columns) time slices based on NZ-CMIP5 climate
 project data. The yellow to red colours indicate dry conditions in seasonal
 climatologies and brown shades indicate increased drier conditions with
 respect to 1990s reference past period. 36
Figure 5-3: The seasonal climatology (1. and 2. columns) and the climate change signal (3.
 and 4. columns) of the model ensemble mean of SPI60 (that is SPI with 60-day
 reference period) for RCP6.0 emission scenario for the 2040s (1. and 3.
 columns) and 2090s (2. and 4. columns) time slices based on NZ-CMIP5 climate
 project data. The yellow to red colours indicate dry conditions in seasonal

Projected changes in New Zealand drought risk: An updated assessment
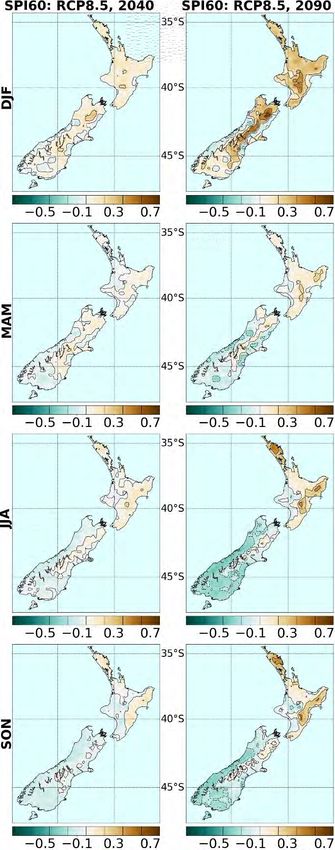
climatologies and brown shades indicate increased drier conditions with
 respect to 1990s reference past period. 37
Figure 5-4: The seasonal climatology (1. and 2. columns) and the climate change signal (3.
 and 4. columns) of the model ensemble mean of SPI60 (that is SPI with 60-day
 reference period) for RCP8.5 emission scenario for the 2040s (first and 3.
 columns) and 2090s (2. and 4. columns) time slices based on NZ-CMIP5 climate
 project data. The yellow to red colours indicate dry conditions in seasonal
 climatologies and brown shades indicate increased drier conditions with
 respect to 1990s reference past period. 38
Figure 5-5: The seasonal climatology (1. and 2. columns) and the climate change signal (3.
 and 4. columns) of the model ensemble mean of daily SMD for RCP2.6
 emission scenario for the 2040s (1. and 3. columns) and 2090s (2. and 4.
 columns) time slices based on NZ-CMIP5 climate project data. The yellow to
 red colours indicate dry conditions in seasonal climatologies and brown shades
 indicate increased drier conditions with respect to 1990s reference past
 period. 39
Figure 5-6: The seasonal climatology (1. and 2. columns) and the climate change signal (3.
 and 4. columns) of the model ensemble mean of daily SMD for RCP4.5
 emission scenario for the 2040s (1. and 3. columns) and 2090s (2. and 4.
 columns) time slices based on NZ-CMIP5 climate project data. The yellow to
 red colours indicate dry conditions in seasonal climatologies and brown shades
 indicate increased drier conditions with respect to 1990s reference past
 period. 40
Figure 5-7: The seasonal climatology (1. and 2. columns) and the climate change signal (3.
 and 4. columns) of the model ensemble mean of daily SMD for RCP6.0
 emission scenario for the 2040s (1. and 3. columns) and 2090s (2. and 4.
 columns) time slices based on NZ-CMIP5 climate project data. The yellow to
 red colours indicate dry conditions in seasonal climatologies and brown shades
 indicate increased drier conditions with respect to 1990s reference past
 period. 41
Figure 5-8: The seasonal climatology (1. and 2. columns) and the climate change signal (3.
 and 4. columns) of the model ensemble mean of daily SMD for RCP8.5
 emission scenario for the 2040s (1. and 3. columns) and 2090s (2. and 4.
 columns) time slices based on NZ-CMIP5 climate project data. The yellow to
 red colours indicate dry conditions in seasonal climatologies and brown shades
 indicate increased drier conditions with respect to 1990s reference past
 period. 42
Figure 5-9: The seasonal climatology (1. and 2. columns) and the climate change signal (3.
 and 4. columns) of the model ensemble mean of daily SMDA for RCP2.6
 emission scenario for the 2040s (1. and 3. columns) and 2090s (2. and 4.
 columns) time slices based on NZ-CMIP5 climate project data. The yellow to
 red colours indicate dry conditions in seasonal climatologies and brown shades
 indicate increased drier conditions with respect to 1990s reference past
 period. 43
Figure 5-10: The seasonal climatology (1. and 2. columns) and the climate change signal (3.
 and 4. columns) of the model ensemble mean of daily SMDA for RCP2.6
 emission scenario for the 2040s (1. and 3. columns) and 2090s (2. and 4.
 columns) time slices based on NZ-CMIP5 climate project data. The yellow to
 red colours indicate dry conditions in seasonal climatologies and brown shades

Projected changes in New Zealand drought risk: An updated assessment
indicate increased drier conditions with respect to 1990s reference past
 period. 44
Figure 5-11: The seasonal climatology (1. and 2. columns) and the climate change signal (3.
 and 4. columns) of the model ensemble mean of daily SMDA for RCP2.6
 emission scenario for the 2040s (1. and 3. columns) and 2090s (2. and 4.
 columns) time slices based on NZ-CMIP5 climate project data. The yellow to
 red colours indicate dry conditions in seasonal climatologies and brown shades
 indicate increased drier conditions with respect to 1990s reference past
 period. 45
Figure 5-12: The seasonal climatology (1. and 2. columns) and the climate change signal (3.
 and 4. columns) of the model ensemble mean of daily SMDA for RCP2.6
 emission scenario for the 2040s (1. and 3. columns) and 2090s (2. and 4.
 columns) time slices based on NZ-CMIP5 climate project data. The yellow to
 red colours indicate dry conditions in seasonal climatologies and brown shades
 indicate increased drier conditions with respect to 1990s reference past
 period. 46
Figure 5-13: The seasonal climatology (1. and 2. columns) and the climate change signal (3.
 and 4. columns) of the model ensemble mean of daily SMDA for RCP2.6
 emission scenario for the 2040s (1. and 3. columns) and 2090s (2. and 4.
 columns) time slices based on NZ-CMIP5 climate project data. The yellow to
 red colours indicate dry conditions in seasonal climatologies and brown shades
 indicate increased drier conditions with respect to 1990s reference past
 period. 47
Figure 5-14: The seasonal climatology (1. and 2. columns) and the climate change signal (3.
 and 4. columns) of the model ensemble mean of daily SMDA for RCP2.6
 emission scenario for the 2040s (1. and 3. columns) and 2090s (2. and 4.
 columns) time slices based on NZ-CMIP5 climate project data. The yellow to
 red colours indicate dry conditions in seasonal climatologies and brown shades
 indicate increased drier conditions with respect to 1990s reference past
 period. 48
Figure 5-15: The seasonal climatology (1. and 2. columns) and the climate change signal (3.
 and 4. columns) of the model ensemble mean of daily SMDA for RCP2.6
 emission scenario for the 2040s (1. and 3. columns) and 2090s (2. and 4.
 columns) time slices based on NZ-CMIP5 climate project data. The yellow to
 red colours indicate dry conditions in seasonal climatologies and brown shades
 indicate increased drier conditions with respect to 1990s reference past
 period. 49
Figure 5-16: The seasonal climatology (1. and 2. columns) and the climate change signal (3.
 and 4. columns) of the model ensemble mean of daily SMDA for RCP2.6
 emission scenario for the 2040s (1. and 3. columns) and 2090s (2. and 4.
 columns) time slices based on NZ-CMIP5 climate project data. The yellow to
 red colours indicate dry conditions in seasonal climatologies and brown shades
 indicate increased drier conditions with respect to 1990s reference past
 period. 50
Figure 5-17: The seasonal climatology (1. and 2. columns) and the climate change signal (3.
 and 4. columns) of the model ensemble mean of daily SMDA for RCP2.6
 emission scenario for the 2040s (1. and 3. columns) and 2090s (2. and 4.
 columns) time slices based on NZ-CMIP5 climate project data. The yellow to
 red colours indicate dry conditions in seasonal climatologies and brown shades

Projected changes in New Zealand drought risk: An updated assessment
indicate increased drier conditions with respect to 1990s reference past
 period. 51
Figure 5-18: The seasonal climatology (1. and 2. columns) and the climate change signal (3.
 and 4. columns) of the model ensemble mean of daily SMDA for RCP2.6
 emission scenario for the 2040s (1. and 3. columns) and 2090s (2. and 4.
 columns) time slices based on NZ-CMIP5 climate project data. The yellow to
 red colours indicate dry conditions in seasonal climatologies and brown shades
 indicate increased drier conditions with respect to 1990s reference past
 period. 52
Figure 5-19: The seasonal climatology (1. and 2. columns) and the climate change signal (3.
 and 4. columns) of the model ensemble mean of daily SMDA for RCP2.6
 emission scenario for the 2040s (1. and 3. columns) and 2090s (2. and 4.
 columns) time slices based on NZ-CMIP5 climate project data. The yellow to
 red colours indicate dry conditions in seasonal climatologies and brown shades
 indicate increased drier conditions with respect to 1990s reference past
 period. 53
Figure 5-20: The seasonal climatology (1. and 2. columns) and the climate change signal (3.
 and 4. columns) of the model ensemble mean of daily SMDA for RCP2.6
 emission scenario for the 2040s (1. and 3. columns) and 2090s (2. and 4.
 columns) time slices based on NZ-CMIP5 climate project data. The yellow to
 red colours indicate dry conditions in seasonal climatologies and brown shades
 indicate increased drier conditions with respect to 1990s reference past
 period. 54
Figure 6-1: The mean annual cycle (July-June) with the drought classification (background
 colours) is presented for Cosseys Dam, Auckland. The 20-year mean annual
 cycle for the six models (coloured, thin) and their ensemble mean (black) in the
 left column in the historic period are compared with the ensemble mean for
 the four RCPs at 2040s (middle) and 2090s (right). This location experiences a
 drier winter, slightly wetter (or no change) spring and drier summer (top row)
 which results in significant drier conditions throughout the summer already in
 the 2040s but intensifies in 2090s relative to the historic period (left column,
 black) in the summer and winter seasons. The Clim-NZDI (bottom row)
 indicates higher risk of earlier onset in the spring but negative values or no
 change in the SPI at the beginning of the annual cycle due to increased rainfall
 indicate lower risk of "back-to-back" droughts. 57
Figure 6-2: The mean annual cycle (July-June) with the drought classification (background
 colours) is presented for Te Miro reservoir, Waikato. The 20-year mean annual
 cycle for the six models (coloured, thin) and their ensemble mean (black) in the
 left column in the historic period are compared with the ensemble mean for
 the four RCPs at 2040s (middle) and 2090s (right). Despite similar change of
 precipitation index (top row) to the Auckland site, there is a much larger
 increase of drought risk (bottom row) with the onset earlier in late-spring to
 summer in the already appearing in the 2040s but intensifies in 2090s relative
 to the historic period (left column, black). 58
Figure 6-8: Same as Fig 6-3, but for New Plymouth, Taranaki. The 20-year mean annual
 cycle for the six models (coloured, thin) and their ensemble mean (black) in the
 left column in the historic period are compared with the ensemble mean for
 the four RCPs at 2040s (middle) and 2090s (right). Much wetter late winter
 and early spring delay but not avoid early onset and intensification of drought

Projected changes in New Zealand drought risk: An updated assessment
conditions for all emission scenarios other than RCP2.6. The risk of “back-to-
 back” droughts is low. 59
Figure 6-3: The mean annual cycle (July-June) with the drought classification (background
 colours) is presented for Te Arai River, Gisborne. The 20-year mean annual
 cycle for the six models (coloured, thin) and their ensemble mean (black) in the
 left column in the historic period are compared with the ensemble mean for
 the four RCPs at 2040s (middle) and 2090s (right). Similar to Northland
 locations, all seasons are drier which results in significant increase of drought
 risk onset earlier in late-spring to summer in the already in the 2040s but
 intensifies in 2090s relative to the historic period (left column, black). The
 Clim-NZDI (bottom panels) indicates higher risk of earlier onset and the higher
 values at the beginning and the end of the annual cycle pointing towards
 higher risk of "back-to-back" and more intense droughts 60
Figure 6-6: Same as Fig 6-3, but for Turitea Dam , Manawatu-Whanganui. The 20-year
 mean annual cycle for the six models (coloured, thin) and their ensemble mean
 (black) in the left column in the historic period are compared with the
 ensemble mean for the four RCPs at 2040s (middle) and 2090s (right). Despite
 wetter winter and early spring, the drought risk onset is earlier and lasts longer
 progressively over the 21st century but “back-to-back” drought conditions are
 avoided. 61
Figure 6-7: Same as Fig 6-3, but for Masterton East, Wellington. The 20-year mean annual
 cycle for the six models (coloured, thin) and their ensemble mean (black) in the
 left column in the historic period are compared with the ensemble mean for
 the four RCPs at 2040s (middle) and 2090s (right). Somewhat drier winter and
 wetter spring conditions does not hinder earlier onset of drought conditions.
 The summer drought is longer and more intense especially for RCP8.5 emission
 scenario but little change is experienced under RC2.6 conditions. 62
Figure 6-4: Same as Fig. 4-13, for Lee River, Tasman. The 20-year mean annual cycle for
 the six models (coloured, thin) and their ensemble mean (black) in the left
 column in the historic period are compared with the ensemble mean for the
 four RCPs at 2040s (middle) and 2090s (right). This location experiences
 wetter winter and spring and much drier summer (top panels) which results in
 significant increase of drought risk throughout the summer in the already in
 the 2040s but intensifies in 2090s relative to the historic period (left column,
 black). The Clim-NZDI (bottom panels) indicates higher risk of earlier onset and
 a more intense drought. The lower values at the beginning of the annual cycle
 due to increased rainfall indicate lower risk of "back-to-back" droughts. 63
Figure 6-5: Same as Fig 6-3, but for Pukaki Dam, Canterbury. The 20-year mean annual
 cycle for the six models (coloured, thin) and their ensemble mean (black) in the
 left column in the historic period are compared with the ensemble mean for
 the four RCPs at 2040s (middle) and 2090s (right). This location experiences a
 similar but more intense signal of change than at the central Canterbury site
 (Fig. 6-3), with earlier, longer and more intense drought. 64

Projected changes in New Zealand drought risk: An updated assessment
Executive summary
It is internationally accepted that human greenhouse gas emissions are the dominant cause of recent
global climate change, and that further changes will result from already present and increasing
amounts of greenhouse gases in the atmosphere. One of the expected changes for New Zealand is an
increase in frequency and severity of droughts, with consequent detrimental impacts on water
quality and availability, crop production, wild fire risk and the health of natural systems.

A report on “Drinking water, drought and climate change” was commissioned by the Deep South
National Science Challenge, and is being led by the environmental and engineering consultancy
Tonkin and Taylor. The material in the present document has been prepared by NIWA under a
subcontract to Tonkin and Taylor to address the likelihood of how future New Zealand droughts will
change in location and intensity, and provide improved insight into what impacts these changes may
have on drinking water supplies.

Previous work has shown that the intensity, duration and frequency of future droughts for New
Zealand will largely depend on the future greenhouse gas concentrations increase, with drought
characteristics becoming more severe for the higher emission scenarios in most regions.

This report applies a series of indices used to monitor drought in New Zealand to develop an
improved method of analysing future drought risk under scenarios of climate change, and thereby
supports improved understanding of risks to potable water supplies resulting from climate change.

Some key findings of this report are:

 - New Zealand drought is characterised by the “New Zealand Drought Index” (NZDI) and four
 constituent indices. The leading cause of increase in drought risk is the temperature-driven
 increase in atmospheric water demand which leads to drier soil conditions, water stress for
 vegetation and low hydrological flows. Lower emission scenarios will result in lower drought
 risk increase since temperature increase is considerably lower nationwide.

 - Precipitation deficit due to changing precipitation patterns is also a major driver of drought
 in some regions, but increased drying due to increased temperature alone may be sufficient
 to trigger droughts even when there is no change in or even an increase in precipitation.

 - Whilst in some regions the frequency of “back-to-back” droughts may appear to decrease
 due to higher winter and spring precipitation due to climate change, the national trend is
 that they will increase. Even in some regions, such as around Nelson and Tasman, with lower
 “back-to-back” drought risk conditions, higher risk of deeper drought in the main growing
 season is likely to have a strong impact.

 - The lower drought risk conditions that are mostly prevalent in the winter and early spring
 season are in contrast to the higher risk of drought later in the main growing season.

 - Stream and river flow and drinking water reservoir levels are likely be adversely affected
 especially in the late spring and summer seasons at all sites used in this study impacted by
 “very dry” to “drought” conditions.

 - Drought risk in most regions, and for almost all sites used in this study, is mostly impacted by
 increases in summer temperature drying the soils, as evident in significant increase in Soil
 Moisture Deficit (SMD) and the climate drought index, Clim-NZDI. In the winter season,

Projected changes in New Zealand drought risk: An updated assessment 10
some eastern and southern North Island and the two South Island sites are wetter than in
 the past (1990s) and can avoid “back-to-back” drought risk due to improved winter recharge.
 The Northland and Gisborne sites, on the other hand, are at higher risk of “back-to-back”
 drought due to drier winters.

 - This report represents a major advance in the diagnosis of future New Zealand droughts. For
 the first time, the annual cycle of the drought indices is represented at a daily time-step, and
 the four constituent indices making up the Clim-NZDI allow us to assign causes to the
 drought changes, in particular whether they are driven by temperature or rainfall changes.

The drought calculations used in this study are derived from simulations by six global climate models,
driven by four IPCC Fifth Assessment emission scenarios known as RCPs 2.6, 4.5, 6.0 and 8.5. The
global models are dynamically downscaled using a 27-km regional climate model, and subsequently
bias-corrected and further downscaled to a 5-km grid covering the whole country.

The drought index used is known as the New Zealand Drought Index (NZDI), which is similar to
NIWA’s operational calculations from observed data but applied to the climate model output.
However, some technical differences in the calculation that we use here require us to distinguish this
new climate drought index which we refer to as “Clim-NZDI”. Clim-NZDI is comprised of four
component indices, representing the Standardised Precipitation Index (SPI), the Soil Moisture Deficit
(SMD), the Soil Moisture Deficit Anomaly (SMDA), and the Potential Evapotranspiration Deficit (PED).

1 Introduction
Future droughts are likely to be exacerbated through a warming climate and changing rainfall
patterns with resulting increased risk of detrimental impacts on water quality and availability, crop
production, wild fire risk and the health of natural systems. One of the potential risks is that drinking
water supplies may decrease below critical levels for some communities in drought prone regions
(Fig. 1-1). This study investigates regional differences to changes in drought vulnerability and
characteristics across New Zealand in the latest future climate change projections of the Coupled
Model Intercomparison Project Phase 5 (CMIP5) archive of the Intergovernmental Panel on Climate
Change (IPCC) - 5th Assessment (AR5) [IPCC, 2013; Stocker et al., 2013].

The higher resolution regional climate model (RCM) simulations for both historic (past) and future
period for New Zealand [Ackerley et al., 2010; Sood, 2015], are performed forced by “best
performing” lower resolution CMIP5 global climate models (NZ-CMIP5) [Mullan et al., 2013a, 2013b].
The bias corrected and high-resolution NZ-CMIP5 simulations enable determination of finer scale
regional climate impact for the New Zealand region, from which we can explicitly compute drought
indices. We examine the frequency, intensity, duration and geographic extent of the past and future
meteorological droughts in New Zealand’s regional climate model simulations.

For the region as a whole, the future NZ-CMIP5 projections suggest that the area affected by both
mild and severe meteorological drought will increase in the existing vulnerable regions in the second
half of the 21st century. Extremes of wetness are also projected to increase from around mid-century
(2040s) in western and southern South Island, with a decrease in drought occurrence and intensity in
winter and spring seasons in those locations. Our analyses suggest that continued high emissions of
greenhouse gases will increase the likelihood of the dry (and wet) extremes in most parts of the
country due to large modifications in the hydrological cycle. These new estimates bring into sharp
focus the need to assess the vulnerability and sustainable management of New Zealand’s drinking

11 Projected changes in New Zealand drought risk: An updated assessment
water resources. These efforts to improve understanding of drought within this broader framework
are required to support planning.

Figure 1-1: The water reservoir at Kiwitahi (left) that supplies water to Morrinsville, Waikato drying up
during 2013 drought (NZ Herald, Christine Cornege) and Mangatangi Dam in the Hūnua Ranges that supplies
water to Auckland was particularly low in late June 2019 (WATERCARE).

2 Brief review of historic drought analysis and assessments
The earliest study of projected increases in New Zealand drought risk under climate change was
carried out by Mullan et al. (2005), based on two global climate models from the IPCC 2001 Third
Assessment. The analysis calculated future changes in return period of the current one-in-twenty-
year drought defined in terms of Potential Evapotranspiration Deficit (PED). Drought risk was
projected to increase during the century in all areas currently already drought-prone, becoming at
least twice as frequent by the 2080s under a ‘low-medium’ scenario, and more than four times as
often under a more extreme ‘medium-high’ scenario. The regions most affected were parts of
Northland, Bay of Plenty, Hawkes Bay, Wairarapa, Marlborough, eastern Canterbury and inland
Otago.

A subsequent study by Clark et al. (2011) was based on the IPCC Fourth Assessment projections using
the three major greenhouse gas emission scenarios B1, A1B and A2, and improved statistical
downscaling methods to provide localised climate scenarios for New Zealand. The key finding was
that New Zealand should plan for around 10% additional time spent in drought by the middle of the
century for key eastern agricultural regions. The findings from earlier studies [Clark et al., 2011;
Renwick et al., 2012; Mullan et al., 2018] that the drought risk is expected to increase during the 21st
century in the current drought prone regions under ‘medium’ to ‘high’ emissions scenarios and not
much change is evident in the ‘low’ emissions case are also generally corroborated in this study using
latest ``State-of-the-Art'' climate data.

The most plausible and consistent outcome based on these Fourth Assessment Report (AR4) climate
models and different downscaling methods was a marked increase in drought on the east and north
coast of the North and South Island. An equally strong signal was found for no significant change or
even decrease in drought exposure on the West Coast of the South Island. Although the projections
were not as consistent across the different climate models, strong evidence for increases in time
spent in drought were also found around Hawkes Bay-Gisborne and Northland extending to the

Projected changes in New Zealand drought risk: An updated assessment 12
Waikato. This overall geographic pattern of change was largely insensitive to climate model but with
small differences between the ‘low’ and ‘medium to high’ emissions scenarios. For the remainder of
the North Island and Nelson-Marlborough northern east coast on the South Island, the prospect of
increased exposure to drought ranged from minimal change through to over a doubling in time spent
in drought in these regions depending upon the climate model and scenario considered.

Drought conditions were unusually widespread across New Zealand during the 2012-13 agricultural
season, and particularly serious in the North Island. The Ministry for Primary Industries requested an
assessment by NIWA of the 2012-13 drought and a comparison against previous droughts as far back
as records allowed. PED calculations were applied to long-record station observations, extending as
far back as the early 1940s (Figure 2-1), and also to NIWA’s 5-km gridded data known as the Virtual
Climate Station Network (VCSN) which begins in 1972. Both analyses showed that the 2012-13
drought was one of the most extreme on record for New Zealand. The VCSN calculations indicated
the PED accumulation to May 2013 was the highest in 41 years at 34% of the North Island VCSN grid-
points, which was a much larger areal coverage than any other drought in the VCSN period.

The most recent climate change projections for New Zealand [Mullan et al., 2018] provide a
comprehensive national overview of changes in many climatic variables through to the end of the
century and beyond, based on downscaling the six global models mentioned in Section 3-2. Variables
considered are: temperature (maximum, minimum and mean), precipitation, hot days (above 25°C),
frost days, dry and wet days, pressure, wind, solar radiation and relative humidity. Drought incidence
is addressed through calculations of Potential Evapotranspiration Deficit (PED), which are superseded
in this current report.

Figure 2-1: Total PED for July-May for years 1941/42 to 2012/13 for an average of 20 stations in the
Wairarapa. (Reproduced from section 2.11 of Porteous and Mullan, 2013).

3 Climate Data and Drought Indices
Past and future climate is simulated by global climate models (GCMs), which include atmosphere,
ocean, land and sea-ice components, and are driven by natural external climate forcings such as solar
irradiance and historic volcanic emissions (no volcanic emissions in future projections), and by
anthropogenic forcings which include greenhouse gases and aerosols. Additional information on
land-use changes and biogeochemistry are incorporated in the latest version of GCMs, now termed
earth system models (ESMs). The greenhouse gases emissions, that are consistent with socio-

13 Projected changes in New Zealand drought risk: An updated assessment
economic developments over the 21st century, are used to determine greenhouse gases and aerosol
pathways known as Representative Concentration Pathways (RCPs), [van Vuuren et al., 2011].

For the AR5 (IPCC, 2013), the four RCPs developed are described by their approximate total
(accumulated) radiative forcing at 2100 relative to preindustrial year 1750: 2.6 W m-2 for RCP2.6, 4.5
W m-2 for RCP4.5, 6.0 W m-2 for RCP6.0, and 8.5 W m-2 for RCP8.5 (Fig 3-1, left). These RCPs include
one mitigation pathway (RCP2.6. which requires removal of some of the CO2 presently in the
atmosphere), two stabilization pathways (RCP4.5 and RCP6.0), and one pathway (essentially
“business as usual”) with very high greenhouse gas concentrations by 2100 and beyond. The
corresponding mean overall global surface temperature response of the climate system presented in
Figure 3-1 (right) for the four RCPs ranges from 0.5 to 5 °C above that of the preindustrial period.

Figure 3-1: Radiative Forcing of the Representative Concentration Pathways (left panel, from IPCC-AR5).
The light grey area captures 98% of the range in previous Integrated Assessment Modelling scenarios, and
dark grey represents 90% of the range. Simulated time series from 1950 to 2100 for global annual mean
surface temperature (right panel, from IPCC-AR5).

The number of global climate model (GCM) simulations available in the data archive for the AR5
varies with the selected RCP. The maximum numbers of GCMs with necessary archived data are: 41
(‘historical period’, 1800s up to 2005), 23 (RCP2.6), 37 (RCP4.5), 18 (RCP6.0), and 41 (RCP8.5). The
future simulations begin in 2006 and extend beyond 2100 for some simulations. This current report
only considers changes in drought through to 2100.

3.1 Regional Climate data
The global model performance is quantified in terms of a metric that aggregates many different
circulation and climatic factors: the position and intensity of the westerly wind maximum and the
subtropical high pressure belt; spatial patterns in the key climate variables (e.g., correlation of
summer minus winter rainfall, temperature and pressure patterns, observed versus modelled), El
Niño-Southern Oscillation teleconnections (correlations of the Southern Oscillation Index versus
rainfall , temperature and pressure fields); and annual cycles in key circulation indices such as the
Trenberth Z1 and M1 indices [Mullan et al., 2013a,b; Mullan et al., 2018]. There is a general
improvement in the CMIP5 models in simulating mean climate and seasonal and interannual
variability in the New Zealand-Pacific region relative to the earlier CMIP simulations.

Based on the above analysis and available simulations (all emission scenarios), six coupled global
circulation models (GCMs) from different institutions with mostly independent model developments
were selected for dynamical downscaling (Table 3-1). The selected models validated well on present
climate and were as different as possible in the parent global model in order to span the likely range

Projected changes in New Zealand drought risk: An updated assessment 14
of IPCC projections. The bias corrected sea surface temperatures (Figure 3-2) taken from the selected
models force the atmospheric component of the GCM (AGCM) [Anagnospoulou et al., 2008] at low
resolution (~150 km), which in turn drives a higher resolution (~27 km) regional climate model (RCM)
over New Zealand [Ackerley et al., 2012]. The RCM output data are bias-corrected relative to a 1980-
1999 climatology, and further downscaled to a 5 km grid [Sood, 2015]. The processed RCM output,
NZ-CMIP5, is used to determine the drought indices nation-wide and run NIWA’s TopNet hydrological
model to simulate river flow for the catchments used in this study.

Table 3-1: Listing of the six CMIP-5 models dynamically downscaled via NIWA’s regional climate model
(RCM), and the scenarios and periods of the simulations.

 CMIP5-Models Historic RCP2.6 RCP4.5 RCP6.0 RCP8.5
 HadGEM2-ES 1971-2005 2006-2120 2006-2120 2006-2099 2006-2120
 MOHC (UK)

 CESM1-CAM5 1971-2005 2006-2120 2006-2120 2006-2120 2006-2100
 NSF-DOE-NCAR (USA)
 NorESM1-M 1971-2005 2006-2100 2006-2100 2006-2100 2006-2100
 NCC (Norway)
 GFDL-CM3 1971-2005 2006-2100 2006-2120 2006-2100 2006-2100
 NOAA-GFDL (USA)
 GISS-E2-R 1971-2005 2006-2120 2006-2120 2006-2100 2006-2120
 NASA-GISS (USA)
 BCC-CSM1.1 1971-2005 2006-2120 2006-2120 2006-2099 2006-2120
 BCC (China)

Figure 3-2 shows the bias-adjusted sea surface temperatures used to force the NIWA’s AGCM and
RCM, presented here only for the mean value over the RCM domain. For the mitigation pathway
(RCP2.6), sea temperatures increase to a maximum around mid-century, and thereafter decline
slightly. In the other pathways, SSTs continue to increase throughout the period, with a much larger
rate of change in the high greenhouse gas pathway (RCP8.5).

15 Projected changes in New Zealand drought risk: An updated assessment
Figure 3-2: Bias-adjusted sea surface temperatures, averaged over the RCM domain, for 6 CMIP5 global
climate models, and for the historical simulations (here 1960-2005) and four future simulations (RCPs 2.6,
4.5, 6.0 and 8.5), relative to 1986-2005. Individual models are shown by thin dotted or dashed or solid lines
(as described in the inset legend), and the 6-model ensemble-average by thicker solid lines, all of which are
coloured according to the RCP pathway.

The “added value” in dynamical downscaling lies in the realistic simulations of a physically consistent
set of temporally and spatially highly resolved fields. The interactions of the large-scale circulation
with higher resolution orography and other surface features (e.g., land-sea interface, vegetation
cover, large lakes etc.) are well captured in Regional Climate Model (RCM) simulations resolving a
diverse range of climatic features. Nevertheless, errors inherent in representing local surface
conditions, atmospheric processes and external forcing in RCMs lead to considerable systematic
biases in simulating regional variables. By removing systematic errors and thus reducing biases, RCM
data are more realistic over the historic period [Sood, 2015]. Subsequently, the corrected data are
input in downstream environmental models for realistic outputs which are comparable to
observations and are necessary to improve the confidence in regional climate impact studies. The
iterative dynamical downscaling procedure developed at NIWA is designed to reduce systematic
biases over a wide range of spatiotemporal scales.

Since the ‘free-running’ global climate simulations are not constrained by observations for the past
period, the model climatological characteristics are compared to observations over a common
reference period. Thus, year-to-year variability in a model and observation do not match pointwise.
This is why only the climatologies of the observed and simulated data rather than the time series are
compared.

In this project, projections for all four RCPs, and for two future time periods which are abbreviated as
“2040” and “2090” were used. The two time periods represent changes for the 20-year periods 2031-
2050 and 2081-2100, respectively, relative to the baseline 1986-2005. This is the same baseline as
used in the IPCC AR5 Report (IPCC, 2013), and NIWA’s recent projections [Mullan et al., 2018], and
the last 20 years of what CMIP5 refer to as the “historical” or the “past” period.

Projected changes in New Zealand drought risk: An updated assessment 16
3.2 Calculation of daily New Zealand Drought Index (NZDI)
The New Zealand Drought Index (NZDI) is a combination of four constituent drought indices (DIs),
which are defined in Section 3.2.1 such that positive values indicate dry conditions. Since the
individual indices can have different ranges and units and are not directly comparable, they are
normalized and transformed using a logarithmic function to synchronise characteristics for coinciding
values before merging.

The NZDI is used for current national drought monitoring applications [Mol et al., 2017]. The
operational New Zealand Drought Monitor produces updated maps daily and time series products
are available online at NIWA web site (https://niwa.co.nz/climate/information-and-
resources/drought-monitor). The NZDI products were previously reviewed by stakeholders from the
meteorological, agricultural and government sectors to provide a decision support service that can
be applied to many uses, as needed and determined by the users.

The operational NZDI and the constituent drought indicators (DIs) calculate: (Standardised
Precipitation Index (SPI), Soil Moisture Deficit (SMD) and its anomaly (SMDA), and Potential
Evapotranspiration Deficit (PED)), which we have further developed and modified for climate
application and refer to as Clim-NZDI. The Clim-NZDI and adjusted DI’s are determined using bias
corrected regional climate model (NZ-CMIP5) projections downscaled on 5-km horizontal grid [Sood,
2015] based on 6 selected CMIP5 (Table 3-1) models [Mullan et al., 2013a].

3.2.1 Drought Indicators Definitions
Drought is a period of very dry weather conditions with significantly reduced surface water causing
severe hydrologic imbalances. The primary cause of drought occurrence is inadequate precipitation
to sustain environmental water demands. The first DI we use is the unitless localized Standardized
Precipitation Index (SPI) based only on precipitation, which is a widely used drought indicator
[McKee et al., 1993]. It is a normalized index defined locally as the total precipitation over a suitable
accumulation period relative to its long-term (20-year) average for the same period. This enables
direct comparison between precipitation variation between locations with different precipitation
regimes. The SPI is especially relevant for spatially diverse New Zealand precipitation with large
orographic imprint. The selection of a 60-day accumulation period is based on the observation that a
period of around two months with well-below normal rainfall is usually sufficient to trigger drought-
like conditions in New Zealand [Mol et al., 2017). A gamma distribution is fitted to the historical
precipitation data and transformed into a normal distribution. The SPI value is then defined as the z-
score on that distribution. Positive (negative) SPI values represent less (greater) than median
precipitation, and application-specific SPI thresholds can be defined to characterise the onset and
end of drought conditions [Guttman, 1998]. The more positive the SPI, the drier the conditions.

A precipitation-based index is inadequate to completely characterize droughts since they are
complex phenomena exacerbated by the reduction of soil moisture due to the lack of rainfall or
increased evapotranspiration or both combined. Surface evapotranspiration is the process where
water from the surface transfers to the atmosphere through soil surface evaporation and
evapotranspiration from plants (includes water transported by plants from deeper soil layers). The
next two DIs characterise soil moisture deficit (SMD) and SMD anomaly (SMDA).

As the temperature increases (for an annual cycle which starts in July and ends in June) and the
austral seasons advance from winter to spring and summer, the amount of water removed from soil
through evapotranspiration begins to exceed recharge through rainfall, leading to a decrease in soil

17 Projected changes in New Zealand drought risk: An updated assessment
moisture content (SM). The soil moisture content is determined by the soil water budget shown in
equation (1). It is the incremented daily with the difference between rainfall and actual
evapotranspiration (AET) below the soil water carrying capacity threshold termed available water
capacity (AWC). The soil type and characteristics determine AWC, where an AWC of 150mm is typical
for New Zealand’s silt-loam soils [Porteous et al., 1994] and used to define a simple single layer soil
model. The excess of surface water budget above the AWC threshold is inferred as the surface
runoff.

 ( ) = ( − 1) + ( ) − ( ), ( ) ≤ (1)

 ( ) = ( ) − ,
 ( ) > (2)
 ( ) =

The Soil Moisture Deficit (SMD) is the amount of water in the soil (SM) short of field capacity (AWC).
 ( ) = − ( ) (3)
The SMD anomaly (SMDA) is calculated locally at each land grid point with respect to a 20-year
(1986-2005) SMD reference period. As an example, if the SMD is higher than 110 mm, and the
anomaly is more than 20 mm drier than normal, then soils are often referred to as ‘severely drier
than normal’ and drought conditions (if not present already) may be imminent.

As soil moisture decreases, the plant production becomes moisture-constrained and actual
evapotranspiration (AET) can no longer meet atmospheric demand. This demand, termed potential
evapotranspiration (PET), is the amount of water that will evaporate and transpire given
unconstrained water availability [Lu et al., 2005]. PET is calculated using the FAO-56 Penman-
Monteith method [Allen et al., 1998, Prudhomme et al., 2012] for an idealized grass reference crop
of 0.12 m height and an albedo of 0.23 [Allen et al., 1998]. Based on the single layer water balance
model of Porteous et al. (1994), if half or more of the total soil moisture capacity (HAWC=AWC/2) is
available, PET and AET are set equal. If less than half of the total soil moisture capacity is available,
AET reduces linearly proportional to PET.

 −
 = ( 1 −
 ), < < 150 and
 (4)
 = , ≤

The difference between the potential (PET) and the actual evapotranspiration (AET) is defined as the
‘Potential Evapotranspiration Deficit’ (PED) (e.g., Mullan et al. 2005), the fourth and last DI. Since
AET is always equal to or less than PET, PED remains positive or zero. Days with positive PED when
the water demand is not met, and pasture growth is reduced, are referred to as days of potential
evapotranspiration deficit. PED is designed to provide a measure of drought intensity and duration
taking environmental demand into account. In practice, PED represents the total amount of water
required by irrigation, or that needs to be replenished by precipitation, to maintain plants growing at
optimum levels. Thus, higher PED totals indicate drier soils. An increase in PED of 30 mm or more
corresponds to about an extra week of reduced grass growth.

Projected changes in New Zealand drought risk: An updated assessment 18
3.2.2 The Climate-NZDI
The present implementation of NZDI [Mol et al., 2017] used for operational monitoring applications
requires appropriate modifications for climate applications. A fixed past time slice is used to define a
reference period, unlike the daily shifting reference period used operationally. The arbitrary
smoothing and weighting factors are avoided in computing the Climate-NZDI (Clim-NZDI) and
averaging or reference periods among the constituent DIs are aligned. The Clim-NZDI is defined as
the average of the positive part of four DIs with reference to the accumulation period “p”, where p is
set to 60 days for daily SPI and PED indices in this study. Accumulation for SMD and SMDA indices is
not required since they are defined incrementally which includes historic imprint.

The SPI (SPI60) is based on normalized and standardized (z-scores) precipitation which is rescaled
using logarithmic transformation to a range from -3 to 3. The range of 0.75 – 1 indicate drier than
normal, 1-1.25 very dry, 1.25-1.5 extremely dry, 1.5-1.75 drought and above 1.75 severe drought
conditions. The other three indices are normalized and logarithmically transformed and rescaled to
match the SPI range (equation 5).

 = −log 2 (1. − )
 max
 max = =
 = max ( ( )) = (5)
 where
 = max ( 60( )) = 60

In Fig 3-3, we see the dry part of the distribution of constituent DI’s and the merged Clim-NZDI is
based on all drought drivers: precipitation, temperature, soil and vegetation. The grey lines are the
ensemble-average over six models (coloured lines) for the four DI’s, and the black line indicates the
corresponding ensemble-average of the Clim-NZDI.

Figure 3-3: The tail of distribution of individual DIs for the 6 CMIP5 model projections (coloured), their
ensemble mean (grey) and the merged index, NZDI (black) for the historic reference period at one site.

19 Projected changes in New Zealand drought risk: An updated assessment
4 Regional Impact
Here we present the simulated drought conditions for the past reference and future periods with
expected changes in frequency and intensity of droughts, especially in the drought prone regions.
The spatial patterns provide a general picture of likely changes at the national level (Sections 4.1 and
5). The changes in disparate drought characteristics are illustrated in more detail for two selected
sites at Wairoro Stream, Northland (Sections 4.1.1) and central Canterbury (Section 4.1.2) from the
case studies. The relative influence of rainfall deficit (SPI60) versus soil moisture deficit (SMD) on
droughts varies by their location. For the two example sites presented here, the SPI60 changes
dominate for the Northland site, whereas the SMD changes dominate for Central Canterbury site.

The drought indices vary considerably regionally, but a general finding is for droughts to intensify
progressively in the future, as indicated by higher Clim-NZDI. Under higher emission scenarios,
droughts occur earlier in the July-June water year, which we refer to here as the annual cycle. In
some regions, the drought conditions do not improve much during the typically wet winter season,
which can lead to an increased likelihood of multi-region and multi-year ‘back-to-back’ droughts
towards the end of the 21st century (Section 4.2).

4.1 Time Evolution and Spatial Variability of 21st Century Droughts
The spatial patterns of future droughts over New Zealand are generally similar to those in the historic
period but they are likely to intensify over the 21st century in most regions. The changes increase
with higher emissions with the largest changes observed in the RCP8.5 scenario. The changes in the
underlying drivers of drought significantly alter the seasonal patterns. This is illustrated in Fig. 4-1
(left columns), showing intensification of mean summer drought conditions (top row) over all of New
Zealand other than a few isolated coastal regions of the South Island as distinguished by the Clim-
NZDI. An increase of 0.5 in the climate change signal in Fig. 4-1 corresponds to a change in drought
classification by two levels, for example from “very dry (larger than 1)” to onset of “drought (larger
than 1.5)”, depending on the baseline dryness. The changes in the drought patterns is already
evident in the mid-century (top, first column), which further intensifies towards the end of the
century (2090s; top second column). The preceding spring season (bottom, first column), on the
other hand, shows a decrease in drought conditions over parts of Waikato and Manawatu region of
the North Island and most of the South Island other than the Nelson-Marlborough region and inland
central South Island in the mid-century. This spatial pattern again further intensifies at the 2090s
period with enhanced drying mostly in the north and east of the North Island but is weaker than in
the summer season.

Projected changes in New Zealand drought risk: An updated assessment 20
Figure 4-1: The climate change signal for Clim-NZDI (first and second columns) and the SPI60 (third and
fourth columns) of the model ensemble mean for RCP8.5 emission scenario for the 2040s (first and third
columns) and 2090s (second and fourth columns) time slices based on NZ-CMIP5 climate project data. The
brown shades indicate increased drier conditions with respect to 1990s reference past period.

These changes in Clim-NZDI are directly driven by the changes in the precipitation patterns as
indicated by SPI60 (right columns). Other than some isolated pockets in the north-east and central
South Island, all regions in New Zealand experience drying in the summer season, due to decrease in
rainfall which becomes more evident in the 2090’s. Thus, the SPI60 is the main indicator of summer
droughts. The increase in PET further intensifies the drought contributing to increasing Clim-NZDI.
Even in the spring season, the increase in precipitation is partially unable to counteract the increase
in water demand (PET) due to increasing temperature. As a result, the spring drought risk does not
decrease, but may even increase in wetter regions (bottom panels).

The above example is to elucidate the changes in the drought patterns and their relationship with
the underlying drivers. Refer to Section 5 for a complete description of all drought indices and
emission scenarios.

The explicit changes in drought intensity (Clim-NZDI) and their underlying drivers (DIs) at two study
locations, Wairoro Stream near Kaikohe in the Far North (Northland) and in central Canterbury
(South Island), are presented below in more detail.

4.1.1 Wairoro Stream, Northland
The Wairoro Stream site (35.458 S, 173.827 E) lies in the midst of a drought prone region of the Far
North District. The reference past-, mid- and late-21st century time slices of Clim-NZDI derived using
all models are presented for the high-end RCP8.5 emission scenario. In Fig. 4-2 the droughts become
progressively more intense over the 21st century, with nearly all models (coloured lines) exceeding
the threshold for dry conditions (0.75) every year in the 2090s period, and the drought threshold

21 Projected changes in New Zealand drought risk: An updated assessment
You can also read