The influence of Experiential Marketing, Guerrilla Marketing and Buzz Marketing in the formation of Consumer Purchase Intention in the JD.ID ...
←
→
Page content transcription
If your browser does not render page correctly, please read the page content below
REVIEW OF INTERNATIONAL GEOGRAPHICAL EDUCATION
 ISSN: 2146-0353 ● © RIGEO ● 11(6), SPRING, 2021

www.rigeo.org Research Article

 The influence of Experiential Marketing,
 Guerrilla Marketing and Buzz Marketing in
 the formation of Consumer Purchase
 Intention in the JD.ID Marketplace
 Dinda Kayani Putri Bestari1 Mohd Haizam Saudi2
 Widyatama University, Bandung, Indonesia. Widyatama University, Bandung, Indonesia.
 dinda.kayani@widyatama.ac.id

 Obsatar Sinaga3 Antonius Setyadi4
 Padjadjaran University Mercu Buana University

Abstract
The development of technology is getting faster, it has an impact on the more convenience felt by the
community in various aspects of life. Today, the internet has become a necessity that cannot be
separated from everyday life. The internet provides many conveniences for people in various aspects of
life. The high level of internet use in Indonesia has made changes in people's shopping behavior or habits.
Shopping online has become the choice of most people because of the various conveniences offered.
One of the e-commerce that is developing quite rapidly to date is JD.ID. The JD.ID company experienced
a decline in ranking in Q1 in 2019. Then in Q1 2020 there was an improvement but the current position
could not recover as in 2017 in Q4. The increasing number of companies e-commerce, making the
competition increasingly fierce between each other. E- commerce companies need to make efforts to
remain competitive and survive. This study aims to see, measure and analyze how the influence that is
formed from the application of alternative marketing: Experiential marketing, Guerrilla Marketing, Buzz
Marketing on perceived quality that has an impact on consumer purchase intention in the JD.ID
marketplace. The results of this study showed that experiential marketing, guerilla marketing, and buzz
marketing did not have a significant effect on the formation of purchase intention, but did affect the
formation of perceived quality in the JD.ID marketplace.

Keywords
Experiential Marketing, Guerrilla Marketing, Buzz Marketing, Perceived Quality, Purchase Intention

To cite this article: Bestari, D, K, P.; Saudi, M, H.; Sinaga, O.; and Setyadi, A. (2021) The influence of Experiential
Marketing, Guerrilla Marketing and Buzz Marketing in the formation of Consumer Purchase Intention in the JD.ID
Marketplace. Review of International Geographical Education (RIGEO), 11(6), 382-397. doi: 10.48047/rigeo.11.06.47

Submitted: 07-12-2020 ● Revised: 15-02-2021 ● Accepted: 03-04-2021
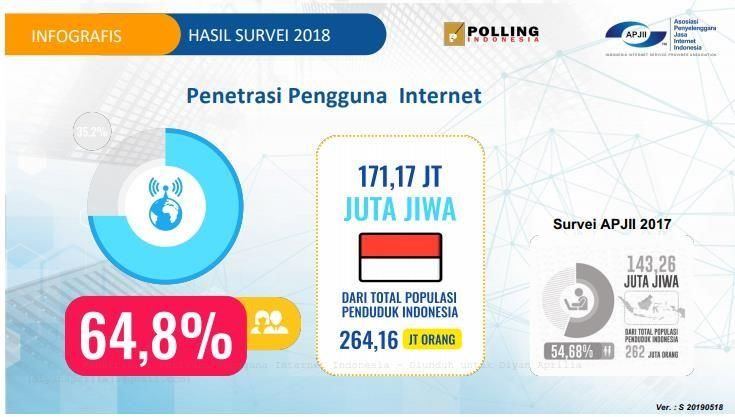
Bestari, D, K, P.; Saudi, M, H.; Sinaga, O.; and Setyadi, A. (2021) The influence of Experiential Marketing …

 Introduction
In the current era of the digital revolution, technological developments are accelerating. This has
an impact on the more convenience felt by the community in various aspects of life. Nowadays,
the internet has become a necessity that is difficult to separate from everyday life. The internet
provides many conveniences for people in various aspects of life. The internet is useful as a source
of information, communication, knowledge, and entertainment media. In addition, the internet is
also useful for making shopping transactions or what is commonly referred to as online shopping.
(www.kompasiana.com)

Figure 1. Internet User Penetration 2018 (APJII 2018 Survey)

Source: Shuang, Ximing, and Jie (2021)

 According to data obtained from APJII (Association of Indonesian Internet Service Providers), it
shows that more than half of Indonesia's population is currently connected to the internet. The
survey was conducted in 2018. The data in Figure 1 shows that as many as 171.17 million
Indonesians out of a total of 264.16 million Indonesians have used the internet. This indicates that
compared to 2017, the number of internet users in Indonesia has increased by 10.12%.
(www.apjii.or.id)
The increasing level of internet use in Indonesia has made changes in people's shopping behavior
or habits. Shopping online has become the choice of most people because of the various
conveniences offered. By shopping online, sellers and buyers do not need to meet face to face.
The product will be offered and displayed on a display with an image along with a description of
the product on a website, shopping application online, or social media. After the buyer chooses
the desired product, then makes a payment to the seller. The payment system provided by the
seller is available in several payment methods. Buyers can make transfers to bank accounts via
ATM, i-banking, m-banking, credit cards, joint accounts, through minimarkets, and COD (Cash on
Delivery) where buyers can pay directly for the ordered product when the item has been received
by the buyer. After the payment is confirmed by the seller and the buying and selling site, then
the seller will then send the goods to the buyer's address by using a freight forwarder.
(www.cermati.com)
With the development of business online in Indonesia, many business people are taking
advantage of the opportunity to become an service provider e-commerce. According to
Maulana, Susilo, and Susilo (2015), e-commerce is a process of selling and buying products
electronically with computers and the internet as intermediaries for business transactions. The
media that can be used inactivities e-commerce is the internet. Just like the development of the
internet, the growth rate of e-commerce in Indonesia is also among the most significant among
other countries in the world.

 383
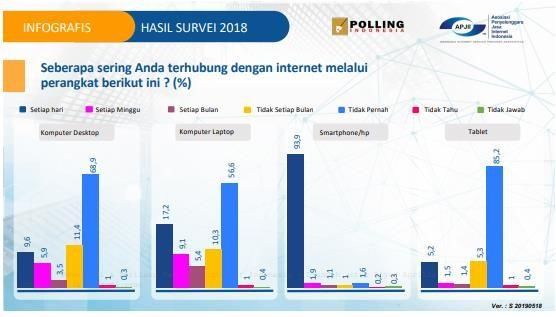
© RIGEO ● Review of International Geographical Education 11(6), Spring 2021

Figure 2. 10 Countries WithGrowth theE-Commerce-commerce Fastestin the World

Source: Cheba, Kiba-Janiak, Baraniecka, and Kołakowski (2021)

According to data released by a British research institute in 2018, Merchant Machine, from a list
of 10 countries withgrowth eThe fastest-growing e-commerce in the world, Indonesia leads the
ranks of these countries with 78% growth in 2018. The number of internet users in Indonesia, which
is more than 100 million users, is one of the forces driving the growth of e-commerce. The average
money spent by Indonesian people onshopping sites is online US$ 228 per person or around Rp.
3,190,000.00 per person. (www.katadata.co.id)
However, over time, the behavior online of Indonesian people has also changed, from computers
to mobile. This is due to people's increasingly dynamic mobility and the practicality ofdevices
mobile that can be used anywhere and anytime. So that the majority of Indonesian people
currently prefer to use mobile phones or smartphones for use in daily activities, including
forshopping online.

Figure 3. Devices Often Used by People to Connect to the Internet

Source: Shuang et al. (2021)

 According to survey data conducted by APJII (Association of Indonesian Internet Service
Providers), people are more often connected using devices mobile or smartphones every day.
The data in Figure 1.3 shows the level of frequent public access to the internet via smartphones is
93.9%. service providers E-commerce take advantage of this opportunity by developing aversion
mobile, making it easier for people to shop online. (www.apjii.or.id)
The development of stores online in Indonesia is very large. Various e-commerce have sprung up,
both from within the country, abroad, as well as the result of cooperation between foreign
companies and domestic companies. The ease of shopping and the variety of types of products
and services offered make e-commerce a place for shopping that is in demand by today's
society. This makes various e-commerce vying to attract the attention of potential buyers.

 384

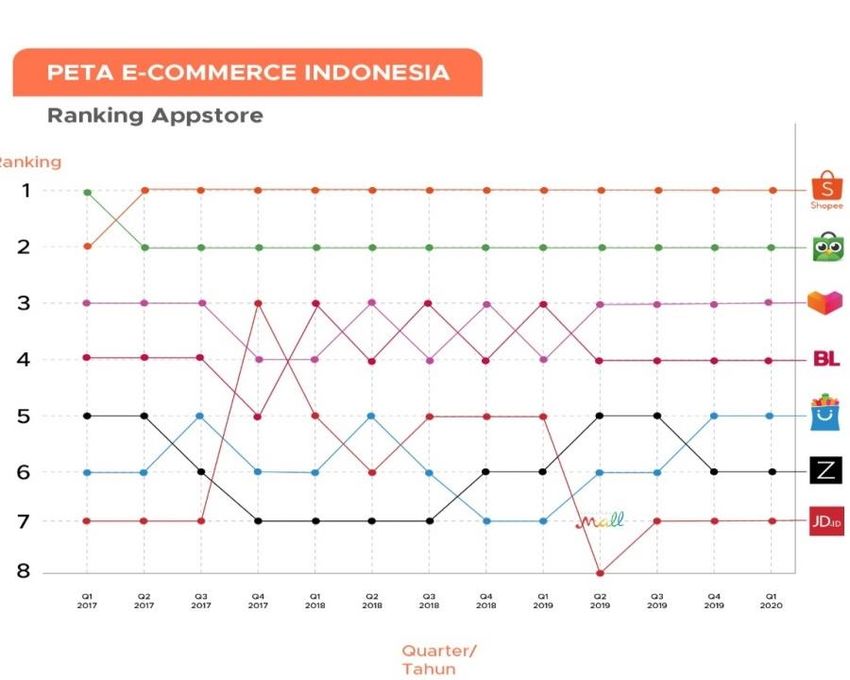
Bestari, D, K, P.; Saudi, M, H.; Sinaga, O.; and Setyadi, A. (2021) The influence of Experiential Marketing …

Figure 4. Competition Map E-Commerce in Indonesia

Source: Taneja (2021)

The competition map e-commerce in Indonesia shows significant growth. Based on the data in
the table above, in the fourth quarter of 2019, there were 10 e-commerce sites that had the
highest number of users in Indonesia. This shows that the majority of Indonesian people have
switched from shopping at offline stores to stores online.
One of the e-commerce that is developing quite rapidly to date is JD.ID. company e-commerce
JD. IDis an e-commerce which comes from e-commerce company in China named JD.com built
by a businessman named Richard Liu in July 1998. The company e-commerce JD.Com itself is one
of the e the-commerce largestin China and a competitor to Alibaba.com. JD.Com sells goods
directly shipped from its own warehouse (direct sales).

Figure 5. JD.ID Logo

Source: JD.id (2021)

In 2015, the e-commerce company JD.com partnered with Provident Capital based in Indonesia
by establishing JD.ID. Just like JD.com, the e-commerce company JD.ID is working on the
Indonesian market with a focus on maintaining the authenticity of the products available on the
platform. e-commerce JD.ID. The construction of warehouses in big cities such as Jakarta,
Surabaya, and Medan is also carried out in order to cut costs and delivery time of goods to
consumers. Initially, JD.ID focused on providing electronic products and gadgets hard-to-find,
such as the iPad Pro from Apple and the A2010 from Lenovo, which were just launched at the end
of 2015. Since the end of 2015, JD.ID has expanded its product offerings to include categories
such as shoes. and sportswear as well as beauty and health products. Currently JD.ID has 12
categories of product choices for sale which will continue to grow along with the development
of its business in Indonesia. The variety of product categories varies from mother and child
equipment, electronic devices, to luxury. The e-commerce company JD.ID provides delivery
services to 365 cities in Indonesia, with thousands of fleets ready to deliver goods to buyers. In
addition, JD.ID made many innovations such as opening the store offline first called JD.ID X with
the concept of no cashier thanks to the application of artificial intelligence.
The e-commerce company JD.ID operates two different business models. Most of the products
sold are direct products of the principal brand (business-to-business). And a small part are
products that come from merchants who cooperate with JD.ID (consumer-to-consumer). Trust is
a priority for JD.ID. By selling goods that are officially from the principal brand, it will certainly be

 385

© RIGEO ● Review of International Geographical Education 11(6), Spring 2021
easier for JD.ID to curate, and maintain the quality of goods on platform their. But on the other
hand, the business model makes the number of products owned by JD.ID tend to be less when
compared to other e-commerce sites such as Tokopedia and Shopee. In line with this mission,
since early 2017 JD.ID has launched a campaign with the tagline #DijaminOri. This is different from
other e-commerce which tends to feature discounted prices or reduced shipping costs.
According to data obtained by goodnewsfromindonesia.id, JD.ID experienced a decline in
ranking in Q1 in 2019. Then in Q1 2020 there was an improvement but the current position could
not recover as in 2017 in Q4.

Figure 6. Indonesian E-Commerce Map

Source: databoks.katadata.co.id

In addition, according to data obtained from databoks.katadata.co.id, in QIII in 2020 JD.ID also
experienced a decrease in the number of visitors. As shown in Figure 7. The graph shows that JD.ID
has decreased the number of visitors.

 386
Bestari, D, K, P.; Saudi, M, H.; Sinaga, O.; and Setyadi, A. (2021) The influence of Experiential Marketing …

Figure 7. Comparison of QII – QIII in 2020

Source: databoks.katadata.co.id

The increasing number of companies e-commerce, making the competition increasingly fierce
between each other. E- commerce companies need to make efforts to remain competitive and
survive. One of the efforts made is that companies need to use alternative marketing methods
and provide different experiences to consumers or users of e-commerce applications when
shopping using these e-commerce applications. The effort to create a consumer experience is
known as experiential marketing (Jatmiko & Andharini, 2012).
According to Shapiro (2021) in his book "Experiential Marketing: How to Get Consumers to Sense,
Feel, Think, Act, and Relate to Your Company and Brands" suggests a new understanding of
products and consumers, by adding an element of emotion in the concept. Marketing mix. This
concept arises because of dissatisfaction with the traditional marketing concept which views
consumers as rational beings in making product decisions, where spending on consumer needs is
only transactional and objective based on costs and benefits. This concept experiential marketing
states that in order to approach, get, and retain loyal consumers, producers through their
products need to present unique, positive, and impressive (experiences pleasureable
experiences) for consumers.
The experience desired by consumers in shopping online is of course a pleasant experience such
as, goods that come in accordance with consumer expectations, according to product
descriptions displayed on the application or website, easy to make purchases, responsive sellers
respond to buyer questions, customer service from e-commerce. - commerce is also responsive in
responding to complaints from users, and other positive experiences. From this positive and
pleasant shopping experience, it will generate consumer repurchase interest in the future. This is
in line with previous research (Nasir, Adil, & Dhamija, 2021) which states that experiential marketing
perceived by consumers has a significant effect on repurchase intention.
E-commerce JD.ID including one e-commerce is very concerned rules of thumb when shopping
online customers using the application. This is demonstrated by the mission of JD.ID, namely 'make
the joy happen' or bring happiness to all customers in Indonesia by providing reliable, fast, and
safe services to choose a variety of quality products at competitive prices. This mission is realized
through various programs offered to create a positive experience for users of the JD.ID
application, including Hooray Payday, Sharebuy, Super Employee Day, Instagram Daily App
Deals, and Office and Home Happy Hour. (jd.id)
However, according to data obtained from Bisnis.tempo.com, in 2019 JD.ID became the e-
commerce with the most complaints according to a report by the Indonesian Consumers
Foundation (YLKI). In its annual report, YLKI noted that of all reports of customer complaints e-
commerce in 2019, the most cases were targeting JD.ID and Bukalapak. The majority of customers
have complained about the ordered goods are not received, the ordered goods not in
accordance with the specifications of the application, and refund(refund).The percentage of the

 387
© RIGEO ● Review of International Geographical Education 11(6), Spring 2021
number of complaints or complaints is presented in the following table.

Table 1.
Percentage of Number of Complaints E-Commerce in Indonesia According to YLKI Data

 No Name E-Commerce Percentage of Complaints

 1 JD.ID 17.6%

 2 Bukalapak 17.6%

 3 Shopee 14.7%

 4 Tokopedia 8.8%

 5 World Prices 5.8%

 6 OYO 5.8%

 7 Tickets .com 5.8%

 8 Booking.com 2.9%

 9 OLX 2.9%

 10 Lazada 2.9%

 11 Nusatrip 2.9%

 12 Qoo10 2.9%

 13 Landor 2.9%

 14 Shopintar 2.9%

Source: Bisnis.tempo.com

In Table 1 it can be seen that JD.ID became one of the e-commerce that received the most
complaints from users in 2019. JD.ID and Bukalapak became the top rankers with 17.6% each for
the number of complaints summarized by YLKI. This shows that JD.ID is still lacking in providing good
experiential marketing to users.
In Figure 8, there is one complaint submitted by JD.ID users in a reader's letter on detik.com. The
reader's letter contains complaints from JD.ID users who made purchases of goods on February 7,
2019, on February 23, 2019 the JD.ID system stated that the order status was complete, which
means that the order has been received by the buyer. In fact, the buyer has not received the
goods purchased at JD.ID. The buyer tried to contact the call center JD.IDon February 25, 2019,
but until March 19, 2019, there was no clarity on the status of the order. This caused disappointment
from the users of the JD.ID application because they had experiences badwhen using the JD.ID
application.

 388
Bestari, D, K, P.; Saudi, M, H.; Sinaga, O.; and Setyadi, A. (2021) The influence of Experiential Marketing …

Figure 8. JD.ID User Complaints

Source: detik.com (2020)

 In addition to experiential marketing, other marketing alternatives such as buzz marketing,
guerrilla marketing are an effective alternative for companies. Guerrilla marketing is expected to
emerge with unconventional and spectacular activities. In that way, guerrilla marketing can be
more effective and cheaper when compared to conventional marketing campaigns (Baltes &
Leibing, 2008). Similar to guerrilla marketing, the buzz marketing method is an alternative
promotion that is very often used. This is in line with the research results of Yogaswara, Lestari, and
Imran (2016), in his research, it was found that the buzz marketing strategy used succeeded in
making rapid developments in brand popularity. Based on the presentation of the theory, data
and research results presented, the researchers intend to see, measure and analyze how the
effects formed from the application of alternative marketing: Experiential marketing, Guerrillia
Marketing, Buzz Marketing on perceived quality have an impact on consumer purchase intention
in the JD.ID marketplace spread over several areas of West Java.

 Review Literature
Experiential Marketing

According to Quach, Shao, Ross, and Thaichon (2021) there are five strategies in experiential
marketing which are commonly called Strategic Experiential Models (SEMs). SEMs are experiential
strategy modules that managers can use to create different types of experiences for consumers.
This module covers sensory experience (sense), affective experience (feel), cognitive experience
(think), behavioral experience, lifestyle (act), and social identity experience (relate).

Guerrilla Marketing, Guerrilla Marketing

is a promotional strategy that uses unconventional low-budget marketing methods to create
something unique and thought-provoking to generate customer interest and consequently
create a memorable brand experience)? Based on the explanation of Serazio (2021), there are
three categories of the most important guerilla marketing instruments, namely infection guerilla
marketing (infectious guerilla marketing), surprise guerilla marketing (surprise guerrilla marketing)
and ambush marketing (ambush marketing).

 389
© RIGEO ● Review of International Geographical Education 11(6), Spring 2021
Buzz Marketing Buzz marketing

Buzz marketing or word of-mouth marketing, emphasizes consumers seeking product information.
Recommendations by friends, family members, or acquaintances provide greater trust than
advertising. Buzz is more powerful than the words spoken by a spokesperson or endorser. Support
from word-of-mouth may be consumers who love the brand and then tell others, consumers who
like a brand, and is being sponsored by the company to pass on to others, or by the employees
of the company or agency that talk about the brand.
 Buzz Marketing consists of three stages: inoculation, incubation, and infection. The inoculation
stage corresponds to the product introduced. During incubation, several innovators or
trendsetters try the product. In the third stage i.e., the infection stage, widespread use of the
product occurs. Only a few companies are successful in implementing buzz marketing in the
inoculation stage, or product introduction. In most cases, buzz marketing does not work well at
this stage, unless the company hires brand agents or brand ambassadors (Clow, 2014).

Perceived Quality

Perceived quality is defined as the consumer's evaluation of the whole brand, both for its intrinsic
and extrinsic elements, the intrinsic elements in the form of performance and durability while the
extrinsic elements are in the form of the brand name itself (Asshidin, Abidin, & Borhan, 2016). In
their work, Trimarjoko et al. (2019), conveyed that in determining the dimensions of product quality,
it could be through eight dimensions, namely as follows:

1) Performance, this relates to the functional aspects of an item and is the main characteristic that
customers consider in buying goods. that.
2) Features, namely performance aspects that are useful for adding basic functions, related to
product choices and development.
3) Reliability, matters relating to the probability or possibility of an item successfully carrying out its
function every time it is used within a certain period of time and under certain conditions.
4) Conformance, this relates to the level of conformity to predetermined specifications based on
customer desires.
5) Durability, which is a reflection of economic life in the form of a measure of durability or service
life of goods.
6) Serviceability, namely characteristics related to speed, competence, convenience, and
accuracy in providing services for repairing goods.
7) Asthetics, is a subjective characteristic regarding aesthetic values related to personal
considerations and reflections of individual preferences.
8) Perceived quality, consumers do not always have complete information about product
attributes. However, consumers usually have information about the product indirectly

Consumer Purchase intention

Kim and Moon (2021) state that purchase intention is consumer behavior that appears in response
to objects that indicate a person's desire to make a purchase. Meanwhile, the notion of purchase
intention according to Schiffman and Kanuk (2000) is: A model of a person's attitude towards the
object of goods that is very suitable in measuring attitudes towards certain product groups,
services, or brands.
In the stages of consumer purchase intention there is a concept that is the concept of AIDA are:

1. Attention(attention)An early stage in evaluating a product or service that takes potential
customers, which in this phase of potential customers learn the value of the products / services
offered.
2. Interest (interestt) Prospective customer interest arises after getting more detailed information
observing the product / service.
3. Desire(desire)Potential customers are thinking and discussions that led to the desire and the
desire to buy the products / services offered. In this stage, prospective customers must advance
and level from just being interested in the product. This stage is characterized by a strong desire
from potential customers to buy and try the product.
4. Action (action) Make a passive decision on the offer. At this stage, prospective customers who

 390
Bestari, D, K, P.; Saudi, M, H.; Sinaga, O.; and Setyadi, A. (2021) The influence of Experiential Marketing …

have visited the company will have a level of stability to buy or use a product offered. (Kim &
Moon, 2021).

This study uses independent variables, namely Experiential Marketing, Guerrilla Marketing and Buzz
Marketing with the dependent variable, namely Perceived Quality, Consumer Purchase intention,
shown by the conceptual framework presented in the image below:

Figure 9. Conceptual Framework

 Methodology
These Research used tools statistics Partial Least-Square Equation Modeling (PLS)which is capable
of explaining the relationship between several variables (including latent variables) and capable
of performing factor analysis, regression analysis, and path analysis in one test. What is meant by
latent variable is that the type of variable cannot be measured directly, but dimensions must be
constructed or indicators compiled. PLS is an analysis of structural equations lined up with
variances that can simultaneously test the measurement model as well as test the structural model
(Prayitno, Ashari, & Rukmi, 2021). The sample in this study was 55 people with more than 3
marketplace access frequencies in the last six months, and had visited the web. JD.ID
Marketplace. with domicile spread in several areas of West Java. The technique of distributing
questionnaires uses snowball sampling.

 Result and Discussion
The research instrument and then proceeds with the results of processing and analyzing data with
PLS Algorithm and Bootstrapping (Model) using Structural Smart PLS 3.0.
Data processing techniques using the SEM method based on Partial Least Square (PLS) require 2
stages to assess the Fit Model of a research model: the outer and inner model (Lago, Silva, Melo,
& de Morais, 2021). The following is the Measurement Model test:

 391
© RIGEO ● Review of International Geographical Education 11(6), Spring 2021

Figure 10. Measurement Model Estimation Results 1

Source: Data Processing (2021)

 Convergent validity test is done by looking at the loading factor value of each indicator to the
construct. In this test, exploratory research, the limit of the loading factor used is 0.6. According to
Lago et al. (2021) that when an indicator is declared invalid, the indicator must be removed from
the model. Because there are indicators that have avalue loading factor below 0.6, the invalid
indicator must be removed.

Figure 11. Measurement Estimation Results 2

Source: Data Processing (2021)

After the invalid indicators are removed, thevalues loading factor for each variable are presented
in the image above. Furthermore, the discriminant validity test was carried out. Discriminant
validity is carried out to ensure that each concept of each latent variable is different from other
variables. The results oftesting are discriminant validity obtained as follows:

 392
Bestari, D, K, P.; Saudi, M, H.; Sinaga, O.; and Setyadi, A. (2021) The influence of Experiential Marketing …

Figure 12. Loading Factor Value

Source: Data Processing (2021)

At this stage, there is no construct value that is smaller than the other constructs so that it fulfills the
requirements. Currently all indicators have a value loading factor greater than the loading factor
for the other constructs so that the model has met the required discriminant validity requirements.
Furthermore, construct reliability can be assessed from Cronbach's Alpha value, Composite
Reliability value and Average Variance Extracted (AVE) value for each construct. The construct
high reliability if the Cronbach's Alpha value exceeds 0.7, for this test, found that the composite
reliability value exceeds 0.70 and the AVE is above 0.50.

Figure 13. Composite Reliability, AVE and Cronbach's Alpha Values

Source: Data Processing (2021)

In Figure 13, it can be seen that there is a Cronbach's alpha value < 0.7, avalue composite
reliability > 0.7 and there is an AVE value with a construct < 0.5 this can be interpreted after testing
the outer model, the next step is testing the Structural Model (Inner Model). Model). The PLS
Structural Model can be assessed by looking at the R Square value of each endogenous variable
as the predictive power of the structural model. The R Square interpretation is the same as the R
Square interpretation in ordinary regression analysis. R Square value 0.75; 0.50 and 0.25 can be
concluded that the model is strong, moderate and weak (Lago et al., 2021).

Structural Model Testing (Inner Model)

R square

R Square in ordinary regression analysis. R Square value 0.75; 0.50 and 0.25 can be concluded that
the model is strong, moderate and weak (Lago et al., 2021). The following is the R Square value of
the research variable:

Figure 14. R Square
Source: Data Processing (2021)

 393
© RIGEO ● Review of International Geographical Education 11(6), Spring 2021
Based on the picture above, several conclusions are obtained, the R Square value of the
Perceived Quality variable is 0.153 or 15.3%, while R square of thevariable purchase intention is
0.395 or 39.5%,

Effect Size (f Square / f2)

In PLS analysis, the F square value (f2) indicates the magnitude of the impact for each predictor
variable on endogenous variables. According to Schmidt and Bohannon (1988) in (Lago et al.,
2021), the F square value grouped into 3 level, categories of small effect (f2 = 0.02), medium effect
(f2 = 0.15) and large effect (f2 = 0.35 ). F Square result for exogenous to endogenous variable
presented in figure 15.

Figure 15. F square

Source: Data Processing (2021)

The results of the f square calculation in figure 15 obtained the following results:

The f-square value of the variable perceived quality on purchase intention is 0.629 while the F-
square value of the variable Guerilla Marketing on perceived quality is 0.038. then the f square
value of the variable experiential Marketing on perceived quality is 0.001. Furthermore, the value
of the variable square f Buzz Marketing on the perceived quality is equal to 0.042 and the value
of the variable f square buzz marketing to purchase intention is equal to 0.012. This shows that only
perceived quality has a major influence on purchase intention.

Q2 Predictive relevance

In PLS analysis, Q2 showing the predictive power of the research model. The value Q2 model of
0.02 indicates the model has weak predictive relevance, the value Q2 model of 0.15 indicates
the model has moderate predictive relevance and the value Q2 model of 0.35 indicates the
model has strong predictive relevance. The formula used to calculate Q2 is as follows:

Formula Q2:

Q2 = 1 – (1-R21) (1- R22) ……. (R2k)
Where:
k = number of endogenous variables
R211st =endogenous variable
R222nd =endogenous variable
R2kkth =endogenous variable

Q2 = 1 – (1-0.153) (1-0.395)
Q2 = 1 – 0.512
Q2 = 0.488

The result, the value model of this research have 0.488 > 0.35 . Its mean the model has predictive
relevance strong.

d) Test the goodness of fit (Gof)
Test goodness of fit for PLS model , can be seen with the following formula:
 = √̅̅̅̅̅̅̅̅̅̅̅̅̅
 × 2

 394
Bestari, D, K, P.; Saudi, M, H.; Sinaga, O.; and Setyadi, A. (2021) The influence of Experiential Marketing …

 = √̅̅̅̅̅̅̅̅̅̅̅̅̅̅̅̅̅̅̅
 0,555 × 0,274
 = √0,152
 = 0,389

According to Mulé et al. (2020) the provisions are; GoF is said to be small if 0.1, GoF is said to be
medium if the value is 0.25, and GoF is said to be large if the value is 0.38. In this research model,
obtaining a GoF value of 0.389, it can be said that the model has a large GoF and is declared to
have met the criteria goodness of fit, so it is suitable to be used to test the research hypothesis.

Significance test

The hypothesis in this study can be seen in the following figure:

Figure 16. Results of Estimation Model

Source: Data Processing (2021)

Based on the above image, obtained some results, namely, p-value of the variable value
perceived quality against the purchase intention is 0, 000 with a T statistic of 7,340 and the original
sample is positive.

The Hypothesis Testing

The results of the PLS analysis are then used to test the research hypotheses, the following is a
summary of the results of testing the research hypotheses based on the results of the PLS analysis.

Tabel 3.
Hypothesis Testing

 No Hypothesis T Statistic P Value Conclusion

 Buzz Marketing has a
 1 significant effect on 1,415 0,158 H1 rejected
 perceived quality

 Buzz Marketing has a
 2 significant effect on 0.616 0,538 H2 rejected
 purchase intention

 395
© RIGEO ● Review of International Geographical Education 11(6), Spring 2021

 Experiential Marketing has a
 3 significant effect on 0,220 0,826 H3 rejected
 perceived quality

 Guerilla Marketing has a
 4 significant effect on 1,403 0,161 H4 rejected
 perceived quality

 Perceived quality has a
 5 significant effect on 7,340 0,000 H5 accepted
 purchase intention

Source: Data Processing (2021)

From the results of the research conducted, it was found that the perceived quality had a
significant influence on purchase intention with an effect of 66.3% (see Figure 16) with
the indicator having the highest influence, namely Aesthetics with a statistical T value of 15,503.

 Conclusions & Suggestions
It can be concluded that the perceived quality of the majority of respondents is most influenced
by the Aesthetics indicator. Subjective characteristics regarding aesthetic values related to
personal considerations and reflections of individual preferences are the most influential points in
the formation of perceived quality in the minds of consumers. Looking at the results of this study,
JD.ID should focus on variables that are currently still considered weak, namely the act indicator
on experiential marketing, serviceability on perceived quality variable, infection indicator on
guerilla marketing, incubation indicator on buzz marketing and desire on purchase intention
variable. Attention to several recommendation variables aims to improve the performance of
JD.ID

 References:
Asshidin, N. H. N., Abidin, N., & Borhan, H. B. (2016). Perceived quality and emotional value that
 influence consumer's purchase intention towards American and local products. Procedia
 Economics and Finance, 35, 639-643. doi:https://doi.org/10.1016/S2212-5671(16)00078-2
Baltes, G., & Leibing, I. (2008). Guerrilla marketing for information services? New Library World, 46-
 55. doi:https://doi.org/10.1108/03074800810845994
Cheba, K., Kiba-Janiak, M., Baraniecka, A., & Kołakowski, T. (2021). Impact of External Factors on
 E-commerce Market in Cities and Its Implications on Environment. Sustainable Cities and
 Society, 103032. doi:https://doi.org/10.1016/j.scs.2021.103032
Clow, K. E. (2014). Integrated advertising, promotion, and marketing communications. Retrieved
 from
 https://scu.esploro.exlibrisgroup.com/discovery/fulldisplay/alma991000668630402368/61S
 CU_INST:ResearchRepository
Jatmiko, R. D., & Andharini, S. N. (2012). Analisis experiential marketing dan loyalitas pelanggan
 jasa wisata (Studi pada Taman Rekreasi Sengkaling Malang). Jurnal Manajemen dan
 Kewirausahaan, 14(2), 128-137. doi:https://doi.org/10.9744/jmk.14.2.128-137
Kim, K. H., & Moon, H. (2021). Innovative digital marketing management in B2B markets: Elsevier.
Lago, B. C., Silva, C. A., Melo, L. C. A., & de Morais, E. G. (2021). Predicting biochar cation
 exchange capacity using Fourier transform infrared spectroscopy combined with partial

 396
Bestari, D, K, P.; Saudi, M, H.; Sinaga, O.; and Setyadi, A. (2021) The influence of Experiential Marketing …

 least square regression. Science of The Total Environment, 794, 148762.
 doi:https://doi.org/10.1016/j.scitotenv.2021.148762
Maulana, S. M., Susilo, H., & Susilo, H. (2015). Implementasi e-commerce sebagai media penjualan
 online (studi kasus pada toko pastbrik kota malang). Jurnal Administrasi Bisnis, 29(1), 1-9.
 Retrieved from
 http://administrasibisnis.studentjournal.ub.ac.id/index.php/jab/article/view/1165
Mulé, S., Galletto Pregliasco, A., Tenenhaus, A., Kharrat, R., Amaddeo, G., Baranes, L., . . . Djabbari,
 M. (2020). Multiphase liver MRI for identifying the macrotrabecular-massive subtype of
 hepatocellular carcinoma. Radiology, 295(3), 562-571. Retrieved from
 https://pubs.rsna.org/doi/full/10.1148/radiol.2020192230
Nasir, M., Adil, M., & Dhamija, A. (2021). The synergetic effect of after sales service, customer
 satisfaction, loyalty and repurchase intention on word of mouth. International Journal of
 Quality and Service Sciences. Retrieved from
 https://www.emerald.com/insight/content/doi/10.1108/IJQSS-01-2021-0015/full/html
Prayitno, G., Ashari, M. I., & Rukmi, W. I. (2021). Structural Equation Model with Partial Least Square
 (SEM-PLS) of Place Dependence with Land Used Change. Journal of International Studies,
 14(1), 153-171. doi:http://dx.doi.org/10.14254/2071-8330.2021/14-1/11
Quach, S., Shao, W., Ross, M., & Thaichon, P. (2021). Customer participation in firm-initiated
 activities via social media: Understanding the role of experiential value. Australasian
 Marketing Journal, 29(2), 132-141. doi:https://doi.org/10.1016%2Fj.ausmj.2020.05.006
Schiffman, L. G., & Kanuk, L. L. (2000). Consumer behavior: New Jersey: Prentice Hall.
Schmidt, S. R., & Bohannon, J. N. (1988). In defense of the flashbulb-memory hypothesis: A
 comment on McCloskey, Wible, and Cohen (1988). Retrieved from
 https://psycnet.apa.org/record/1989-00359-001
Serazio, M. (2021). How news went guerrilla marketing: a history, logic, and critique of brand
 journalism. Media, Culture & Society, 43(1), 117-132.
 doi:https://doi.org/10.1177%2F0163443720939489
Shapiro, G. (2021). Who shall be lord of the earth?” Nietzsche, Schmitt, and thinking “beyond the
 line. Philosophy & Social Criticism, 622. doi:https://doi.org/10.1177%2F01914537211042622
Shuang, L., Ximing, C., & Jie, S. (2021). Research on the degree of coupling of the Internet
 development level and agricultural——Ecological efficiency based on 2009–2018 data
 from 13 major grain-producing areas in China. Plos one, 16(7), e0254078.
 doi:https://doi.org/10.1371/journal.pone.0254078
Taneja, B. (2021). The Digital Edge for M-Commerce to Replace E-Commerce Emerging
 Challenges, Solutions, and Best Practices for Digital Enterprise Transformation (pp. 299-318):
 IGI Global. doi:10.4018/978-1-7998-8587-0.ch016
Trimarjoko, A., Saroso, D., Purba, H., Hasibuan, S., Jaqin, C., & Aisyah, S. (2019). Integration of
 nominal group technique, Shainin system and DMAIC methods to reduce defective
 products: A case study of tire manufacturing industry in Indonesia. Management Science
 Letters, 9(13), 2421-2432. doi:http://dx.doi.org/10.5267/j.msl.2019.7.013
Yogaswara, F. S., Lestari, M. T., & Imran, A. I. (2016). Analisis Strategi Buzz Marketing Warunk
 Upnormal Bandung Melalui Twitter. eProceedings of Management, 3(2). Retrieved from
 https://openlibrarypublications.telkomuniversity.ac.id/index.php/management/article/vi
 ew/2308/0

 397
You can also read