THE OPPORTUNITIES AND CHALLENGES FOR FEMALE LABOR FORCE PARTICIPATION IN MOROCCO - Yuko Morikawa
←
→
Page content transcription
If your browser does not render page correctly, please read the page content below

GLOBAL ECONOMY & DEVELOPMENT
                  WORKING PAPER 86 | JULY 2015

THE OPPORTUNITIES AND
CHALLENGES FOR FEMALE LABOR
FORCE PARTICIPATION IN MOROCCO

Yuko Morikawa

Yuko Morikawa, Japan International Cooperation
                                                            Agency (JICA)

Acknowledgements:
I would like to express my appreciation to the Ministry of Economy and Finance of Morocco, the Brookings
Institution and the Japan International Cooperation Agency (JICA) for their support in writing this paper. I would
also like to thank Hafez Ghanem, Mayyada Abu Jaber, and Marc Shifbauer for providing valuable advice and
comments to earlier drafts of the paper. I would also like to extend my appreciation to Akihiko Koenuma, Shinichi
Yamanaka and Misaki Kimura for their invaluable assistance. The views expressed in the paper and any errors
are those of the author and represent neither the official position of JICA, nor the Brookings Institution.

Brookings recognizes that the value it provides is in its absolute commitment to quality, independence and im-
pact. Activities supported by its donors reflect this commitment and the analysis and recommendations are not
determined or influenced by any donation.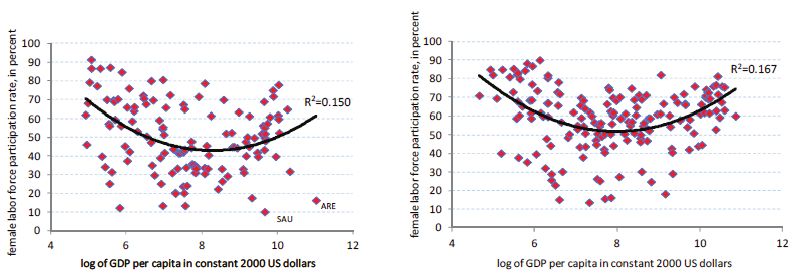
CONTENTS

Introduction: Economic development and female labor force participation (FLFP). .  .  .  .  .  .  .  .  .  .  .  .  . 1

Social institutions and FLFP . .  .  .  .  .  .  .  .  .  .  .  .  .  .  .  .  .  .  .  .  .  .  .  .  .  .  .  .  .  .  .  .  .  .  .  .  .  .  .  .  .  .  .  .  .  .  .  .  .  .  .  .  .  .  .  .  .  .  .  . 5

Supply-side factors and FLFP. .  .  .  .  .  .  .  .  .  .  .  .  .  .  .  .  .  .  .  .  .  .  .  .  .  .  .  .  .  .  .  .  .  .  .  .  .  .  .  .  .  .  .  .  .  .  .  .  .  .  .  .  .  .  .  .  .  .  . 6

Demand-side factors and FLFP. .  .  .  .  .  .  .  .  .  .  .  .  .  .  .  .  .  .  .  .  .  .  .  .  .  .  .  .  .  .  .  .  .  .  .  .  .  .  .  .  .  .  .  .  .  .  .  .  .  .  .  .  .  .  .  . 24

Conclusion. .  .  .  .  .  .  .  .  .  .  .  .  .  .  .  .  .  .  .  .  .  .  .  .  .  .  .  .  .  .  .  .  .  .  .  .  .  .  .  .  .  .  .  .  .  .  .  .  .  .  .  .  .  .  .  .  .  .  .  .  .  .  .  .  .  .  .  .  .  .  .  .  .  . 39

Bibliography. .  .  .  .  .  .  .  .  .  .  .  .  .  .  .  .  .  .  .  .  .  .  .  .  .  .  .  .  .  .  .  .  .  .  .  .  .  .  .  .  .  .  .  .  .  .  .  .  .  .  .  .  .  .  .  .  .  .  .  .  .  .  .  .  .  .  .  .  .  .  .  . 40

Endnotes. .  .  .  .  .  .  .  .  .  .  .  .  .  .  .  .  .  .  .  .  .  .  .  .  .  .  .  .  .  .  .  .  .  .  .  .  .  .  .  .  .  .  .  .  .  .  .  .  .  .  .  .  .  .  .  .  .  .  .  .  .  .  .  .  .  .  .  .  .  .  .  .  .  .  . 43

LIST OF FIGURES

Figure 1: Female Labor Force Participation Rate, 2002 and 2012 (Percent). .  .  .  .  .  .  .  .  .  .  .  .  .  .  .  .  .  .  . 2

Figure 2: Comparison of Female Labor Force Participation Across Countries, 1980 and 2010. .  .  . 3

Figure 3: Female Labor Force Participation Across Countries, 2010 . .  .  .  .  .  .  .  .  .  .  .  .  .  .  .  .  .  .  .  .  .  .  .  .  . 4

Figure 4: Proportion of inactive, Unemployed and Employed Population. .  .  .  .  .  .  .  .  .  .  .  .  .  .  .  .  .  .  .  .  .  . 7

Figure 5: Proportion of Inactive, Unemployed and Employed Population Among Youth
and Older Age Males. .  .  .  .  .  .  .  .  .  .  .  .  .  .  .  .  .  .  .  .  .  .  .  .  .  .  .  .  .  .  .  .  .  .  .  .  .  .  .  .  .  .  .  .  .  .  .  .  .  .  .  .  .  .  .  .  .  .  .  .  .  .  .  .  .  . 8

Figure 6: Proportion of Inactive, Unemployed and Employed Population Among Youth
and Older Age Females. .  .  .  .  .  .  .  .  .  .  .  .  .  .  .  .  .  .  .  .  .  .  .  .  .  .  .  .  .  .  .  .  .  .  .  .  .  .  .  .  .  .  .  .  .  .  .  .  .  .  .  .  .  .  .  .  .  .  .  .  .  .  .  . 8

Figure 7: Net Enrollment Rate, Primary Education (Percent). .  .  .  .  .  .  .  .  .  .  .  .  .  .  .  .  .  .  .  .  .  .  .  .  .  .  .  .  .  .  .  . 9

Figure 8: Net Enrollment Rate, Lower Secondary Education (Percent). .  .  .  .  .  .  .  .  .  .  .  .  .  .  .  .  .  .  .  .  .  .  . 9

Figure 9: Labor Force Participation Status Among Youth (aged 15 to 29)
Who Are Not in School . .  .  .  .  .  .  .  .  .  .  .  .  .  .  .  .  .  .  .  .  .  .  .  .  .  .  .  .  .  .  .  .  .  .  .  .  .  .  .  .  .  .  .  .  .  .  .  .  .  .  .  .  .  .  .  .  .  .  .  .  .  .  .  . 11

Figure 10: Share of Youth Who Are Not in School and Who Are Out of the Labor Force. .  .  .  .  .  .  .  . 11

Figure 11: Type of Job in Morocco by Area . .  .  .  .  .  .  .  .  .  .  .  .  .  .  .  .  .  .  .  .  .  .  .  .  .  .  .  .  .  .  .  .  .  .  .  .  .  .  .  .  .  .  .  .  .  .  . 12

Figure 12: Unemployment Rate in Morocco by Area. .  .  .  .  .  .  .  .  .  .  .  .  .  .  .  .  .  .  .  .  .  .  .  .  .  .  .  .  .  .  .  .  .  .  .  .  .  .  . 12

Figure 13: Reason for Not Expecting/Willing to Work Among Young Urban Females
(aged 15 to 29) in Morocco. .  .  .  .  .  .  .  .  .  .  .  .  .  .  .  .  .  .  .  .  .  .  .  .  .  .  .  .  .  .  .  .  .  .  .  .  .  .  .  .  .  .  .  .  .  .  .  .  .  .  .  .  .  .  .  .  .  .  .  .  . 13

Figure 14: Comparison of Reasons for Not Expecting/Willing to Work Among Urban
Females by Education Level. .  .  .  .  .  .  .  .  .  .  .  .  .  .  .  .  .  .  .  .  .  .  .  .  .  .  .  .  .  .  .  .  .  .  .  .  .  .  .  .  .  .  .  .  .  .  .  .  .  .  .  .  .  .  .  .  .  .  . 14
Figure 15: Reason Given by Moroccans Not Searching for Work. .  .  .  .  .  .  .  .  .  .  .  .  .  .  .  .  .  .  .  .  .  .  .  .  .  .  . 15

Figure 16: Reason Given by Young Females for Not Searching for a Job in Urban Morocco. .  .  .  . 16

Figure 17: Reason for Not Searching for a Job Among All Urban Females. .  .  .  .  .  .  .  .  .  .  .  .  .  .  .  .  .  .  .  . 16

Figure 18: Unemployment Rates in Morocco by Education Level (Percent) . .  .  .  .  .  .  .  .  .  .  .  .  .  .  .  .  .  .  .  .  . 17

Figure 19: Job Preference Among Urban Youth in Morocco. .  .  .  .  .  .  .  .  .  .  .  .  .  .  .  .  .  .  .  .  .  .  .  .  .  .  .  .  .  .  .  . 18

Figure 20: Reason for Preference for Salaried Employment Among Urban Youth in Morocco . .  .  . 18

Figure 21: When Jobs Are Scarce, Men Should Have More Right to a Job Than Women. .  .  .  .  .  .  .  . 19

Figure 22: Having a Job Is the Best Way for a Woman to Be an Independent Person. .  .  .  .  .  .  .  .  . 20

Figure 23: When a Mother Works for Pay, the Children Suffer. .  .  .  .  .  .  .  .  .  .  .  .  .  .  .  .  .  .  .  .  .  .  .  .  .  .  .  .  .  . 21

Figure 24: Being a Housewife Is Just as Fulling as Working for Pay. .  .  .  .  .  .  .  .  .  .  .  .  .  .  .  .  .  .  .  .  .  .  .  .  . 21

Figure 25: University Education is More Important for a Boy than for a Girl. .  .  .  .  .  .  .  .  .  .  .  .  .  .  .  .  . 22

Figure 26: On the Whole, Men Make Better Business Executives than Women Do. .  .  .  .  .  .  .  .  .  .  .  . 22

Figure 27: Sector and Profession, Urban Males. .  .  .  .  .  .  .  .  .  .  .  .  .  .  .  .  .  .  .  .  .  .  .  .  .  .  .  .  .  .  .  .  .  .  .  .  .  .  .  .  .  . 25

Figure 28: Sector and Profession, Urban Females. .  .  .  .  .  .  .  .  .  .  .  .  .  .  .  .  .  .  .  .  .  .  .  .  .  .  .  .  .  .  .  .  .  .  .  .  .  .  . 25

Figure 29: Growth Decomposition into Productivity, Employment and
Working Age Population (2006–2010). .  .  .  .  .  .  .  .  .  .  .  .  .  .  .  .  .  .  .  .  .  .  .  .  .  .  .  .  .  .  .  .  .  .  .  .  .  .  .  .  .  .  .  .  .  .  .  .  .  . 28

Figure 30: Proportion of Permanent Full-Time Workers that Are Female in
Manufacturing Firms in Morocco (Percent) . .  .  .  .  .  .  .  .  .  .  .  .  .  .  .  .  .  .  .  .  .  .  .  .  .  .  .  .  .  .  .  .  .  .  .  .  .  .  .  .  .  .  .  .  . 29

Figure 31: Size of Turnover and Export. .  .  .  .  .  .  .  .  .  .  .  .  .  .  .  .  .  .  .  .  .  .  .  .  .  .  .  .  .  .  .  .  .  .  .  .  .  .  .  .  .  .  .  .  .  .  .  .  . 34

Figure 32: Female Employee Ratio. .  .  .  .  .  .  .  .  .  .  .  .  .  .  .  .  .  .  .  .  .  .  .  .  .  .  .  .  .  .  .  .  .  .  .  .  .  .  .  .  .  .  .  .  .  .  .  .  .  .  .  .  . 35

Figure 33: Productivity and Cost per Employee . .  .  .  .  .  .  .  .  .  .  .  .  .  .  .  .  .  .  .  .  .  .  .  .  .  .  .  .  .  .  .  .  .  .  .  .  .  .  .  .  . 35

Figure 34: Ratio of Exporting Companies (Size of Turnover). .  .  .  .  .  .  .  .  .  .  .  .  .  .  .  .  .  .  .  .  .  .  .  .  .  .  .  .  .  . 36

Figure 35: Business Size: Average Turnover per Company. .  .  .  .  .  .  .  .  .  .  .  .  .  .  .  .  .  .  .  .  .  .  .  .  .  .  .  .  .  .  .  . 37

Figure 36: Average Number of Employees per Company . .  .  .  .  .  .  .  .  .  .  .  .  .  .  .  .  .  .  .  .  .  .  .  .  .  .  .  .  .  .  .  .  . 37

Figure 37: Ratio of Male and Female Employees in Exporting /Non-Exporting Companies . .  .  .  . 38
LIST OF TABLES

Table 1: Profile of Necessary New Positions for 2009–2015. .  .  .  .  .  .  .  .  .  .  .  .  .  .  .  .  .  .  .  .  .  .  .  .  .  .  .  .  .  .  . 30

Table 2: Midterm Job Creation Results in the Six Strategic Sectors . .  .  .  .  .  .  .  .  .  .  .  .  .  .  .  .  .  .  .  .  .  .  .  . 31

Table 3: Midterm Results for Exports in the Six Strategic Sectors. .  .  .  .  .  .  .  .  .  .  .  .  .  .  .  .  .  .  .  .  .  .  .  .  .  . 31
THE OPPORTUNITIES AND CHALLENGES FOR
FEMALE LABOR FORCE PARTICIPATION IN MOROCCO
Yuko Morikawa

INTRODUCTION: ECONOMIC                                         velopment. Seguino6 makes a rather provocative claim

DEVELOPMENT AND FEMALE                                         that, in semi-industrialized economies, gender inequality

LABOR FORCE PARTICIPATION                                      actually promotes economic growth through enhanced
                                                               investment. Here, gender inequality concerns the wage
In the Middle East and North Africa (MENA) region,
                                                               levels between women and men, translated into higher
women remain untapped resources comprising 49 per-
                                                               profitability on investments using low-wage female la-
cent of the total population, including more than half
                                                               bor. Although similar arguments are made by Ertürk
of the university students in some countries, and yet
                                                               and Cagata,7 Schober8 makes a counterargument that
make up just 28 percent of the labor force (WB 2004).
                                                               gender inequality in wages is not related to higher eco-
Morocco is no exception; women make up 50 percent
of the population,1 47 percent of the tertiary education       nomic growth. Rather, the impact of gender inequality

enrollment,2 but only 26 percent of the labor force.3          is negative for growth. In these attempts to explain the

Furthermore, the female labor force participation (FLFP)       relationship between economic development and gender

rate in Morocco declined from 30 percent to 26 percent         equality, it is important to distinguish the two directions of

between 1999 and 2010.4 Indeed, the FLFP rate in the           causality: whether economic development brings about

MENA region is the lowest in the world (Figure 1). It is       gender equality, or gender equality brings about eco-

important to understand the mechanisms behind this             nomic development. According to Duflo,9 although we

low female participation rate, as higher FLFP rates            find supporting evidence for both directions of causality,
could lead to higher economic growth in the region. For        we need to consider policy options, acknowledging nei-
instance, according to a report by the World Bank, if  5       ther economic development nor women’s empowerment
FLFP rates were increased to predicted levels calcu-           is “the magic bullet” to realizing economic development
lated from various demographic and economic factors,           and gender equality.10
average household earnings would increase by 25 per-
cent, which would allow many of those households to            In a recent report by the IMF,11 a U-shaped relation-
achieve middle-class status (World Bank 2004).                 ship between GDP per capita and FLFP rated across
                                                               countries has been shown. Comparing the datasets
Many researchers have conducted studies on the rela-           for 1980 and 2010, we also find that the average FLFP
tionship between gender inequality and economic de-            rate shifted upward over the period.

The Opportunities and Challenges for Female Labor Force Participation in Morocco 		                                             1
Figure 1: Female Labor Force Participation Rate, 2002 and 2012 (Percent)
80
2002 2012
70
60
50
40
30
20
10
0
ages ages ages ages ages ages ages ages ages ages ages ages
15–24 15–64 15–24 15–64 15–24 15–64 15–24 15–64 15–24 15–64 15–24 15–64
East Asia South Europe & Latin America Middle East Sub-Saharan
& Pacific Asia Central Asia & Caribbean & North Africa Africa
Source: World Bank, World Development Indicator.
When we look at the same graph in 2010 while World Bank data (2004) indicates that the prevail-
showing the name of some MENA countries, it is ing pattern of economic development in MENA—
clear that these countries are not in line with the namely a large proportion of public sector jobs,
dominant U-shape relationship of FLFP rate and strong government controls, and inward-looking
GDP per capita, but remain at the bottom of the trade policies—has kept the FLFP rate low in the
U-shape because of low FLFP rates. This seems to region. Comparing MENA and East Asia, Klasen et
indicate the opportunity cost that these MENA coun- al.12 claim that gender gaps in employment explain a
tries are paying by not fully utilizing the potential of larger share of the growth differences between these
female labor (see Figure 3). two regions, suggesting that MENA countries are
held back by their low FLFP rates.
2 GLOBAL ECONOMY AND DEVELOPMENT PROGRAMFigure 2: Comparison of Female Labor Force Participation Across Countries, 1980 and 2010
Female labor force participation varies with income, ...with cross sectional points shifting upwards
with evidence pointing to a U-shaped relationship... over time.
Source: IMF, Women, Work and the Economy.
So why is the FLFP rate so low in Morocco and factors on FLFP, including both macro-level analysis
other MENA countries? What is necessary to focusing on aggregated demand, represented by the
achieve higher female labor participation? Drawing unemployment rate, and micro-level analysis on de-
on existing literature and statistics, this paper ex- mand from firms or other employers. Building upon
amines three approaches to understanding FLFP the analysis, the paper proposes policy measures
in Morocco. The first approach considers the role to enhance female participation in the Moroccan la-
played by social institutions, such as the legal frame- bor market. Since FLFP rates differ greatly between
work. 13
The second approach explores supply-side urban and rural areas, and rural women are mainly
factors, such as sociocultural norms and demo- engaged in agricultural activities, this paper focuses
graphic and household-related characteristics. The 14
on urban women.
third approach assesses the impact of demand-side
The Opportunities and Challenges for Female Labor Force Participation in Morocco 3Figure 3: Female Labor Force Participation Across Countries, 2010
100
90
80
female labor force participation, in percent
70
60
50
40
Turkey
30 Morocco Tunisia
Oman
20 Egypt Lebanon
Saudi Arabia
Iraq Algeria
10 Jordan
0
4 5 6 7 8 9 10 11 12
log of GDP per capita in constant 2000 in USD
Source: World Development Indicators, World Bank.
4 GLOBAL ECONOMY AND DEVELOPMENT PROGRAMSOCIAL INSTITUTIONS AND FLFP ranked 43rd among over 100 non-OECD countries,
the second-highest ranking for a MENA country after
The World Bank’s report Women, Business and the
Tunisia. In fact, significant reforms to the Moroccan
Law 2014 indicates that the MENA region had the
family law “Moudawana” in 2004 led to a rise in the
second-highest proportion of legal restrictions on
minimum marriage age for women from 15 to 18,
women in 1960 and the highest proportion today, 15
placed a family under the joint responsibility of both
which might partly explain the low participation of
spouses, and eliminated a woman’s legal obligation
women in MENA societies. For example, a husband’s
to obey her husband.19 However, there remain issues
unilateral right of divorce and a wife’s legal obligation
regarding enforcement, as some judges have circum-
to obey her husband may create an additional barrier
vented the law, while others are still unfamiliar with
to women’s entry into the labor force.16 At the same
the amendments.20 In 2012, roughly 10 percent of the
time, Rauch and Kostyshak17 note that MENA’s Arab
marriages recorded in Morocco involved a girl under
countries have laws that prohibit labor discrimination
the age of 18, permitted under articles 20 and 21 of
in the workplace, arguing that the lower level of FLFP
“Moudawana,” which allow family judges to autho-
has to stem from de facto discrimination rather than
rize the marriage of minors. Even though the articles
from de jure discrimination. This seems to be espe-
require well-substantiated arguments to justify such
cially applicable to Morocco. Branisa et al. 18 calcu-
marriages, more than 90 percent of requests are au-
late the social institution and gender index (SIGI) by
thorized.21 By removing legal restrictions on women,
considering a country’s family code, civil liberties, the
including those that are implicit, the society would be
physical integrity of citizens, traditional preferences
better prepared for working women.
for male offspring, and ownership rights. Morocco is
The Opportunities and Challenges for Female Labor Force Participation in Morocco 5SUPPLY-SIDE FACTORS their female members to work. According to a World
AND FLFP Bank report on Yemen published in 2014,29 unmarried
women in urban areas are more likely to participate in
Literature review the workforce than married women or women in rural
areas. This suggests that norms about women’s role
A m o n g s u p p l y - s i d e f a c t o r s i m p a c t i n g F L F P,
outside the home may be more strictly enforced after
H’madoun22 indicates that religion is a key determinant,
marriage and in more conservative, rural societies. In
with Muslim and Hindu women having a significantly
Morocco’s case, Taamouti and Ziroili30 examine the
lower participation rate than those of different religious
relationship between individual factors and FLFP, con-
backgrounds. The question of religion was further in-
cluding that for urban women, education is the main
vestigated by Hayo and Caris,23 who concluded that
determinant of labor market participation.
traditional identity and its perception of family roles
was a more meaningful explanation than religious
identity. Carvalho24 points out peer effects, proposing
Major labor indicators in Morocco
a model of social influence in which agents care about
According to official figures published by the Moroccan
the opinions of other members of their community. In
High Commission of Planning (HCP), the proportion
Amman, Jordan, Chamlou et al.25 find that traditional
of the employed, unemployed and inactive popula-
social norms, measured by the attitude of household
tions shows variation depending on sex and region. As
members toward working women, reduce female labor
shown in Figure 4, a large percentage of women, es-
participation. As for Morocco, the World Bank26 reports
pecially in urban areas, are categorized as “inactive,”
that more than 30 percent of young women face ob-
which includes students going to school and those who
stacles to working because their husband will not allow
are out of school and not working. Unemployment here
it, and 23 percent claim that their parents will not. Also,
is defined as those who are unemployed and looking
11 percent of them point to social norms as obstacles.
for a job. The proportion of unemployed is in general
These figures imply that sociocultural norms are one of
very low, while it is practically zero for rural women. It
the strong determinants of young female labor partici-
is important to note that in these figures, employment
pation in Morocco.
is defined in its larger sense including part-time and
irregular jobs. Even with this broad definition, only 10
With regard to demographic and household-related
percent of urban women are working. Considering re-
factors, Chamlou et al.27 argue that women with post-
cent developments in secondary education for urban
secondary education are more likely to participate,
girls, this figure remains quite low.
based on the data collected in Amman. In the case of
Pakistan, Kiani28 shows that education and household
The HCP data reveal a number of challenges:
expenditures have positive but insignificant impacts
on FLFP, whereas household income has a negative
Youth are disproportionately unemployed. The un-
impact. Here, higher expenditure has a positive impact
employment rate for youth aged 15 to 24 is more than
as female members would be expected to contribute
double (19.3 percent) the national level (9.2 percent).
financially in order to afford the necessary expendi-
This is important given the youth made up almost 20
ture, while household income has a negative impact
percent of the total population in 2010.31 According to
because high-income households have less need for
6 GLOBAL ECONOMY AND DEVELOPMENT PROGRAMFigure 4: Proportion of Inactive, Unemployed, and Employed Population
100%
90%
80%
70%
60%
50%
40%
30%
20%
10%
0%
total urban male rural male urban female rural female
Source: HCP (2013), Activity, Employment and unemployment inactive unemployed employed
World Bank estimates, youth aged 15 to 29 make up percent of the older age group is actively working com-
30 percent of the total population and 40 percent of the pared to 54 percent of the younger group.
active population (between ages 15 and 64). 32
The gap looks smaller with regard to females, since
There is a big gap between youth and the older the proportion of active women is much lower among
population in their engagement with the labor them. As for urban women, 6 percent of youth are em-
market, especially for men. Comparing young urban ployed, compared to 16 percent among the older age
males (aged 15–24) and older urban males (aged 25 group. The proportion of active rural women is gener-
and older), more than 70 percent of older males are ally higher than urban women, as they are engaged in
working, while only 24 percent of their young peers family agricultural activities.
are. A similar gap also exists in rural areas, where 85
The Opportunities and Challenges for Female Labor Force Participation in Morocco 7Figure 5: Proportion of Inactive, Unemployed, and Employed Population Among Youth and Older
Age Males
100%
90%
80%
70%
60%
50%
40%
30%
20%
10%
0%
urban male urban male rural male rural male
Youth (15–24) Older (25+) Youth (15–24) Older (25+)
Source: HCP (2013), Activity, Employment and Unemployment. inactive unemployed employed
Figure 6: Proportion of Inactive, Unemployed, and Employed Population Among Youth and
Older Age Females
100%
90%
80%
70%
60%
50%
40%
30%
20%
10%
0%
urban female urban female rural female rural female
Youth (15-24) Older (25+) Youth (15-24) Older (25+)
Source: HCP (2013), Activity, Employment and Unemployment. inactive unemployed employed
8 GLOBAL ECONOMY AND DEVELOPMENT PROGRAMGirls are enrolled in lower secondary education as urban and rural areas regarding enrollment in lower
much as boys in urban areas, but there remains a secondary education. As shown in Figure 8, the net en-
gap between urban and rural areas. As for primary rollment rate in lower secondary education is around 80
education enrollment rate, Morocco has made great percent for urban boys as well as urban girls, while the
progress, especially among rural girls. As shown in rate is much lower at 34 percent for rural boys and even
Figure 7, the net enrollment rate for primary education lower (26 percent) for rural girls. In terms of urban resi-
reached more than 95 percent across all categories by dents, we see that educational attainment up to lower
2012. However, a sharp contrast shows up between secondary education is almost equal for boys and girls.
Figure 7: Net Enrollment Rate, Primary Education (Percent)
105
100
95
90
85
80
75
2008/2009 2009/2010 2010/2011 2011/2012 2012/2013
Source: Moroccan Ministry of National Education. urban female urban male rural female rural male
Figure 8: Net Enrollment Rate, Lower Secondary Education (Percent)
90
80
70
60
50
40
30
20
10
0
2008/2009 2009/2010 2010/2011 2011/2012 2012/2013
Source: Moroccan Ministry of National Education. urban female urban male rural female rural male
The Opportunities and Challenges for Female Labor Force Participation in Morocco 9Opportunity cost of low FLFP. As the government and their circumstances.35 I will first review findings from
families are investing in education and girls’ educational the survey presented in the report with regard to youth
attainment, there is a huge opportunity cost if educated labor participation, and then analyze urban female de-
women work much less than their male peers. In addition, cision-making regarding labor participation. Finally, this
according to an OECD report, boys perform better than
33
section concludes with some policy recommendations
girls in mathematics in only 37 out of the 65 countries and to enhance urban female labor participation.
economies that participated in PISA 2012, and between
2000 and 2012 the gender gap in reading performance—
favoring girls—widened in 11 countries. The results indi- Review of the findings from the
cate that both boys and girls in all countries can succeed World Bank report
in all three subjects tested by PISA, highlighting the cost This part reviews some of the important findings
that MENA societies including Morocco are paying by not from the World Bank survey report with regard to
fully realizing the potential of educated females. youth labor participation.
Young females are even more discouraged than
Realities faced by Moroccan young males in finding jobs. Figure 9 shows the
young women, drawn from youth proportion of the population employed, unemployed or
survey data out of the labor force among youth aged 15 to 29 who
As we saw in the literature review, there are several are not enrolled in school. Looking at the population
supply-side factors impacting female participation in currently out of the labor force, a higher percentage of
the labor market, such as social norms, education and young females are demotivated (19 percent) in their
household income. We focus here on data on the urban search for work compared to young males (15.5 per-
female population, which shows the lowest rate of labor cent). While a majority (53.5 percent) is out of the labor
force participation among categories and describes the force because of family reasons or other constraints,
realities in which they live. In particular, the data demon-
34
almost 20 percent of urban young females are out of
strates how, despite the higher educational achievement the labor force because they are discouraged.
women are now enjoying, traditional norms are playing
a role in decision-making, and what changes might en- Non-participation among young females declines
hance their participation in the labor market. It is impor- with higher education. Figure 10 shows that higher
tant to establish career paths for educated young women educational attainment leads to higher participation in
that conform to social norms in order to promote further the labor force among women. The share of youth not
educational attainment for girls. If higher education fails in school and who are not participating in the labor mar-
to lead to higher returns through employment, rational ket decreases from 93 percent among those who have
calculation would discourage people from investing more completed primary education, to 81 percent for those
in education. with lower secondary education, and to 62 percent for
those with secondary education. With tertiary educa-
The World Bank conducted a household and youth sur- tion, only 37 percent of young females are out of the
vey in 2009–2010, for which data was collected from labor force. Comparing this big drop among females
2,883 young people aged 15 to 29 to better understand to that of males, the share of non-participating youth
10 GLOBAL ECONOMY AND DEVELOPMENT PROGRAMFigure 9: Labor Force Participation Status Among Youth (aged 15 to 29) Who Are Not in School
100%
80%
60%
40%
20%
0%
All Urban Rural All Urban Rural
National Male Female
Out of labor force—family reasons, other Out of Labor force—demotivated Unemployed Employed
Source: World Bank, 2010, MHYS 2009–2010.
Figure 10: Share of Youth Who Are Not in School and Who Are Out of the Labor Force
100%
80%
60%
40%
20%
0%
None Primary Lower Secondary Tertiary None Primary Lower Secondary Tertiary
secondary secondary
Source: Morocco Household and Youth Survey 2009-2010. male female
The Opportunities and Challenges for Female Labor Force Participation in Morocco 11among males is relatively stable ranging between 20 security. Figure 11 shows that the share of employment
and 27 percent for all education levels. Young women without contracts is overwhelmingly high for rural ar-
who have completed higher education have a higher eas (almost 100 percent for women and 94 percent for
probability of participating in the labor market. men), as well as for urban men (86 percent). However,
the share is much lower—around 60 percent—for urban
Informal employment is widespread, but not among women, while 40 percent of them are working with con-
urban young females. Youth tend to be engaged in tracts. Thus, the informality of employment may be a fac-
informal employment with neither contracts, nor social tor impacting urban female labor force participation.
Figure 11: Type of Job in Morocco by Area with contract no contract
100%
80%
60%
40%
20%
0%
Rural Urban Rural Urban
Female Male
Source: World Bank, 2010, MHYS 2009–2010.
Figure 12: Unemployment Rate in Morocco by Area
60%
40%
20%
0%
All Urban Rural All Urban Rural
Source: Morocco Household and Youth Survey 2009-2010. male female
12 GLOBAL ECONOMY AND DEVELOPMENT PROGRAMUrban female youth and labor We saw previously that the non-participation rate
participation decreased with higher education levels for young
Using the same World Bank data, this section analyzes women. There could be multiple factors explaining
urban female decision-making on labor participation this decrease. Given more than 45 percent of urban
and non-participation. females indicated family opposition as a reason for
non-participation, we can expect that family opposition
Social norms are a strong reason for not partici- becomes less dominant when female family members
pating. Figure 13 shows the reasons given by young are more educated. However, looking at the reason
females who are either currently in school but not ex- for not expecting or willing to work by education level
pecting to work afterwards, or already out of school (Figure 14), we see similar results for different educa-
and not willing to work. Family opposition constitutes tion levels, with some variation. Family opposition re-
more than 45 percent, while 30 percent of respondents mains a major reason in each education level, while for
said they are busy at home. those with a lower secondary education, the opposition
seems to come mainly from male spouses. However,
this interpretation should be treated carefully, as the
number of observations for those with a lower second-
Figure 13: Reason for Not Expecting/Willing ary education is limited to 28 percent, while the number
to Work Among Young Urban Females (aged is 68 percent for those without primary education and
15 to 29) in Morocco 78 percent for those with primary education.
Social norms become less dominant among urban
females with higher education, but they might be
busier at home. Assuming that family opposition is
related to societal norms, we can consider family op-
position, religious reasons and social norms as one
category representing sociocultural norms. The share
of this category among reasons declines with higher
education. The share is 61 percent for those without
a primary education, 52 percent for those with a pri-
mary education, and 46 percent for those with a lower
secondary education. Interestingly, the “busy at home”
1
2.25% parents won’t 3.2% husband won’t
3
allow allow reason constitutes 26 percent for females with the
0.395% religious reasons 7.905% social norms lowest education level, 31 percent for those with a pri-
.79% do not need to
0 1.581% I have no mary education, and 39 percent for those with a lower
work as family is well off appropriate skills to
find work
secondary education. It is impossible to draw a conclu-
5
.534% work is not fun. I
do not like working 30.43% busy at home sion from the existing data as the number of observa-
2
.372% I am unable to 5.534% other specify tion is limited. However, we might be able to interpret
find a job this result as an expression of transitional status that
those educated women are facing, between a growing
Source: World Bank, 2010 and MHYS 2009–2010.
The Opportunities and Challenges for Female Labor Force Participation in Morocco 13Figure 14: Comparison of Reasons for Not Expecting/Willing to Work Among Urban Females by
Education Level
Without primary education With primary education With lower-secondary education
p
arents won’t allow I am unable to find a job do not need to work as family is
well off
s ocial norms husband won’t allow
busy at home
w
ork is not fun. I do not like working I have no appropriate skills to
find work other specify
Source: World Bank, 2010 and MHYS 2009–2010.
expectation for them to contribute financially through there are no jobs so they are not searching for a job,
work and ongoing sociocultural barriers keeping them while less than 14 percent are tired of looking for a job.
at home, as indicated in Figure 2. Among urban males, the perception is different; 40 per-
cent believe that there are no jobs while more than 31
The unemployed are particularly discouraged. By percent are getting out of the labor market because they
surveying those urban women who are available for are tired of looking for a job. In each case, the number
work but unemployed (defined as those who did not of people who think they do not have enough training or
work in the last 7 days) and to all the participants who education is relatively small, just 5.5 percent for urban
are not searching for a job, the data tries to determine females and 6.7 percent for urban males, probably re-
why these groups are not searching for work. Among flecting their perception that they should be able to find a
unemployed youth, the main reason why they are not job based on their existing training or education.
searching for a job is that they believe there are no jobs.
The data show a difference between women and men Education and job searching are related among
who believe there are no jobs and those who are tired urban female students, while the unemployment
of looking for work, which is the second-biggest reason rate is high among secondary and tertiary educa-
for both genders. Among urban females, a majority of tion graduates. When all participants, regardless of
the unemployed (55 percent) indicated that they believe their current status, are asked the reason why they
14 GLOBAL ECONOMY AND DEVELOPMENT PROGRAMFigure 15: Reason Given by Moroccans Not Searching for Work
Urban males Urban females
believe there are no jobs family responsibilities no time to search
d
o not know an effective way to look lack of personal contacts opposition by a family member
for a job
I do not need to work already found work which will
w
aiting for government/public sector start later
tired of looking for work
recruitment
other (specify)
employers prefer to recruit women
d
o not have enough training or
education no suitable jobs
Source: World Bank, 2010 and MHYS 2009–2010.
are not searching for work, the main reason among training or education might imply they expect that get-
urban females was that they do not have enough train- ting more training or education will better prepare them
ing or education (30 percent), as shown in Figure 16. for future job searching. This corresponds to the drop
Considering the small portion of unemployed youth in the non-participation rate for urban women who have
who indicated insufficient training or education as their achieved higher educational attainment. However, in
primary reason for not searching for work, this larger Morocco, higher education does not necessarily lead
share among all participants can be explained by the to a higher employment rate even in urban areas.
larger presence of students among the sample (254 Figure 18 shows that the unemployment rate is higher
students out of a total of 595 responses by urban fe- for those with secondary education (27 percent for
males). Thus, when we subdivide into students and women and 17 percent for men) compared to those
non-students (Figure 17), we find that urban young with a primary education (20 percent for women and
women who are out of school do not suggest insuf- 13 percent for men). Even among those with a tertiary
ficient training or education is the reason why they are education, the unemployment rate remains high at 26
not searching for a job. Rather, they are facing fam- percent for females and 12 percent for males. Although
ily responsibilities or family opposition to their search participation in the labor market is greater among
for work. At the same time, a high percentage of the those who have completed higher education, employ-
students who answered that they do not have enough ment is far from guaranteed.
The Opportunities and Challenges for Female Labor Force Participation in Morocco 15Figure 16: Reason Given by Young Females for Not Searching for a Job in Urban Morocco
8
.91% believe there are 1.51% no time to search
no jobs
.84% health conditions do
0
0
.50% tired of looking for work not allow
0
.34% employers prefer to 13.95% family responsibilities
recruit men
3.11% opposition by a
1
2
.02% do not know an family member
effective way to look for a job
0
.00% lack of personal contacts
0
.17% employers prefer to
.00% already found work
0
recruit women
which will start later
0
.34% waiting for government/
7.90% I do not need to work
public sector recruitment
0.17% waiting for migration
1
.51% no suitable jobs
18.82% other
2
9.92% do not have enough
training or education
Source: World Bank, 2010, MHYS 2009–2010.
Figure 17: Reason for Not Searching for a Job Among All Urban Females
70% Students Non-students
60%
50%
40%
30%
20%
10%
0%
believe there are
no jobs
tired of looking
for work
employers prefer to
recruit men
do not know an
effective way to
look for a job
employers prefer to
recruit women
waiting for
government/ public
sector recruitment
no suitable jobs
do not have
enough training or
education
no time to search
health conditions
do not allow
family
responsibilities
opposition by a
family member
lack of personal
contacts
already found work
which will start later
I do not need to
work
waiting for
migration
other
Source: World Bank, 2010 and MHYS 2009–2010.
16 GLOBAL ECONOMY AND DEVELOPMENT PROGRAMFigure 18: Unemployment Rates in Morocco by Education Level (Percent)
30
urban females urban males
25
20
15
10
5
0
without education primary secondary tertiary others
Source: Haut Commissariat au Plan, 2012. Activity, Employment, and Unemployment.
Public sector jobs are preferred for their stability by Comparing responses among men and women, women
those with a higher education. As shown in Figure 19, have a stronger preference for public salaried work,
in urban areas, females and males both prefer salaried especially those with a secondary education or higher.
public sector jobs upon completion of higher education. Indeed, 65 percent of urban females who, at a minimum,
Correspondingly, there is decreasing interest in salaried have graduated from high school prefer to find work in
private sector jobs among higher educated females and the public sector, while the percentage is only 50 percent
males, with 13 percent of lower secondary education fe- for their urban male equivalents. The difference mainly
male graduates interested, 10 percent of high school or shows up in the preference for independent work or self-
tertiary education female graduates interested, and 14 employment among individuals possessing more than a
percent and 11 percent interested, respectively, among high school education, some 25 percent of urban females
males. The result implies that private salaried jobs are and 38 percent of urban males. Among urban females,
less attractive for those with higher education, even there seems to be a stronger preference for job security
though Morocco’s manufacturing sector is believed to over greater independence as a worker. The reason for
have had some success in increasing female participa- their preference for salaried work, both public and private,
tion in the salaried private sector. Quality and stable
36
is largely explained by the greater security these jobs pro-
salaried jobs in the private sector need to be promoted vide. Given the fact that the majority of respondents pre-
for those productive youth to be more engaged in pri- ferring salaried work prefer public sector jobs, this means
vate sector development. they find more job security in public sector employment.
The Opportunities and Challenges for Female Labor Force Participation in Morocco 17Figure 19: Job Preference Among Urban Youth in Morocco
Job preference among urban males Job preference among urban females
100 100
90 90
80 80
70 70
60 60
50 50
40 40
30 30
20 20
10 10
0 0
total less than primary lower- secondary total less than primary lower- secondary
primary education secondary education primary education secondary education
education and more education and more
salaried (private sector) salaried (public sector) independent/self employed
Source: World Bank, 2010, MHYS 2009–2010.
Figure 20: Reason for Preference for Salaried Employment Among Urban Youth in Morocco
80%
70% urban males urban females
60%
50%
40%
30%
20%
10%
0%
Greater job Less Better work Better career Earn more Better work Access Acquire Others
security responsibility schedule prospects as salaried environment to social experience
employee security and
medical
insurance
Source: World Bank, 2010, MHYS 2009–2010.
18 GLOBAL ECONOMY AND DEVELOPMENT PROGRAMComparison of values the statement “when jobs are scarce, men should have
To better understand the rationale behind the youth more right to a job than women,” while a majority of
responses shown above, it is insightful to look at the the sample in Chile disagreed, and almost half of the
values underlying Moroccan society. The World Value sample in Japan answered “neither.” This would seem
Survey, which consists of nationally representative sur- to confirm that a majority of people in Jordan, Morroco,
veys conducted in almost 100 countries and focuses on and Malaysia believe that male employment should be
human beliefs and values, enables comparisons across prioritized, perhaps as they think it is likely that men
countries by using a uniform questionnaire. The follow- are the main income earners in a family.
ing section offers some comparisons between Morocco,
Jordan, Malaysia, Chile, and Japan. Jordan is chosen Values around working women and housewives
as it shares similarities with Morocco, Malaysia is an differ. When asked generally about the relationship
Asian Muslim majority37 country, Chile is an example of between work and women, respondents in all five
a fast-growing country from Latin America, and Japan countries value the independence women enjoy when
as a non-Muslim country with a “traditional” value set. they have a job, with half of the samples agreeing
with the statement, “having a job is the best way for
Men are perceived as the main income earners. a woman to be an independent person.” Less than 30
Perceptions on gender roles vary across countries. In percent of the sample disagreed with the statement,
Jordan, Morocco, and Malaysia, majorities agreed with even in Morocco and Jordan.
Figure 21: When Jobs Are Scarce, Men Should Have More Right to a Job Than Women
Agree Neither Disagree
81%
57% 61%
57%
49%
30% 31%
24% 26%
18% 18%
14% 13%
6% 6%
Chile Japan Jordan Malaysia Morocco
Source: World Value Survey 2010–2014.
The Opportunities and Challenges for Female Labor Force Participation in Morocco 19Figure 22: Having a Job Is the Best Way for a Woman to Be an Independent Person
72% 70%
53%
49% 50%
33%
26% 28% 28%
21%
16%
10% 3% 10% 9%
6%
3% 2% 0%
1%
Chile Japan Jordan Malaysia Morocco
Source: World Value Survey 2010–2014. Agree Neither Disagree Don’t Know
However, the samples react differently to statements People in Jordan and Morocco are positive toward the
associating women with their role as mothers. To the statement “being a housewife is just as fulfilling as
statement representing “traditional” values, “when a working for pay,” while people in Malaysia and Chile
mother works for pay, the children suffer,” 57 percent show more diverse values among people, with slightly
of the sample in Jordan strongly agree, whereas in more opposition. In the case of Japan, a majority of the
Malaysia 57 percent of the sample disagree, and 23 sample agreed to the statement, in contrast to their dis-
percent strongly disagree. Although people in Chile felt agreement to the statement about the negative image
least strongly among the five countries about a man’s of working mothers.
right to employment, the proportion of people either dis-
agreeing or strongly disagreeing is higher in Malaysia Looking at the attitudes across the five countries, we
than in Chile. It seems that in Malaysia, the role of a could say that, in general, people agree with the no-
mother is not considered to be undermined by the fact tion that women become more independent when they
that she is working. Comparing Morocco to Jordan, have a job. However, when women become mothers,
Moroccan values are more moderate, with 25 percent of there are two types of countries: one which values the
the sample strongly agreeing to the statement, while 39 “formal” work of mothers as much as their “informal”
percent agree and a total 26 percent either disagreeing work at home, and the other which perceives “formal”
or strongly disagreeing. An interesting case is Japan, in work by mothers negatively by assuming children
which almost half (48 percent) of the sample disagree, would suffer from it. In the latter type of countries, in-
while one-third of the sample say they don’t know, pos- cluding Morocco and Jordan, the value of housewives
sibly reflecting conflicts of values among individuals. is highly regarded, which could lead young women to
internalize these values and to more of them becoming
Except for Japan, similar results show up regarding the housewives in these societies, unless there are other
statement focusing on the value of being a housewife. factors coming into play.
20 GLOBAL ECONOMY AND DEVELOPMENT PROGRAMFigure 23: When a Mother Works for Pay, the Children Suffer
57% 57%
48%
41%
39%
32%
28% 29%
25%
23%
18% 19%
14% 14%
8% 8% 7% 8%
7% 7%
4%
1% 2%
0% 0%
Chile Japan Jordan Malaysia Morocco
Source: World Value Survey 2010–2014. Strongly Agree Agree Disagree Strongly Disagree Don’t Know
Figure 24: Being a Housewife Is Just as Fulling as Working for Pay
52%
46%
41%
37% 37%
28% 29% 30% 30%
27%
21%
18%
13% 14% 14% 13%
10% 11%
7% 7% 8%
3%
1% 0% 0%
Chile Japan Jordan Malaysia Morocco
Source: World Value Survey 2010–2014. Strongly Agree Agree Disagree Strongly Disagree Don’t Know
Women’s education and their success in work. To education for girls. This level of disagreement is the
the statement “university education is more important highest among the five countries. Taken together with
for a boy than for a girl,” more than 70 percent of the the previous results, this might imply the different val-
sample population in four out of five countries dis- ues Moroccans associate with young women before
agrees (including strong disagreement). In Morocco, marriage and with those who are married, particularly
nearly 40 percent of the sample strongly disagrees to with children.
it, indicating the importance Moroccans put on tertiary
The Opportunities and Challenges for Female Labor Force Participation in Morocco 21Figure 25: University Education is More Important for a Boy than for a Girl
46% 44%
40%
36% 37%
35% 34%
36% 31%
28%
15% 17%
13% 12% 13% 13%
10% 9% 10% 8%
6%
3% 3%
0% 0%
Chile Japan Jordan Malaysia Morocco
Source: World Value Survey 2010–2014. Strongly Agree Agree Disagree Strongly Disagree Don’t Know
When asked about the potential performance of in Malaysia, where working mothers are encour-
women at work, majorities in Jordan and in Morocco aged, 14 percent strongly agree to the statement
agree to the statement “on the whole, men make and 45 percent agree, while only 36 percent dis-
better business executives than women do.” Similar agree. In Malaysia, mothers seem to feel less guilty
results can be seen regarding men and women as when they work, but that does not mean that female
political leaders. In Chile, about 70 percent of the potential is recognized as much as that of men.
sample disagree or strongly disagree. Interestingly,
Figure 26: On the Whole, Men Make Better Business Executives than Women Do
45%
42%
40%
36% 36% 36%
33%
29% 29%
23% 25%
22%
20%
15% 14% 14%
10%
7% 6% 6%
4% 3%
0% 1%
0%
Chile Japan Jordan Malaysia Morocco
Source: World Value Survey 2010–2014. Strongly Agree Agree Disagree Strongly Disagree Don’t Know
22 GLOBAL ECONOMY AND DEVELOPMENT PROGRAMPolicy suggestions It would be interesting to look at Malaysia to help deter- Based on the above analysis, urban females in mine the factors making people believe in the value of Morocco have higher expectations of participating in working mothers. Although there might be a question the labor market when they are more educated. At on which comes first—reality or belief—in either case, the same time, because of greater job security, those such a case study would provide insights for Morocco, females want public sector employment, which is such as the importance of child care facilities or vari- becoming scarce for new entrants. Looking at the at- ous forms of help from relatives in rearing children. titudes shared across different societies, we see that values such as university education for women’s in- Another possible approach by the government is dependence through employment are highly regarded the promotion of decent work in the private sector. by Moroccans, as much as they are in other countries. Improving the quality of private sector jobs in terms of However, when it comes to women with children, they job security and working environment would lower the tend to prioritize their role as mothers over their role physical and sociocultural hurdles for urban women as workers. A pilot case in Jordan shows that an inter- to work in the private sector, thus enhancing female vention through vocational training was more effective participation in the labor market. Creating decent jobs in rural communities than in an urban, heterogeneous in the private sector is even more crucial given the environment. In urban areas, the job retention rate public sector is no longer able to absorb all the new was only 20 percent after the intervention. Major con- entrants seeking higher quality work. These aspects straints result from transportation challenges, wage related to industry will be examined in the following level, marriage, type of job, and cultural issues.38 part of the paper. The Opportunities and Challenges for Female Labor Force Participation in Morocco 23
DEMAND-SIDE FACTORS                                        Returning to the question of FLFP, the relationship

     AND FLFP                                                   between the unemployment rate and FLFP can be
                                                                interpreted in two ways. When weak economic perfor-
     Overview of industry-related factors
                                                                mance fails to generate sufficient levels of employment
     The third approach uses demand-side factors to explain
                                                                to absorb new entrants into the labor market, it is likely
     the low female labor force participation rate. This ap-
                                                                to result in lower FLFP, since employers prefer to hire
     proach includes both macro-level analysis focusing on
                                                                men based on the understanding that male income
     aggregated demand represented by the unemployment
                                                                is more important to their families.40 For instance, the
     rate and micro-level analysis of demand from firms.
                                                                International Labor Organization (ILO)41 reports that,
                                                                in North Africa, the female youth unemployment rate
     Before addressing the question of female participation,
                                                                increased by 9.1 percentage points in the aftermath
     here are several findings from a recent report by the
                                                                of the economic crisis, compared to 3.1 percentage
     World Bank on job creation in the MENA region. First,
                                                                points for young males. And yet, comparison of the
     GDP growth over the last two decades was driven by
                                                                relationship between unemployment and female par-
     demographic change rather than labor productivity.
                                                                ticipation in OECD countries and MENA countries in-
     Private sector job creation was too weak to absorb the
                                                                dicates that in the long term, a healthy economy with
     fast-growing labor force. Second, the fundamentals of
                                                                higher female participation in the labor force is also
     job creation in the MENA region are similar to those in
                                                                more likely to enjoy lower unemployment.42
     other regions: it is young firms and more productive
     firms that create more jobs. In the MENA region, how-
                                                                In terms of micro-level analysis of demand-side fac-
     ever, low firm turnover (firm entry and exit) and slow
                                                                tors, Fakih and Ghazalian43 find that firm-related fac-
     productivity growth limit the pool of young and more
                                                                tors—mainly private foreign ownership and exporting
     productive firms and, ultimately, reduce job creation.
                                                                activities—have positive implications for FLFP rates
     This is because of a combination of slow within-firm
                                                                in MENA’s manufacturing sector. Similar results
     productivity growth and misallocation of labor and
                                                                are found in Egypt, where foreign-owned firms are
     capital across firms. Third, various policies across
                                                                more likely to employ women than their domestic
     MENA countries limit competition and undermine firm
                                                                counterparts. In addition, large firms are much more
     turnover, productivity growth, and job creation. Using
                                                                likely than small- and medium-sized firms to employ
     Morocco as one case, the report shows that several
                                                                women, and the textile sector is the most likely of all
     dimensions of the business environment such as tax
                                                                sectors to employ women.44
     administration, corruption, and the cost of finance
     impact employment growth and disproportionately
                                                                Figures 27 and 28 show profiles of current active
     affect young firms. Finally, the report provides direct
                                                                workers in urban areas in Morocco by industry and by
     evidence that policies in MENA countries have often
                                                                professional category. As these figures focus on urban
     been captured by a few politically connected firms.
                                                                areas, workers are mainly engaged in either “industry,
     This has led to a policy environment that creates privi-
                                                                building and public work” or “services.” In the “industry,
     leges rather than a level playing field, and undermines
                                                                building and public work” sector, more than 60 percent
     private sector growth and job creation.39 These factors
                                                                of the workers are classified as artisans and skilled
     lie behind the high unemployment rate among youth in
                                                                craft workers for both men and women. The services
     MENA countries.

24   GLOBAL ECONOMY AND DEVELOPMENT PROGRAM
Figure 27: Sector and Profession, Urban Males Figure 28: Sector and Profession, Urban Females
3,000,000 800,000
700,000
2,500,000
600,000
2,000,000
500,000
1,500,000 400,000
300,000
1,000,000
200,000
500,000
100,000
0 0
Agriculture, Industry, Services Agriculture, Industry, Services
forestry and building and forestry and building and
fishery public work fishery public work
0
–2 4 6 8–9
3
5 7
0: legislative members, locally elected personnels, directors and 5: operators in agriculture, fishery or forestry
managements of companies
6: artisans and skilled craft workers
1: senior managers and members of liberal professions
7: laborers in agriculture and fishery including skilled laborers
2: middle managers
8: plant and machine operators and assembly workers
3: employees
9: non-agricultural laborers, workers in small businesses
4: merchants, commercial and financial intermediaries
10: out of classification
Source: Haut Commissariat au Plan, 2012. Activity, Employment and Unemployment.
The Opportunities and Challenges for Female Labor Force Participation in Morocco 25professional category varies more, covering almost wide, equivalent to nearly one in 10 jobs in the global
all professional categories. Among females, services workforce.46 The high intensity of labor within the in-
sector workers are mainly managers, employees, and dustry makes it a significant source of employment and
small business workers. We see that the services sec- places it among the world‘s top creators of jobs that
tor is providing a significant number of salaried posi- require varying degrees of skills and allow for quick
tions for women. It is especially remarkable that 35 entry into the workforce by youth, women and migrant
percent of female workers in services correspond to workers.47 Tourism’s ability to generate employment,
the professional categories 0-2, while only 14 percent not only in the formal sector but also in informal sec-
of male positions do. This implies that there is a higher tor activities, has been cited as one of its key advan-
percentage of senior management-level jobs among tages for developing countries.48 Sinclair49 also points
urban working women in the services industry. out that empirical studies have revealed the relatively
skill-intensive nature of tourism employment. This re-
We know that the low FLFP represents a large op- quires more detailed study, as a more recent analysis
portunity cost for MENA societies, while even young indicates a high proportion of low-skilled domestic-type
males are having difficulties getting decent private jobs, which are open to female workers in the sector.50
sector work. Also, industrial policies in these coun- Another important point is that the tourism industry has
tries sometimes hinder healthy competition among a significant multiplier effect on employment in other
firms and therefore result in fewer jobs than might be sectors. With regard to the sectoral supply chain, one
expected. What industrial policies are being pursued job in the core tourism industry indirectly generates
in Morocco in order to spur job creation and promote roughly 1.5 additional jobs in the related economy.51
higher FLFP? In the following sections, the paper
takes a closer look at the tourism sector in the services With regard to gender in tourism-related employment,
industry and manufacturing industry as an example. a United Nations Environment and Development UK
It examines strategies set by the Government of (UNED–UK) study estimated that, on average, 46 per-
Morocco for tourism—Vision 2020—and for the manu- cent of the tourism workforce was female in 2002.52 At
facturing industry—Emergence Plan—and their impact the same time, many companies in the tourism sector
on job creation. It is noteworthy that neither strategy are small and often family enterprises, the mixture of
makes explicit reference to issues affecting, or policies paid work and domestic work among women is un-
promoting, FLFP. clear, which makes it difficult to distinguish between
formal and informal employment.53 In terms of income
disparities, there is a significant income gap between
Tourism as a job-creating industry: male and female workers in the sector, with females
from “Vision 2010” to “Vision 2020” earning less than males, which might be due to more
Labor dynamics in the tourism industry managerial posts being occupied by men.54 The ILO
According to the ILO, the tourism industry is one of notes education and vocational training are key requi-
the fastest-growing sectors of the global economy, ac- sites for the operational effectiveness of the sector.55
counting for more than one-third of the total global ser- Whether the required training is to be provided by the
vices trade.45 By 2022, it is estimated that employment government or by employers, the sector needs quali-
in tourism would account for 328 million jobs world- fied employees to improve its quality.
26 GLOBAL ECONOMY AND DEVELOPMENT PROGRAMYou can also read