The role of neutrophil gelatinase associated lipocalin and iron homeostasis in object recognition impairment in aged sepsis survivor rats
←
→
Page content transcription
If your browser does not render page correctly, please read the page content below
www.nature.com/scientificreports
OPEN The role of neutrophil
gelatinase‑associated lipocalin
and iron homeostasis in object
recognition impairment in aged
sepsis‑survivor rats
Yoshikazu Nikaido1,2*, Yoko Midorikawa2, Tomonori Furukawa3, Shuji Shimoyama3,
Daiki Takekawa2, Masato Kitayama2, Shinya Ueno3, Tetsuya Kushikata2 & Kazuyoshi Hirota2
Older adult patients with sepsis frequently experience cognitive impairment. The roles of brain
neutrophil gelatinase-associated lipocalin (NGAL) and iron in older sepsis patients remain unknown.
We investigated the effects of lipopolysaccharide-induced sepsis on novel object recognition test,
NGAL levels, an inflammatory mediator tumor necrosis factor-α (TNFα) levels, and iron ion levels
in the hippocampus and cortex of young and aged rats. The effect of an iron chelator deferoxamine
pretreatment on aged sepsis rats was also examined. Young sepsis-survivor rats did not show impaired
novel object recognition, TNFα responses, or a Fe2+/Fe3+ imbalance. They showed hippocampal and
cortical NGAL level elevations. Aged sepsis-survivor rats displayed a decreased object discrimination
index, elevation of NGAL levels and Fe2+/Fe3+ ratio, and no TNFα responses. Pretreatment with
deferoxamine prevented the reduction in the object recognition of aged sepsis-survivor rats. The
elevation in hippocampal and cortical NGAL levels caused by lipopolysaccharide was not influenced
by deferoxamine pretreatment. The lipopolysaccharide-induced Fe2+/Fe3+ ratio elevation was blocked
by deferoxamine pretreatment. In conclusion, our findings suggest that iron homeostasis in the
cortex and hippocampus contributes to the maintenance of object recognition ability in older sepsis
survivors.
Sepsis is a form of multiple organ failure that is associated with high mortality and caused by dysregulation of
innate immune responses to infection1. Older adult patients with sepsis often experience cognitive dysfunction,
including sepsis-associated encephalopathy (SAE)2,3. The pathogenesis of SAE involves various processes, such
as neuroinflammation, oxidative stress, and disruption of the blood–brain barrier (BBB)4. Peripheral proin-
flammatory cytokines such as tumor necrosis factor α (TNFα) and interleukin-1β induce impairment of BBB
integrity and deliver inflammatory signals to the central nervous system (CNS)4. Furthermore, sickness behavior
and neuroinflammation induced by bacterial endotoxin lipopolysaccharide (LPS) are exacerbated with a ging5,6.
Despite progress in our understanding of the pathogenesis of SAE, we are still unable to prevent SAE. Thus, SAE
remains a critical issue related to postoperative and intensive care unit care.
Acute-phase protein neutrophil gelatinase-associated lipocalin (NGAL) is an inflammatory mediator and its
levels are clinically correlated with sepsis severity7. NGAL is also involved in iron delivery to and export from
cells via a transferrin-independent m echanism8. Systemic LPS injection increases peripheral and brain NGAL
concentrations9,10. Under pathological conditions, NGAL contributes to the dysregulation of iron metabolism,
glial activation, and neuronal death11–14; however, some studies have reported that NGAL has neuroprotective
functions15–17. Our recent microarray study found that the iron chelator deferoxamine (DFO) can attenuate
NGAL mRNA expression upregulation induced by chronic diazepam treatment in the mouse hippocampus
and cortex18. Serum iron and ferritin levels are positively correlated with sepsis severity and m ortality19. Iron
in the CNS plays essential roles in numerous biological processes such as mitochondrial respiration, protein
1
Department of Frailty Research and Prevention, Hirosaki University Graduate School of Medicine,
Hirosaki 0368562, Japan. 2Department of Anesthesiology, Hirosaki University Graduate School of Medicine,
Hirosaki 0368562, Japan. 3Department of Neurophysiology, Hirosaki University Graduate School of Medicine,
Hirosaki 0368562, Japan. *email: ynikaido@hirosaki-u.ac.jp
Scientific Reports | (2022) 12:249 | https://doi.org/10.1038/s41598-021-03981-7 1
Vol.:(0123456789)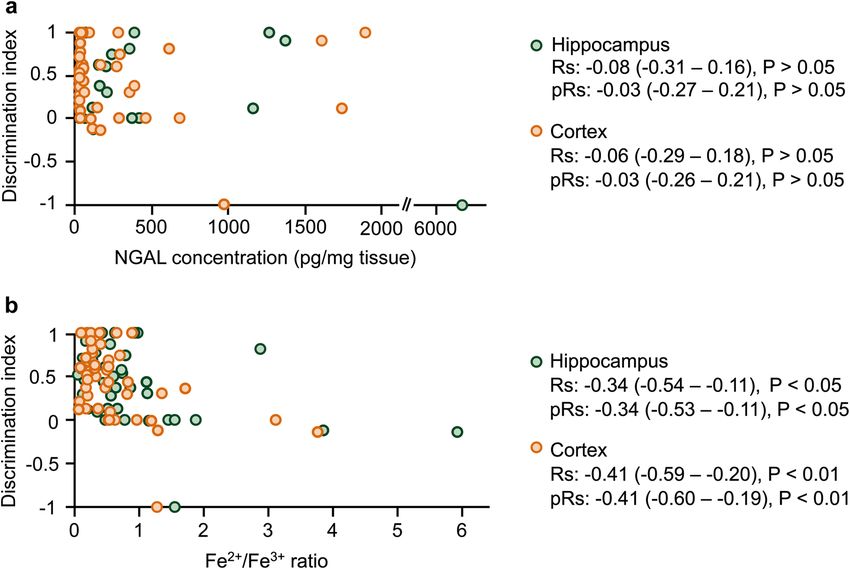
www.nature.com/scientificreports/
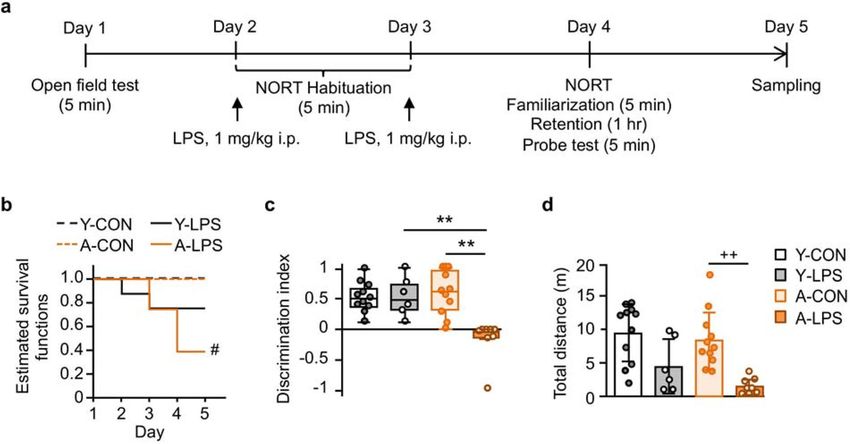
Figure 1. Dual lipopolysaccharide (LPS) challenge induced lethal sepsis and object discrimination impairment
in aged rats. (a) Schematic representation of the experimental protocol. Young and aged rats were assigned to
control or 1 mg/kg LPS intraperitoneal injection groups after being subjected to the open field test (Y-CON
group, n = 11; A-CON group, n = 11; Y-LPS group, n = 8; A-LPS group, n = 20). Y-LPS and A-LPS group rats were
administered LPS after each novel object recognition test (NORT) habituation session. On Day 4, survivor rats
were subjected to the NORT. (b) The Kaplan–Meier survival curves showed that the survival rate of the A-LPS
group was significantly lower than that of the A-CON group. (c,d) In the NORT, the discrimination index and
locomotor activity of the A-LPS group were significantly reduced compared with those of the A-CON group.
There were no significant differences in the survival rate and the NORT performance between Y-CON and
Y-LPS groups. The behavioral data are presented as the median ± IQR or mean ± SD. Y-CON, n = 11; Y-LPS,
n = 6; A-CON, n = 11; A-LPS, n = 8. Log-rank test with Bonferroni correction, #P < 0.05, A-CON vs. A-LPS;
permuted Brunner-Munzel test with Bonferroni correction, **P < 0.01, effect size p̂ ≥ 0.96; Welch’s ANOVA
[F3,14.1 = 17.7, P < 0.001, ω2 = 0.73] and post-hoc Bonferroni corrected Welch’s t-test, ++P < 0.01, Hedge’s g = 2.08.
synthesis, and cellular metabolisms; however, iron accumulation in the cortex and hippocampus is a risk factor
for neurodegenerative diseases20. Ferric (Fe3+) and ferrous ions (Fe2+) are sources of reactive oxygen species and
contribute to the aggregation of Amyloid-β, Tau, and α-synuclein20. These findings suggest that NGAL and iron
metabolism might have therapeutic potential for cognitive dysfunction associated with neuroinflammation and
neurodegeneration.
In this study, we investigated the effects of systemic LPS injections on brain NGAL levels, TNFα levels, iron
ion levels, and object recognition in young and aged rats. Furthermore, we examined whether DFO treatment
could ameliorate LPS-induced cognitive dysfunction in aged rats.
Results
LPS induced lethal sepsis and object recognition deficit in aged sepsis‑survivor rats. We first
investigated the effects of LPS-induced sepsis on survival and object recognition in young (n = 19) and aged
rats (n = 31; Fig. 1a). To confirm the effects of aging on the baseline anxiety state of the rats, we evaluated the
anxiety-related behavior in the open field test (OFT) before LPS injections. There was no significant difference
in anxiety-related behavior between groups [time spent in the center area, median (inter-quartile range, IQR):
young, 2.9 (0.0–10) sec; aged, 2.4 (0.0–16) sec; Brunner-Munzel test, T39.6 = 1.02, P > 0.05, effect size p̂ = 0.59].
Aged rats displayed less locomotor activity in the arena than young rats [total distance, mean (± standard devia-
tion, SD): young, 14 (± 5.5) m; aged, 9.9 (± 3.2) m; Welch’s t-test, t25.9 = 3.04, P < 0.05, Hedge’s g = 0.81]. Young and
aged rats were left untreated (Y-CON and A-CON groups) or challenged by two i.p. 1 mg/kg LPS injections given
24 and 48 h after the OFT (Y-LPS and A-LPS groups). In young rat groups, no significant difference was seen in
the survival rate followed by the LPS challenge (Fig. 1b). There were significantly fewer survivors in the A-LPS
group than the A-CON group [hazard ratio (HR) 0.13, 95% CI 0.03–0.46; log-rank test, z = 2.80, P < 0.05]. In the
NORT test, the discrimination index of the A-LPS group was significantly decreased compared with those of the
A-CON and Y-LPS groups (Fig. 1c). LPS significantly reduced locomotor activity in the A-LPS group (Fig. 1d).
There were no significant differences between Y-CON and Y-LPS groups in the NORT.
Aged sepsis‑survivor rats showed NGAL elevations and iron dyshomeostasis in the hippocam‑
pus and cortex. LPS significantly increased NGAL levels in the hippocampus and cortex in the Y-LPS and
Scientific Reports | (2022) 12:249 | https://doi.org/10.1038/s41598-021-03981-7 2
Vol:.(1234567890)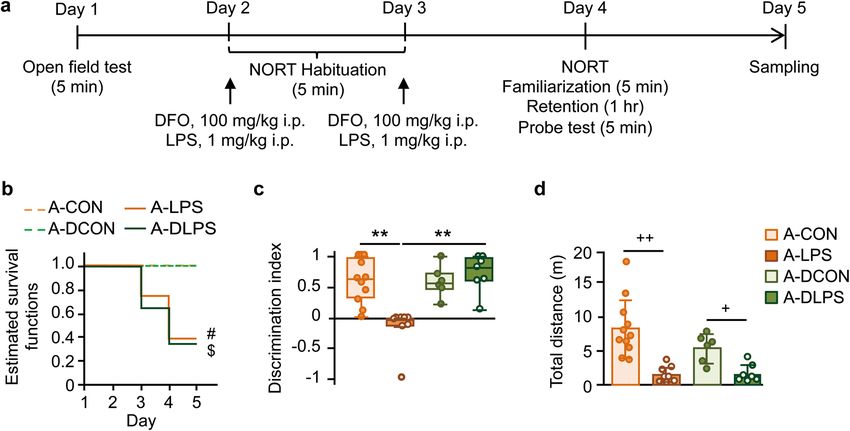
www.nature.com/scientificreports/
a b
6500 1500
*
pg/mg tissue
pg/mg tissue
*
6000 * 1000 40
**
1000 40 **
* 30 30
**
500 ** 20 500 20
10 10
0 0 0 0
c d
25 25
pg/mg tissue
20
pg/mg tissue
20
15 15
10 10
5 5
0 0
e f
400 300
**
ng/mg tissue
ng/mg tissue
300 ** ** **
200
** **
200 *
100
100
0 0
Fe3+ Fe2+ Total Fe3+ Fe2+ Total
g h
8 * 6
** 5
**
6
4
Ratio
Ratio
4 3
2
2
1
0 0
Figure 2. Aged sepsis-survivor rats showed neutrophil gelatinase-associated lipocalin (NGAL) elevations and
dysregulation of iron homeostasis in the hippocampus and cortex. (a,b) The Y-LPS and A-LPS groups showed
significant elevations of NGAL levels in the hippocampus and cortex. The hippocampal and cortical NGAL
concentrations in the A-CON group were higher than those in the Y-CON group. (c,d) There were no significant
changes in the hippocampal and cortical tumor necrosis factor α (TNFα) levels. (e) The A-LPS group displayed
increases in the hippocampal F e2+ levels compared with the A-CON group. (f) The concentration of F e3+, Fe2+,
and total iron ion in the cortex in the A-LPS group was higher than those in the A-CON group. (g,h) The
hippocampal and cortical Fe2+/Fe3+ ratio of the A-LPS group was increased compared with those of the A-CON
group. The data are presented as the median ± IQR. Y-CON, n = 11; Y-LPS, n = 6; A-CON, n = 11; A-LPS, n = 8.
Permuted Brunner-Munzel test with Bonferroni correction, *P < 0.05, effect size p̂ ≥ 0.87, **P < 0.01, p̂ ≥ 0.90.
A-LPS groups (Fig. 2a,b). The A-CON group displayed higher hippocampal and cortical NGAL levels than the
Y-CON group [hippocampus, median (IQR): Y-CON, 6.2 (4.2–9.6) pg/mg tissue; A-CON, 11.0 (10.0–28.0) pg/
mg tissue; permutated Brunner-Munzel test, T = 4.60, P < 0.05, effect size p̂ = 0.87; cortex, median (IQR): Y-CON,
7.8 (6.5–12.1) pg/mg tissue; A-CON, 14.0 (12.5–30.3) pg/mg tissue; T = 6.08, P < 0.01, p̂ = 0.90]. No significant
differences were observed in TNFα levels in the hippocampus or cortex (Fig. 2c,d). In the hippocampus (Fig. 2e),
the concentration of F e2+ in the A-LPS group was significantly higher than those of the A-CON and Y-LPS
Scientific Reports | (2022) 12:249 | https://doi.org/10.1038/s41598-021-03981-7 3
Vol.:(0123456789)www.nature.com/scientificreports/
Figure 3. Deferoxamine (DFO) pretreatment blocked LPS-induced impairment of object discrimination in
aged rats. (a) Aged rats were assigned to the 100 mg/kg DFO intraperitoneal treatment or 1 mg/kg LPS injection
with DFO pretreatment group (A-DCON, n = 6, or A-DLPS, n = 20). DFO was administered 1 h before LPS
injections. Details of the A-CON and A-LPS groups were as in Fig. 1. (b) The survival rate of the A-DLPS group
was significantly lower than that of the A-DCON group. There was no significant difference between the survival
rates of the A-LPS and A-DLPS groups. (c) In the NORT, A-DLPS group rats showed a higher discrimination
index than A-LPS group rats. (d) DFO pretreatment did not attenuate the LPS-induced reduction of locomotion
in the NORT. The behavioral data are presented as the median ± IQR or mean ± SD. A-CON, n = 11; A-LPS, n = 8;
A-DCON, n = 6; A-DLPS, n = 7. Log-rank test with Bonferroni correction: #P < 0.05, A-CON vs. A-LPS; $P < 0.05,
A-DCON vs. A-DLPS. Permuted Brunner-Munzel test with Bonferroni correction: **P < 0.01, effect size p̂ = 0.96.
Welch’s ANOVA [ F3,14.1 = 12.8, P < 0.001, ω2 = 0.66] and post-hoc Bonferroni corrected Welch’s t-test, +P < 0.05,
Hedge’s g = 1.97, ++P < 0.01, g = 2.08.
groups. The cortical F e3+, Fe2+, and total iron concentration in the A-LPS group were significantly increased
compared with those in the A-CON group (Fig. 2f). The ratio of hippocampal F e2+ to Fe3+ in A-LPS group rats
was higher than those in A-CON and Y-LPS group rats (Fig. 2g). The A-LPS group showed a higher cortical Fe2+/
Fe3+ ratio than the A-CON groups (Fig. 2h).
DFO pretreatment prevented LPS‑caused object recognition impairment in aged rats. We
next investigated whether DFO pretreatment attenuated LPS-induced lethal sepsis and object recognition defi-
cit of aged rats (Fig. 3a). Another 26 rats were randomly assigned to the 100 mg/kg DFO injection (A-DCON,
n = 6) or 1 mg/kg LPS with 100 mg/kg DFO preinjection (A-DLPS, n = 20) groups. There were no significant
differences in baseline activity in the OFT between groups [time spent in the center area, median (IQR): aged-
group, 4.0 (2.4–8.1) s; DFO-treated aged-group, 4.2 (2.1–7.7) s; Brunner-Munzel tests, T 53.3 = 0.07, P > 0.05, effect
size p̂ = 0.49; distance traveled, mean (± SD): aged-group, 9.9 (± 3.2) m; DFO-treated aged-group, 11 (± 2.9) m;
Welch’s t-test, t54.7 = 1.8, P > 0.05, Hedge’s g = 0.48]. Pretreatment with DFO did not influence the survival rate
after LPS challenge (A-DLPS vs. A-LPS, HR 0.78, 95% CI 0.29–2.10; log-rank test, z = 0.23, P > 0.05; Fig. 3b).
DFO pretreatment blocked LPS-induced object discrimination impairment of the A-DLPS group in the NORT
(Fig. 3c). Pretreatment with DFO did not influence LPS-induced decreases in locomotor activity (Fig. 3d).
Pretreatment with DFO blocked iron ion accumulation and imbalance in the hippocampus
and cortex in aged sepsis‑survivor rats. DFO pretreatment did not suppress LPS-induced elevation of
NGAL levels in the hippocampus and cortex (Fig. 4a,b). TNFα levels in the hippocampus and cortex were com-
parable among the groups (Fig. 4c,d). DFO injection reduced the levels of iron ions in the hippocampus and cor-
tex (Fig. 4e,f). The hippocampal and cortical iron ion levels in the A-DLPS group were significantly lower than
those in the A-LPS group. In the hippocampus, there was no significant difference between A-LPS and A-DLPS
groups in the ratio of F e2+ to Fe3+ (Fig. 4g). The cortical Fe2+/Fe3+ ratio in the A-DLPS group was significantly
lower than that in the A-LPS group (Fig. 4h). There were no significant differences in each iron ion level and the
Fe2+/Fe3+ ratio in the hippocampus or cortex between the A-DCON and A-DLPS groups.
Hippocampal and cortical iron levels were negatively correlated with object recognition abil‑
ity. The Spearman correlation and partial correlation analysis controlling for NGAL or F e2+/Fe3+ ratio were
performed to estimate the relationship between object recognition ability and brain NGAL or iron levels. There
Scientific Reports | (2022) 12:249 | https://doi.org/10.1038/s41598-021-03981-7 4
Vol:.(1234567890)www.nature.com/scientificreports/
a b
6500 * 2500
*
pg/mg tissue
pg/mg tissue
6000 2000
* 40 40
1500 1500
30 * 30
1000 1000
20 20
500 10 500 10
0 0 0 0
c d
25 25
pg/mg tissue
pg/mg tissue
20 20
15 15
10 10
5 5
0 0
e f
400 ** 300 **
** ** ** **
**
ng/mg tissue
ng/mg tissue
300 ** 200 ** **
* ** * **
200
** *
100
100
0 0
Fe3+ Fe2+ Total Fe3+ Fe2+ Total
g h
8 * 6 **
** 5 *
6
4 **
Ratio
Ratio
4 3
2
2 1
0 0
Figure 4. LPS-induced iron ion elevation and imbalance were blocked by pretreatment with DFO in aged
sepsis-survivor rats. (a,b) A-DLPS rats showed NGAL level elevations in the hippocampus and cortex. (c,d)
There were no significant differences in the hippocampal and cortical TNFα concentrations among groups. (e–f)
The hippocampal and cortical iron ion levels in the A-DLPS group were significantly lower than those in the
A-LPS group. (g,h) The A-DLPS group showed a lower F e2+/Fe3+ ratio in the cortex but not in the hippocampus
than the A-LPS group. DFO treatment significantly reduced each iron ion level and F e2+/Fe3+ ratio in the
hippocampus and cortex. The data are presented as the median ± IQR. A-CON, n = 11; A-LPS, n = 8; A-DCON,
n = 6; A-DLPS, n = 7. Permuted Brunner-Munzel test with Bonferroni correction: *P < 0.05, effect size p̂ ≥ 0.89,
**P < 0.01, p̂ ≥ 0.92.
were no significant correlations between the discrimination index and NGAL level in the hippocampus and
cortex (Fig. 5a). The Spearman correlation and partial correlation analysis controlling for NGAL revealed that
the Fe2+/Fe3+ ratio in the hippocampus and cortex had a significant negative correlation with the discrimination
index (Fig. 5b).
Scientific Reports | (2022) 12:249 | https://doi.org/10.1038/s41598-021-03981-7 5
Vol.:(0123456789)www.nature.com/scientificreports/
Figure 5. Object discrimination ability was negatively correlated with the F e2+/Fe3+ ratio in the hippocampus
and cortex. (a) Spearman correlation (Rs) and partial correlation (pRs) analysis revealed no significant
relationship between the discrimination index and the hippocampal and cortical NGAL levels. (b) The F e2+/Fe3+
ratio in the hippocampus and cortex exhibited a significant negative correlation with the discrimination index.
The partial correlation analysis was controlled for Fe2+/Fe3+ ratio (a) or NGAL level (b). The coefficients are
presented with (95% CI). n = 49.
Discussion
In this study, we investigated the effects of LPS-induced sepsis on object recognition and brain NGAL, TNFα,
and iron ion levels in aged and young survivor rats. Young sepsis-survivor rats showed elevation of NGAL levels
in the hippocampus and cortex. Aged sepsis-survivor rats displayed impairment of object recognition ability,
elevations in the hippocampal and cortical NGAL levels, and dysregulation of iron ion levels. Pretreatment with
the iron chelator DFO inhibited LPS-induced object recognition impairment and iron ion elevations. In addition,
the Fe2+/Fe3+ ratio in the hippocampus and cortex was negatively correlated with object recognition ability. These
results suggest that LPS induces cognitive dysfunction associated with dysregulation of iron metabolism in aged
sepsis-survivor rats. Furthermore, DFO may prevent these LPS-induced deleterious effects.
In our study, dual LPS injection caused lethal sepsis but not induced hippocampal or cortical TNFα responses
48 h after the last injection in aged survivor rats. Preconditioning of sublethal-dose endotoxin exposure induces
tolerance to subsequent endotoxin exposure, reducing TNFα response and mortality21. This discrepancy might be
because of differences in the experimental procedures (doses and timing of LPS injections). Although we could
not further investigate endotoxin tolerance in this study, we found that dual LPS challenge induced severe sepsis,
NGAL elevation, and cognitive impairment in aged rats. Recently, increasing evidence that NGAL is involved in
both neuroinflammation and neuroprotection has been o btained22. Upon exposure to inflammatory conditions,
NGAL is predominantly synthesized and secreted by astrocytes in the b rain14. Secreted NGAL stimulates sur-
rounding astrocytes and microglia to become reactive, resulting in an amplified inflammatory response12,13. On
the other hand, NGAL absence exacerbates proinflammatory cytokine and chemokine responses in the mouse
CNS after systemic LPS challenge or experimental autoimmune encephalomyelitis15,16. These studies indicate that
NGAL might serve as a neuroprotective factor in response to neuroinflammation. However, this study provided
no direct evidence that NGAL exerts inflammatory or protective effects or both.
In pathological conditions, iron accumulation and ferric/ferrous ion imbalance produce reactive oxygen
species like highly reactive hydroxyl radicals by Fenton reaction, resulting in apoptosis, necrosis, autophagy, and
ferroptosis20,23. Indeed, patients with neurodegenerative diseases, including Alzheimer’s disease and Parkinson’s
disease, show iron accumulation in the cortex and h ippocampus24,25. A recent study revealed that LPS induces
cognitive deficits and iron accumulation in the hippocampi and cortices of aged mice by upregulating microglial
heme oxygenase-1 (HO-1) expression26. Overexpression of HO-1 in older adults causes cognitive decline and
aggregation of Aβ and Tau along with iron a ccumulation27,28. LPS increases iron accumulation with upregulation
of divalent metal transporter 1 (DMT1) expression in neurons and microglia29. These reports support our present
findings that increases in Fe2+ levels and Fe2+/Fe3+ imbalances in the hippocampus and cortex might contribute
to cognitive disturbance in LPS-injected aged rats.
Scientific Reports | (2022) 12:249 | https://doi.org/10.1038/s41598-021-03981-7 6
Vol:.(1234567890)www.nature.com/scientificreports/
In the present study, pretreatment with DFO blocked LPS-induced increases in F e2+ levels, iron dysmetabo-
lism, and cognitive deficits in aged rats. Partly consistent with our findings, DFO treatment for six consecutive
days can prevent neuroinflammation, iron overload, and sickness behaviors26. DFO has a high affinity for Fe3+
and might chelate them in the brain following disruption of the BBB by L PS30,31. DFO-induced F e3+ chelation
reduces the cytosolic labile iron pool (LIP), attenuates the expression of both DMT1 and the iron storage fer-
ritin, and promotes the expression of the iron exporter ferroportin 1 after LPS t reatment26,32. In addition, the
reversible Fe3+ to F
e2+ transition might compensate for decreased Fe3+ levels through the cytosolic LIP33. Indeed,
compared with aged survivors, DFO-pretreated aged rats showed reductions in total iron levels and the F e2+/
3+
Fe ratio in the hippocampus and cortex. Therefore, iron chelation might contribute to iron homeostasis in the
hippocampus and cortex after endotoxin challenge to maintain cognitive function.
There were several limitations of this study. First, we found that aging increased approximately twofold
NGAL levels in the cortex and hippocampus. A recent human and mouse plasma proteome study reveals that
plasma NGAL levels show an aging-related exponential increase34, suggesting that NGAL might serve as an
aging predictor of the CNS; however, the mechanisms remain unclear. Second, based on our previous s tudy18,
the present study assumed that DFO pretreatment would attenuate LPS-induced NGAL elevation and cogni-
tive deficits. However, our present results have supported the finding that NGAL elevation in the CNS during
LPS-based sepsis did not affect cognitive impairments22. Unexpectedly, LPS injections following DFO pretreat-
ments caused a greater brain NGAL level elevation than LPS injections alone. Although iron-chelated DFO has
anti-microbial potential, some gram-negative and -positive bacteria can use DFO for efficient iron uptake and
growth35,36. These findings suggest that DFO pretreatment had promoted pathogenic bacterial growth in aged rat
body cavity even if under a specific pathogen-free environment, probably leading to enhance immune response
and sepsis. Thus, DFO-induced iron depletion might prime NGAL responsiveness as an anti-bacterial effector
or iron donor; however, whether LPS-induced NGAL elevation exerts pathogenic, protective, or no roles in
the CNS via iron-endocytosis or -exocytosis remains unknown. Furthermore, the dose of DFO 32 mg/kg/day,
equivalent to rat dose 200 mg/kg37, improved outcomes of patients with intracerebral hemorrhage at day-18038.
In the aged rat model of intracerebral hemorrhage, DFO 100 mg/kg (human-equivalent dose, 16 mg/kg/day37),
the same amount used in this study, improved neurological and functional recovery39. These clinical trials and
experimental studies indicate that DFO might have protective effects on cognitive function; however, additional
studies are needed to validate the safety and effectiveness of DFO to sepsis-associated cognitive dysfunction.
Finally, we could not investigate the effects of DFO on brain HO-1 expression and other cognitive-behavioral
tests such as the object location test, contextual fear conditioning, and various operant tasks in this study. Fur-
ther behavioral and biochemical studies are required to provide a comprehensive mechanism of sepsis-induced
cognitive dysfunction, including NGAL, HO-1, and other iron regulator proteins.
In conclusion, we have demonstrated that iron homeostasis in the cortex and hippocampus contributes to
maintenance of object recognition after LPS-induced sepsis in aged rats. Although further study is required to
improve the survival rate, our study provides new insights into the potential of pharmacological iron chelators
as therapeutic targets for sepsis-associated cognitive deficits, including SAE.
Methods
Animals. Male Sprague–Dawley rats aged 1.5–3 months (n = 19, 180–440 g) and 12–18 months (n = 57, 580–
900 g) were used for behavioral and biochemical analysis. The animals were group-housed at 24 ± 2 °C under
a 12-h light–dark cycle (lights on at 8:00 a.m.), and food and water were available ad libitum. All experiments
were carried out in accordance with the ARRIVE Guideline and the guidelines for animal research issued by the
Hirosaki University Graduate School of Medicine. This study was approved by the Animal Research Committee
of Hirosaki University (approval number M19019). All experimental analyses were performed by the observers
blinded and automatic analysis software. All efforts were made to minimize the number of animals used and
their suffering.
Drugs
Rats in the LPS groups were intraperitoneally (i.p.) injected with 1 mg/kg of LPS (E. coli O111:B4; Wako Pure
Chemical Industries, Osaka, Japan) after two consecutive daily habituation sessions for the novel object rec-
ognition test. Another groups of aged rats were i.p. treated with 100 mg/kg of DFO (Novartis Pharmaceutical
Corporation, Tokyo, Japan) 1 h before LPS administration or treated with DFO39.
Behavioral experiment protocol. An experimental protocol based on and modified from previous stud-
ies was used to investigate the effects of LPS on cognitive function40,41. Rats were randomly assigned to four
groups: the aged control (A-CON); aged 1 mg/kg LPS injection (A-LPS); young control (Y-CON); and young
1 mg/kg LPS (Y-LPS) groups (Fig. 1a). Other aged rats were randomly assigned to the 100 mg/kg DFO injection
(A-DCON) or 1 mg/kg LPS with 100 mg/kg DFO preinjection (A-DLPS) groups (Fig. 3a).
Open field test (OFT). We performed the OFT to confirm the effects of age on locomotor activity and
anxiety. The behavior of the rats in an OFT arena (60 × 60 × 60 cm, 50 lx) was recorded for 5 min using the
CaptureStar video tracking system (CleverSys, Reston, VA, USA). Horizontal locomotor activity [total distance
traveled (m)] and the time spent in the center area (s) were automatically analyzed with TopScan behavioral
analysis software (CleverSys).
Novel object recognition test (NORT). Rats were habituated to a NORT arena (60 × 60 × 60 cm, 50 lx)
not containing objects for 5 min for two consecutive days. Twenty-four hours after the last habituation session,
Scientific Reports | (2022) 12:249 | https://doi.org/10.1038/s41598-021-03981-7 7
Vol.:(0123456789)www.nature.com/scientificreports/
the animals were subjected to the NORT. Each rat was introduced to the test arena, which contained two refer-
ence objects, and allowed to explore for 5 min freely (familiarization session). After a 1-h retention interval, the
animals were returned to the same test arena containing a familiar object and novel one and allowed to explore
for 5 min (probe test session). The objects were colored brick towers (5 × 5 × 10 cm), white Styrofoam balls
(10 cm diameter), or grey steel boxes (3 × 8 × 8 cm). These objects were randomly used as familiar or novel with-
out duplication. During each session, exploratory behavior was recorded with the CaptureStar system (Clever-
Sys). The total distance traveled (m) and time spent exploring each object (s) in the probe test were automatically
analyzed by TopScan software (CleverSys). The following formula was used to assess novel object recognition
ability during the NORT probe test session: discrimination index = [novel object contact (s) − familiar object
contact (s)]/total object contact time (s).
Biochemical assay for NGAL and TNFα. Rats were sacrificed by rapid decapitation 24 h after the NORT,
and the hippocampi and cortices were collected. Each brain sample was homogenized in ice-cold phosphate-
buffered saline. The centrifuged supernatants were stored at − 20 or – 80 °C until further analysis. NGAL levels
in the hippocampus and cortex were measured using an enzyme-linked immunosorbent assay kit (NGAL ELISA
Kit, KIT046, BioPort Diagnostics, Hellerup, Denmark). The assay detection limit was 0.5 pg/ml, and the intra-
and interassay coefficients of variance were 4% and 12%, respectively. The hippocampal and cortical TNFα levels
were also determined by an ELISA kit (TNF-α ELISA kit CSB-E11987r, Cusabio Technology, Wuhan, China).
The detection limit of the assay was 1.56 pg/ml, and the intra- and interassay coefficients of variance were < 8%
and < 10%, respectively. Data were obtained using the Bio-Rad iMark™ Microplate Reader (Bio-Rad Laborato-
ries, Hercules, CA, USA).
Iron ion level assay. Total iron and Fe2+ levels in the hippocampus and cortex were measured using an iron
assay kit (Iron Assay Kit ab83366, Abcam, Tokyo, Japan). According to the instructions, the brain samples were
homogenized in assay buffer and centrifuged. For F e2+ level assay, F
e2+ reacted with 3-(2-pyridyl)-5,6-bis(2-
(5-furylsulfonic acid))-1,2,4-triazine (Ferene-S) was measured at 593 nm. Total iron ions were detected at
593 nm following the reduction of Fe3+ to Fe2+ using an iron reducer provided by the assay kit42. Colorimetric
data were acquired using the microplate reader (Bio-Rad Laboratories). The assay detection limit was 8 μM. The
Fe3+ level was calculated by subtracting the Fe2+ level from the total iron ion level.
Statistical analysis. The sample size (estimated minimal N/group = 5) to achieve a power (1-β error prob-
ability) of 0.8, α error probability of 0.05, and effect size of 0.94 was determined by G*Power 3.1.9.7 (Faul F, Uni-
versity of Kiel, Kiel, Germany) based on the NORT study by Kawano et al.40,43. The Shapiro–Wilk test was used to
estimate the normality of the d ata44. Based on the normality, data are presented as the mean (standard deviation,
SD) or median (inter-quartile range, IQR) with individual data p oints45. The log-rank test for Kaplan–Meier
analysis with Bonferroni correction was used to assess the survival data between g roups46. The two-tailed Welch’s
t-test, Welch’s analysis of variance (ANOVA) followed by the post hoc t-test, Brunner-Munzel test, or Brunner-
Munzel permutation test was used to determine the significance of differences between groups47. P < 0.05 was
considered significant. For multiple comparisons, each P-value was adjusted to < 0.05 by the Bonferroni correc-
tion. The effect size was estimated using Hedge’s g, ω2, or p̂47,48. The Spearman correlation analysis and partial
correlation analysis controlling for NGAL level or Fe2+/Fe3+ ratio in each brain region were performed to evalu-
ate the relationships between the discrimination index and NGAL level or Fe2+/Fe3+ ratio. Statistical analyses
were performed with R version 4.0.5 (R Core Team, R Foundation for Statistical Computing, Vienna, Austria)
and MATLAB 2020b (The MathWorks, Natick, MA, USA).
Data availability
The datasets used during the current study are available from the corresponding author on reasonable request.
Received: 8 September 2021; Accepted: 13 December 2021
References
1. Singer, M. et al. The third international consensus definitions for sepsis and septic shock (sepsis-3). JAMA 315, 801–810 (2016).
2. Iwashyna, T. J., Ely, E. W., Smith, D. M. & Langa, K. M. Long-term cognitive impairment and functional disability among survivors
of severe sepsis. JAMA 304, 1787–1794 (2010).
3. Semmler, A. et al. Persistent cognitive impairment, hippocampal atrophy and EEG changes in sepsis survivors. J. Neurol. Neurosurg.
Psychiatry 84, 62–69 (2013).
4. Kuperberg, S. J. & Wadgaonkar, R. Sepsis-associated encephalopathy: The blood–brain barrier and the sphingolipid rheostat. Front.
Immunol. 8, 597 (2017).
5. Godbout, J. P. et al. Exaggerated neuroinflammation and sickness behavior in aged mice after activation of the peripheral innate
immune system. FASEB J. 19, 1329–1331 (2005).
6. Henry, C. J., Huang, Y., Wynne, A. M. & Godbout, J. P. Peripheral lipopolysaccharide (LPS) challenge promotes microglial hyper-
activity in aged mice that is associated with exaggerated induction of both pro-inflammatory IL-1β and anti-inflammatory IL-10
cytokines. Brain Behav. Immun. 23, 309–317 (2009).
7. Hou, X. et al. The value of neutrophil gelatinase-associated lipocalin and citrullinated alpha enolase peptide-1 antibody in diagnosis,
classification, and prognosis for patients with sepsis. Medicine 99, e21893 (2020).
8. Ferreira, A. C. et al. From the periphery to the brain: Lipocalin-2, a friend or foe?. Prog. Neurobiol. 131, 120–136 (2015).
9. Flo, T. H. et al. Lipocalin 2 mediates an innate immune response to bacterial infection by sequestrating iron. Nature 432, 917–921
(2004).
Scientific Reports | (2022) 12:249 | https://doi.org/10.1038/s41598-021-03981-7 8
Vol:.(1234567890)www.nature.com/scientificreports/
10. Ip, J. P. K. et al. Lipocalin 2 in the central nervous system host response to systemic lipopolysaccharide administration. J. Neuro-
inflamm. 8, 124 (2011).
11. Dekens, D. W. et al. Lipocalin 2 contributes to brain iron dysregulation but does not affect cognition, plaque load, and glial activa-
tion in the J20 Alzheimer mouse model. J. Neuroinflamm. 5, 330 (2018).
12. Lee, S. et al. A dual role of lipocalin 2 in the apoptosis and deramification of activated microglia. J. Immunol. 179, 3231–3241
(2007).
13. Lee, S. et al. Lipocalin-2 is an autocrine mediator of reactive astrocytosis. J. Neurosci. 29, 234–249 (2009).
14. Mesquita, S. D. et al. Lipocalin 2 modulates the cellular response to amyloid beta. Cell Death Differ. 21, 1588–1599 (2014).
15. Berard, J. L. et al. Lipocalin 2 is a novel immune mediator of experimental autoimmune encephalomyelitis pathogenesis and is
modulated in multiple sclerosis. Glia 60, 1145–1159 (2012).
16. Kang, S. S. et al. Lipocalin-2 protects the brain during inflammatory conditions. Mol. Psychiatry 23, 344–350 (2018).
17. Xing, C. et al. Neuronal production of lipocalin-2 as a help-me signal for glial activation. Stroke 45, 2085–2092 (2014).
18. Furukawa, T. et al. Chronic diazepam administration increases the expression of Lcn2 in the CNS. Pharmacol. Res. Perspect. 5,
e00283 (2017).
19. Brandtner, A. et al. Linkage of alterations in systemic iron homeostasis to patients’ outcome in sepsis: A prospective study. J.
Intensive Care 8, 76 (2020).
20. Ward, R. J., Zucca, F. A., Duyn, J. H., Crichton, R. R. & Zecca, L. The role of iron in brain ageing and neurodegenerative disorders.
Lancet Neurol. 13, 1045–1060 (2014).
21. López-Collazo, E. & del Fresno, C. Pathophysiology of endotoxin tolerance: Mechanisms and clinical consequences. Crit. Care.
17, 242 (2013).
22. Olson, B. et al. Chronic cerebral lipocalin 2 exposure elicits hippocampal neuronal dysfunction and cognitive impairment. Brain
Behav. Immune. 97, 102–118 (2021).
23. Hota, K. B., Hota, S. K., Srivastava, R. B. & Singh, S. B. Neuroglobin regulates hypoxic response of neuronal cells through Hif-1α-
and Nrf2-mediated mechanism. J. Cereb. Blood Flow Metab. 32, 1046–1060 (2012).
24. Ayton, S. et al. Cerebral quantitative susceptibility mapping predicts amyloid-β-related cognitive decline. Brain 140, 2112–2119
(2017).
25. Thomas, G. E. C. et al. Brain iron deposition is linked with cognitive severity in Parkinson’s disease. J. Neurol. Neurosurg. Psychiatry.
91, 418–425 (2020).
26. Fernández-Mendívil, C. et al. Protective role of microglial HO-1 blockade in aging: Implication of iron metabolism. Redox Biol.
38, 101789 (2021).
27. Fernández-Mendívil, C., Arreola, M. A., Hohsfield, L. A., Green, K. N. & López, M. G. Aging and progression of beta-amyloid
pathology in alzheimer’s disease correlates with microglial heme-oxygenase-1 overexpression. Antioxidants 9, 644 (2020).
28. Hui, Y. et al. Long-term overexpression of heme oxygenase 1 promotes tau aggregation in mouse brain by inducing tau phospho-
rylation. J. Alzheimers Dis. 26, 299–313 (2011).
29. Urrutia, P. et al. Inflammation alters the expression of DMT1, FPN1 and hepcidin, and it causes iron accumulation in central
nervous system cells. J. Neurochem. 126, 541–549 (2013).
30. Banks, W. A. et al. Lipopolysaccharide-induced blood-brain barrier disruption: Roles of cyclooxygenase, oxidative stress, neuro-
inflammation, and elements of the neurovascular unit. J. Neuroinflamm. 12, 223 (2015).
31. Eybl, V., Kotyzová, D., Kolek, M., Koutenský, J. & Nielsen, P. The influence of deferiprone (L1) and deferoxamine on iron and
essential element tissue level and parameters of oxidative status in dietary iron-loaded mice. Toxicol. Lett. 128, 169–175 (2002).
32. Zhang, X. Y., Cao, J. B., Zhang, L. M., Li, Y. F. & Mi, W. D. Deferoxamine attenuates lipopolysaccharide-induced neuroinflamma-
tion and memory impairment in mice. J. Neuroinflamm. 12, 20 (2015).
33. Belaidi, A. A. & Bush, A. I. Iron neurochemistry in Alzheimer’s disease and Parkinson’s disease: Targets for therapeutics. J. Neu-
rochem. 139, 179–197 (2016).
34. Lehallier, B. et al. Undulating changes in human plasma proteome profiles across the lifespan. Nat. Med. 25, 1843–1850 (2019).
35. Kim, C. M., Park, Y. J. & Shin, S. H. A widespread deferoxamine-mediated iron-uptake system in Vibrio vulnificus. J. Infect. Dis.
196, 1537–1545 (2007).
36. Arifin, A. J., Hannauer, M., Welch, I. & Heinrichs, D. E. Deferoxamine mesylate enhances virulence of community-associated
methicillin resistant Staphylococcus aureus. Microbes Infect. 16, 967–972 (2014).
37. Selim, M. et al. Safety and tolerability of deferoxamine mesylate in patients with acute intracerebral hemorrhage. Stroke 42,
3067–3074 (2011).
38. Selim, M. et al. Deferoxamine mesylate in patients with intracerebral haemorrhage (i-DEF): A multicentre, randomised, placebo-
controlled, double-blind phase 2 trial. Lancet Neurol. 18, 428–438 (2019).
39. Okauchi, M., Hua, Y., Keep, R. F., Morgenstern, L. B. & Xi, G. Effects of deferoxamine on intracerebral hemorrhage-induced brain
injury in aged rats. Stroke 40, 1858–1863 (2009).
40. Kawano, T. et al. Impact of preoperative environmental enrichment on prevention of development of cognitive impairment fol-
lowing abdominal surgery in a rat model. Anesthesiology 123, 160–170 (2015).
41. Nikaido, Y. et al. Cis-3-Hexenol and trans-2-hexenal mixture prevents development of PTSD-like phenotype in rats. Behav. Brain
Res. 297, 251–258 (2016).
42. Leal, S. M. Jr. et al. Targeting iron acquisition blocks infection with the fungal pathogens Aspergillus fumigatus and Fusarium
oxysporum. PLOS Pathog. 9, e1003436 (2013).
43. Faul, F., Erdfelder, E., Lang, A. G. & Buchner, A. G*Power 3: A flexible statistical power analysis program for the social, behavioral,
and biomedical sciences. Behav. Res. Methods 39, 175–191 (2007).
44. Ö̈ner, M. & Kocakoç, İ. D. JMASM 49: A compilation of some popular goodness of fit tests for normal distribution: Their algorithms
and MATLAB codes (MATLAB). J. Mod. Appl. Stat. Methods. 16, 547–575 (2017).
45. Borau, C. BoxPlotPro. MATLAB Central File Exchange. Retrieved May 14, 2021 from https://www.mathworks.com/matlabcent
ral/fileexchange/88733-boxplotpro (2021).
46. Cardillo, G. LogRank: Comparing survival curves of two groups using the log rank test. MATLAB Central File Exchange. Retrieved
May 14, 2021 from http://www.mathworks.com/matlabcentral/fileexchange/22317 (2021).
47. Konietschke, F., Placzek, M., Schaarschmidt, F. & Hothorn, L. nparcomp: An R software package for nonparametric multiple
comparisons and simultaneous confidence intervals. J. Stat. Softw. 64, 1–17 (2015).
48. Ben-Shachar, M., Lüdecke, D. & Makowski, D. effectsize: Estimation of effect size indices and standardized parameters. J. Open
Source Softw. 5, 2815 (2020).
Acknowledgements
The authors thank Izumi Miki, technical assistant at Hirosaki University, for technical assistance.
Scientific Reports | (2022) 12:249 | https://doi.org/10.1038/s41598-021-03981-7 9
Vol.:(0123456789)www.nature.com/scientificreports/
Author contributions
Conceptualization: Y.N., T.K., and K.H.; design of the study: Y.N., T.K., and K.H.; investigation: Y.N., Y.M., T.F.,
S.S., and D.T.; data analysis; Y.N., Y.M., T.F., S.S., M.K., and S.U.; writing-original draft preparation: Y.N., Y.M.,
T.F., and S.S.; writing-reviewing and editing D.T., M.K., S.U., T.K., and K.H.; supervision; T.K. and K.H. All
authors reviewed the final manuscript.
Funding
This work was supported by the Japan Society for the Promotion of Science (JSPS) KAKENHI [Grant numbers
JP17H04319 (to KH), JP18K08807 (to TK), JP19K09341 (to YN), JP19K09342 (to MK)]. JSPS had no role in
the study’s design; the collection, analysis, and interpretation of the data; the writing of the manuscript; or the
decision to submit the manuscript for publication.
Competing interests
Y.N. belongs to the Department of Frailty Research and Prevention, Hirosaki University Graduate School of
Medicine, in collaboration with FANCL Corporation, Tokyo, Japan. The company had no role in the study’s
design; the collection, analysis, interpretation of the data; the writing of the manuscript; or the decision to submit
the manuscript for publication. The other authors declare no competing interests.
Additional information
Correspondence and requests for materials should be addressed to Y.N.
Reprints and permissions information is available at www.nature.com/reprints.
Publisher’s note Springer Nature remains neutral with regard to jurisdictional claims in published maps and
institutional affiliations.
Open Access This article is licensed under a Creative Commons Attribution 4.0 International
License, which permits use, sharing, adaptation, distribution and reproduction in any medium or
format, as long as you give appropriate credit to the original author(s) and the source, provide a link to the
Creative Commons licence, and indicate if changes were made. The images or other third party material in this
article are included in the article’s Creative Commons licence, unless indicated otherwise in a credit line to the
material. If material is not included in the article’s Creative Commons licence and your intended use is not
permitted by statutory regulation or exceeds the permitted use, you will need to obtain permission directly from
the copyright holder. To view a copy of this licence, visit http://creativecommons.org/licenses/by/4.0/.
© The Author(s) 2022
Scientific Reports | (2022) 12:249 | https://doi.org/10.1038/s41598-021-03981-7 10
Vol:.(1234567890)You can also read