The sensitivity of simulated aerosol climatic impact to domain size using regional model (WRF-Chem v3.6)
←
→
Page content transcription
If your browser does not render page correctly, please read the page content below
Geosci. Model Dev., 15, 199–218, 2022
https://doi.org/10.5194/gmd-15-199-2022
© Author(s) 2022. This work is distributed under
the Creative Commons Attribution 4.0 License.

The sensitivity of simulated aerosol climatic impact to domain size
using regional model (WRF-Chem v3.6)
Xiaodong Wang1 , Chun Zhao1,2,3 , Mingyue Xu1 , Qiuyan Du1 , Jianqiu Zheng1 , Yun Bi1 , Shengfu Lin1 , and Yali Luo4
1 School of Earth and Space Sciences, University of Science and Technology of China, Hefei, China
2 CAS   Center for Excellence in Comparative Planetology, University of Science and Technology of China, Hefei, China
3 Frontiers Science Center for Planetary Exploration and Emerging Technologies, University of Science

and Technology of China, Hefei, China
4 State Key Laboratory of Severe Weather, Chinese Academy of Meteorological Sciences, Beijing, China

Correspondence: Chun Zhao (chunzhao@ustc.edu.cn)

Received: 7 July 2021 – Discussion started: 11 August 2021
Revised: 17 November 2021 – Accepted: 2 December 2021 – Published: 12 January 2022

Abstract. Domain size can have significant impact on re-         size is one of the keys to simulating robust aerosol climatic
gional modeling results, but few studies examined the sen-       impact.
sitivities of simulated aerosol impact to regional domain
size. This study investigates the regional modeling sensitiv-
ities of aerosol impact on the East Asian summer monsoon
(EASM) to domain size. The simulations with two different        Highlights.
domain sizes demonstrate consistently that aerosols induce           1. Domain size has a great influence on the simulated meteoro-
the cooling of the lower troposphere that leads to the an-              logical fields and aerosol distribution during the East Asian
ticyclone circulation anomalies and thus the weakening of               summer monsoon (EASM).
EASM moisture transport. The aerosol-induced adjustment              2. Regional simulations with different domain sizes demonstrate
of monsoonal circulation results in an alternate increase and           consistently that aerosols weaken EASM moisture transport.
decrease pattern of precipitation over China. Domain size has        3. Different domain sizes result in different strengths of aerosol-
a great influence on the simulated meteorological fields. For           induced changes of temperature and thus circulation and rain-
example, the simulation with larger domain size produces                fall over China.
weaker EASM circulation, which also affects aerosol distri-
butions significantly. This leads to the difference of simu-
lated strength and area extent of aerosol-induced changes of     1     Introduction
lower-tropospheric temperature and pressure, which further
results in different distributions of circulation and precipi-   As one of the forcings of climate change, aerosols contribute
tation anomalies over China. For example, over southeast-        the largest uncertainty to the total radiative forcing estimate,
ern China, aerosols induce the increase (decrease) of pre-       and they have attracted more and more attention since the
cipitation from the smaller-domain (larger-domain) simula-       1980s (IPCC, 2013; Li et al., 2019). Aerosols can absorb and
tion. Different domain sizes consistently simulate an aerosol-   scatter solar radiation through aerosol–radiation interactions,
induced increase in precipitation around 30◦ N over eastern      affect the regional radiation budget, and amplify its impact
China. This study highlights the important influence of do-      through atmospheric mixing and circulation (e.g., Schwartz,
main size on regional modeling results of aerosol impact on      1996; Rinke et al., 2004; Kim et al., 2007; Z. Li et al., 2010;
circulation and precipitation, which may not be limited to       Zhao et al., 2011, 2012, 2014; Myhre et al., 2013; Kuniyal
East Asia. More generally, this study also implies that proper   and Guleria, 2019; Zhang et al., 2020). Serving as cloud con-
modeling of meteorological fields with appropriate domain        densation nuclei or ice nuclei, aerosols can change the mi-
                                                                 croscopic and macroscopic characteristics of clouds and af-

Published by Copernicus Publications on behalf of the European Geosciences Union.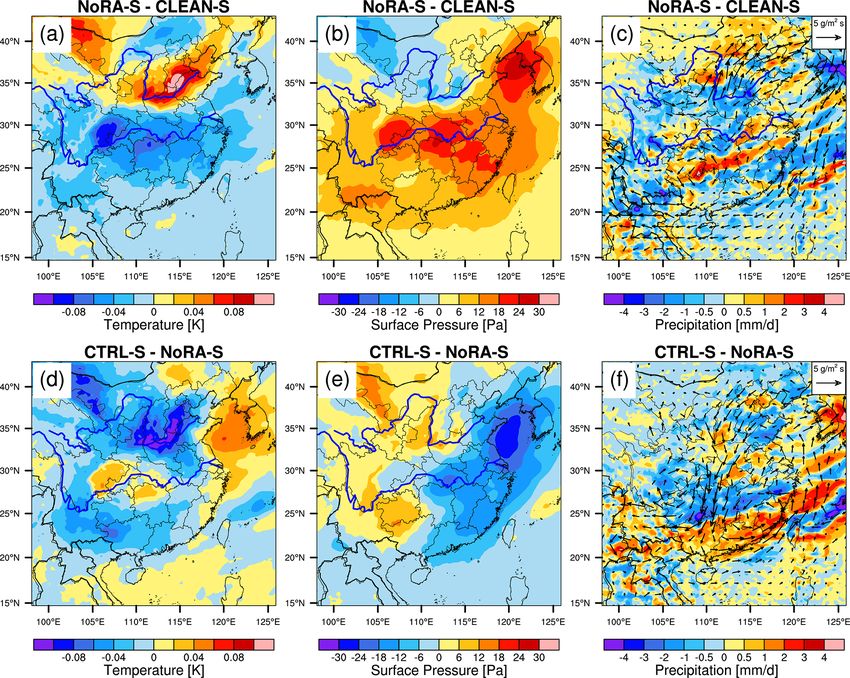
200                                    X. Wang et al.: The sensitivity of simulated aerosol climatic impact to domain size

fect the climate, which is called aerosol–cloud interactions      Model Intercomparison Program phase 5) modeling results,
(Twomey, 1977; Albrecht, 1989; Ackerman et al., 2000; Fan         Song et al. (2014) examined the contributions of different
et al., 2012, 2013, 2016). There are also some other possible     forcings (aerosol forcing, greenhouse gas forcing, and nat-
aerosol–cloud–precipitation interactions that may amplify or      ural forcing) to the weakening of EASM circulation during
dampen this effect (Rosenfeld et al., 2008, 2014; Tao et al.,     1958–2001. They found that aerosol forcing played a major
2012; Fan et al., 2015, 2018).                                    role.
   Due to the large population and the rapid economic de-            Global climate models have been widely used for inves-
velopment in last few decades, East Asia has encountered          tigating aerosol impact. However, there are still large un-
large aerosol loading and suffered from severe air pollution      certainties with the results at regional scale, partly because
caused by various emission sources (e.g., Chan and Yao,           it is still not possible to accurately describe the regional-
2008; X. Y. Zhang et al., 2012; Li et al., 2017; An et al.,       scale monsoon rainband and aerosol distributions with rel-
2019). Moreover, East Asia is within the monsoon region,          atively lower model horizontal resolution (H. M. Li et al.,
and its weather and climate systems are more complicated,         2010; Guo et al., 2013; Jiang et al., 2013; Song et al., 2014;
which makes the study of aerosol effects more challenging         Li et al., 2018; Dong et al., 2019). In comparison, regional
(Ding and Chan, 2005; Ding, 2007; Li et al., 2016, 2019;          models often have relatively higher horizontal resolution and
Wu et al., 2016). In recent decades, the East Asian summer        can better capture regional features of weather and climate
monsoon (EASM) and the associated precipitation in east-          systems and aerosol distributions, and therefore has been
ern China have shown strong inter-decadal changes (Ding et        used to investigate aerosol regional climatic impact recently
al., 2008, 2013; Zhou et al., 2009; Zhu et al., 2011; Zhang,      (e.g., Zhang et al., 2009; Stanelle et al., 2010; Zhao et al.,
2015), which has a significant impact on agriculture, econ-       2011, 2012; Wu et al., 2013; Wang et al., 2015; Crippa
omy, and human life (An et al., 2015). Many factors may           et al., 2017; Zhuang et al., 2018). For example, Crippa et
be related to the inter-decadal variability of the EASM, such     al. (2017) found that the enhanced resolution (from 60 to
as extraterrestrial natural forcing, internal dynamical feed-     12 km) can improve the regional model performance of me-
backs within the climate system, and changes in atmospheric       teorological fields and aerosol optical depth (AOD). Using
composition (e.g., greenhouse gases and aerosols) and sur-        the regional model (RegCCMS), Wang et al. (2015) found
face conditions (land cover change or urbanization) related       that aerosol–cloud interaction decreased the auto-conversion
to anthropogenic factors (Ding et al., 2008a, b; H. Li et al.,    rates of cloud water to rain water and increased the liquid
2010; Song and Zhou, 2014; Xiao and Duan, 2016; Jiang et          water path of clouds in eastern China, which further strength-
al., 2017). As one of the forcing factors, aerosols have at-      ened the cooling of the lower atmosphere caused by aerosol–
tracted many people to study their effect on the weather and      radiation interaction and suppressed the convective precipita-
climate of East Asia (Cowan and Cai, 2011; H. Zhang et al.,       tion. Wu et al. (2013), with the regional model (WRF-Chem),
2012; Guo et al., 2013; Jiang et al., 2013, 2017; Wu et al.,      found that the aerosol heating effect caused the cloud to move
2013; Song et al., 2014; Li et al., 2015, 2018; Wang et al.,      northward over eastern China and led to the increased precip-
2015, 2017; Chen et al., 2016; Kim et al., 2016; Xie et al.,      itation in the north.
2016; Dong et al., 2019).                                            Although regional models at higher horizontal resolution
   Numerous studies have used global climate models to            may better capture regional features of wind, cloud, precip-
study the impact of anthropogenic aerosols on the EASM cli-       itation, and aerosols, they also introduce additional uncer-
mate and understand the mechanisms underneath (e.g., Guo          tainties on modeling regional aerosol climatic impact result-
et al., 2013; Jiang et al., 2013, 2017; Song et al., 2014; Yan    ing from the lateral boundary conditions of regional simula-
et al., 2015; Chen et al., 2016; Wang et al., 2017; Li et al.,    tion. Previous studies have found that the domain size of the
2018; Dong et al., 2019). The global modeling results have        regional model could significantly influence the simulation
shown that aerosols tend to reduce the land–sea thermal con-      results (e.g., Warner et al., 1997; Leduc and Laprise, 2009;
trast, weaken the EASM, and thereby reduce the rainfall over      Leduc et al., 2011; Bhaskaran et al., 2012; Diaconescu et
China (e.g., Guo et al., 2013; Jiang et al., 2013; Song et al.,   al., 2013; Di Luca et al., 2015; Giorgi, 2019). For example,
2014; Wang et al., 2017; Li et al., 2018; Dong et al., 2019).     Bhaskaran et al. (2012) studied the sensitivity of the simu-
The reduction of monsoon precipitation over China may re-         lated hydrological cycle to the regional domain size over the
duce the release of latent heat from condensation in the upper    Indian subcontinent. They found that the simulations with
troposphere and further weaken the EASM (e.g., Jiang et al.,      smaller domains produced the increased precipitation and
2013; Li et al., 2019). Jiang et al. (2013) used the CAM5 (the    evapotranspiration on seasonal mean and the higher number
Community Atmospheric Model version 5) model to study             of moderate precipitation days relative to the ones with larger
the effect of different aerosol types on clouds and precip-       domains. Different distributions of cloud, precipitation, and
itation during the EASM and found that all anthropogenic          winds from the simulations with different domain sizes may
aerosols suppressed the precipitation in northern China and       lead to different aerosol distributions and the associated cli-
enhanced the precipitation in southern China and the adja-        matic impact. Previous studies have found that aerosol im-
cent ocean areas. Through analyzing the CMIP5 (Coupled            pact on precipitation, clouds, and circulation would be sig-

Geosci. Model Dev., 15, 199–218, 2022                                               https://doi.org/10.5194/gmd-15-199-2022
X. Wang et al.: The sensitivity of simulated aerosol climatic impact to domain size                                            201

nificantly different under different weather and climate con-      compound (VOC) emission, etc. (Zhao et al., 2013a, b, 2014,
ditions (e.g., Wu et al., 2013; Wang et al., 2015; Xie et          2016; Zhang et al., 2021; Hu et al., 2019; Du et al., 2020), all
al., 2016). In addition, Seth and Giorgi (1998) found that         of which may have important impacts on modeling aerosols
the smaller-domain simulation produced better precipitation        and their climatic impact.
when compared with the observations but resulted in an un-            The Model for Simulating Aerosol Interactions and Chem-
realistic response to the internal forcing. This indicates that    istry (MOSAIC) aerosol module coupled with the CBM-
the simulation domain size may also affect the aerosol impact      Z (carbon bond mechanism) photochemical mechanism in
on large-scale circulation. Therefore, the regional simulation     WRF-Chem is selected in this study (Zaveri and Peters,
with increased domain size may be preferable to reflect the        1999; Zaveri et al., 2008). MOSAIC uses a sectional ap-
overall aerosol impact on large-scale circulation and climate      proach to represent aerosol size distributions with four or
system without strict constraint from boundary forcing (e.g.,      eight discrete size bins in the current version of WRF-Chem
Seth and Giorgi, 1998; Leduc and Laprise, 2009; Xue et al.,        (Fast et al., 2006). To reduce the computational cost, four
2014), but the increased domain size may make the simula-          discrete size bins are selected in this study. All major aerosol
tion deviate from the forcing as in the reanalysis.                components including sulfate, nitrate, ammonium, black car-
   As far as we know, there are few studies examining the          bon, organic matter, sea salt, mineral dust, and other inor-
sensitivities of regional modeling results of aerosol impact       ganic matter (OIN) are simulated in the model. The MO-
to domain size. Although it can be expected that domain size       SAIC aerosol scheme includes physical and chemical pro-
will play a role, it is unknown to what extent and how domain      cesses of nucleation, condensation, coagulation, aqueous-
size can affect modeling results of aerosol climatic impact.       phase chemistry, and water uptake by aerosols. Dry depo-
Therefore, in this study, the regional online-coupled meteo-       sition of aerosol mass and number is simulated following
rology and chemistry model WRF-Chem (Weather Research              the approach of Binkowski and Shankar (1995), which in-
and Forecasting model coupled with Chemistry) (Grell et al.,       cludes both turbulent diffusion and gravitational settling. Wet
2005; Skamarock et al., 2008) is used to study the aerosol         removal of aerosols by grid-resolved stratiform clouds and
impact on the EASM system with the focus on the modeling           precipitation includes in-cloud removal (rainout) and below-
sensitivities to regional domain size. WRF-Chem has been           cloud removal (washout) by impaction and interception, fol-
widely used for studying aerosol meteorological and climatic       lowing Easter et al. (2004) and Chapman et al. (2009). In this
impact over East Asia (e.g., A. J. Ding et al., 2013; Wu et        study, cloud-ice-borne aerosols are not explicitly treated in
al., 2013; Gao et al., 2014; Chen et al., 2014; Zhao et al.,       the model, but the removal of aerosols by the droplet freezing
2014; Huang et al., 2016; Liu et al., 2016; Petäjä et al., 2016;   process is considered. Convective transport and wet removal
B. Zhao et al., 2017). The investigation of aerosol impact un-     of aerosols by cumulus clouds is coupled with the Kain–
der different simulated meteorological fields due to different     Fritsch cumulus scheme as in Zhao et al. (2013b). Aerosol ra-
domain sizes may also help understand the different mod-           diative feedback is coupled with the Rapid Radiative Transfer
eling results about the aerosol impact on EASM from pre-           Model (RRTMG) (Mlawer et al., 1997; Iacono et al., 2000)
vious studies. The study is organized as follows. Section 2        for both SW and LW radiation as implemented by Zhao et
describes the numerical experiments and methods. The re-           al. (2011). The optical properties and direct radiative forcing
sults and discussions are presented in Sect. 3. A summary is       of individual aerosol species in the atmosphere are diagnosed
provided in Sect. 4.                                               following the methodology described in Zhao et al. (2013a).

                                                                   2.2   Numerical experiments
2     Methodology
                                                                   Four sets of experiments, CTRL-L, CTRL-S, CLEAN-L, and
2.1    WRF-Chem                                                    CLEAN-S, with different simulation domain sizes or emis-
                                                                   sion configurations are conducted as explained and listed
In this study, the version of WRF-Chem updated by the Uni-         in Table 1. The control experiments (CTRL-S and CTRL-
versity of Science and Technology of China (USTC ver-              L) use a standard anthropogenic emission dataset (described
sion of WRF-Chem) is used. The model simulates the emis-           in Sect. 2.3), while the clean simulations (CLEAN-S and
sion, transport, mixing, and chemical transformation of trace      CLEAN-L) apply a factor of 0.1 on the standard emissions
gases and aerosols simultaneously with the meteorology, and        within the small domain to represent a clean atmosphere con-
can be used for investigation of regional-scale air quality        dition over East Asia (Fig. 1). The CTRL-L and CTRL-S
and interactions between meteorology and chemistry. Com-           (CLEAN-L and CLEAN-S) represent the simulations with
pared with the publicly released version, the USTC version         large and small domain sizes, respectively, as shown in
of WRF-Chem includes a few additional functions, such as           Fig. 1. The aerosol impact can be calculated by the difference
the diagnosis of radiative forcing of aerosol species, opti-       between the CTRL and CLEAN simulations for each simula-
mized Kain–Fritsch (KF) convection scheme, aerosol–snow            tion domain. The comparison of aerosol impact between the
interaction, land surface coupled biogenic volatile organic        large and small simulation domains implies the sensitivity of

https://doi.org/10.5194/gmd-15-199-2022                                                 Geosci. Model Dev., 15, 199–218, 2022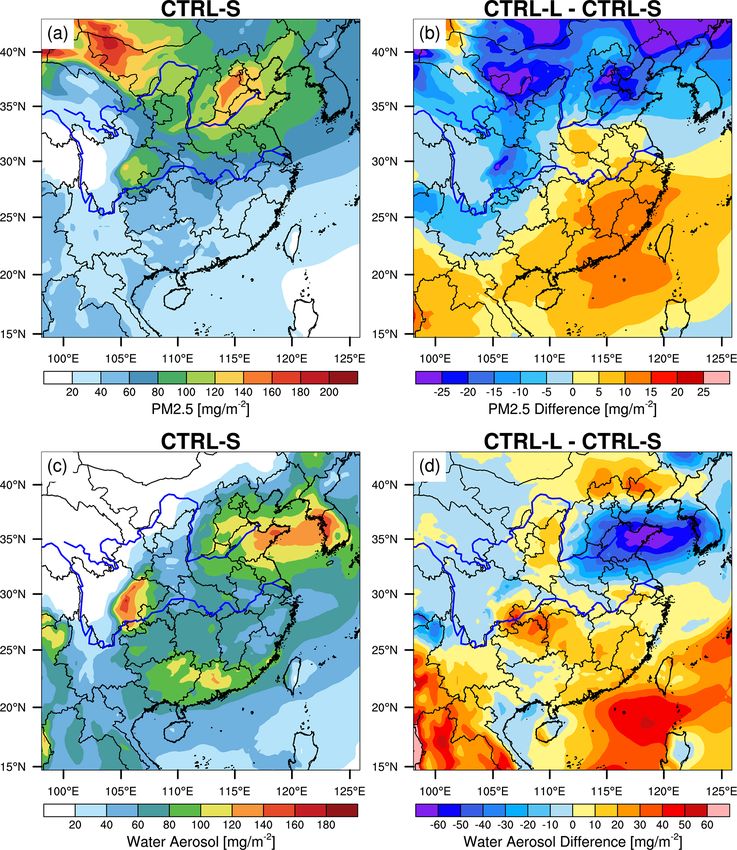
202                                    X. Wang et al.: The sensitivity of simulated aerosol climatic impact to domain size

aerosol impact to domain size. Besides these experiments,        invariant fragmentation of brittle materials derived by Kok
another set of experiments, NoRA-S, is conducted to isolate      (2011). More details about the dust emission scheme cou-
aerosol–radiation and aerosol–cloud interactions for further     pled with MOSAIC aerosol scheme in WRF-Chem can be
understanding the mechanisms of aerosol impact, which is         found in Zhao et al. (2010, 2013b). Sea-salt emission fol-
also listed in Table 1. The horizontal resolution of 30 km is    lows Zhao et al. (2013a), which includes the correction of
selected for both simulation domains with the consideration      particles with radius less than 0.2 µm and the dependence of
of the balance of computational efficiency and modeling per-     sea-salt emission on sea surface temperature. Anthropogenic
formance, particularly for the larger domain. The comparable     emissions are obtained from the Multi-resolution Emission
horizontal resolutions have also been widely used for investi-   Inventory for China (MEIC) at 0.1◦ × 0.1◦ horizontal res-
gating aerosol impact on regional climate (e.g., Zhang et al.,   olution and with monthly temporal resolution for 2015 (Li
2009; Stanelle et al., 2010; Zhao et al., 2011, 2012; Chen et    et al., 2017; Zheng et al., 2018), except that the emissions
al., 2014; Wang et al., 2015).                                   outside of China are from the Hemispheric Transport of Air
   All the WRF-Chem experiments select the Morrison two-         Pollution version 2 (HTAPv2) at 0.1◦ × 0.1◦ horizontal res-
moment microphysics (Morrison et al., 2009), Kain–Fritsch        olution and with monthly temporal resolution for the year
cumulus scheme (Kain, 2004), unified Noah land-surface           2010 (Janssens-Maenhout et al., 2015) (Fig. 1). As discussed
model, Rapid Radiative Transfer Model (RRTMG) longwave           above, the anthropogenic emission in the CLEAN experi-
and shortwave radiation schemes (Iacono et al., 2008), and       ments has a factor of 0.1 of that in the CTRL experiment. In
MYNN planetary boundary layer (PBL) scheme (Nakanishi            addition, in the CLEAN-L experiment, only the emissions in
and Niino, 2006, 2009). Following Du et al. (2020), the PBL      the small-domain area (denoted by the red box) are adjusted.
mixing coefficient is modified to simulate better PBL mix-       In this way, the emission reduction from the simulations with
ing of aerosols. Five ensemble simulations are performed for     both domains are made consistent.
each experiment by changing the simulation initial time at
00:00 UTC from 12 to 16 May 2017 (i.e., the five ensem-          2.4   Observations and reanalysis
ble simulations start at 00:00 UTC of 12, 13, 14, 15, and
16 May, respectively). The averaged results from five ensem-     Although the aims of this study do not include evaluating the
bles are analyzed to reduce the influence of modeling inter-     simulation results to determine the optimal model configu-
nal variability. The simulations run continuously through all    ration for the experiments, some observations and reanaly-
of June and July 2017. The analysis focuses on the simula-       sis datasets are still used to provide the references for the
tion results for 1 June to 31 July 2017. The meteorological      key fields. The comparison with these references can demon-
initial and lateral boundary conditions are derived from Na-     strate whether the simulation results are acceptable for fur-
tional Centers for Environmental Prediction (NCEP) Final         ther analysis. The MISR (Multi-angle Imaging SpectroRa-
(FNL) Operational Global Analysis data (NCEP, 2000) with         diometer, instrument on board the NASA Terra platform)
a horizontal resolution of 1◦ × 1◦ and a temporal resolution     retrieval dataset is used as a reference of spatial distribu-
of 6 h. The chemical initial and boundary conditions are pro-    tion of AOD (Diner et al., 1998; Martonchik et al., 2004).
vided by a quasi-global WRF-Chem simulation for the same         When showing the comparison between the MISR retrieved
time period. The quasi-global WRF-Chem simulation is per-        and the simulated AOD, the simulation results are sampled
formed at 1◦ × 1◦ horizontal resolution with 360 × 130 grid      from 10:00–11:00 local time (LT) for averaging and at the
cells (60◦ S–70◦ N, 180◦ W–180◦ E). More details about the       locations of the retrievals because the Terra platform passes
general configuration of a quasi-global WRF-Chem simula-         over the Equator at about 10:45 LT (Diner et al., 2001). The
tion can be found in Zhao et al. (2013b) and Hu et al. (2016).   precipitation datasets of CMA (National Meteorological In-
The simulation configuration is summarized in Table 2.           formation Center of China Meteorological Administration)
                                                                 and CMORPH (Climate Prediction Center MORPHing tech-
2.3   Emissions                                                  nique) are used as the references for spatial and tempo-
                                                                 ral variations of precipitation during the simulation period.
Biomass burning emissions are obtained from the Fire In-         The CMORPH dataset is a global precipitation reanalysis
ventory (FINN) of the National Center for Atmospheric            dataset that is derived from geostationary satellite IR im-
Research with hourly temporal resolution and 1 km hori-          agery (Joyce et al., 2004). The CMA rainfall was measured
zontal resolution (Wiedinmyer et al., 2011), and the injec-      by tipping buckets, self-recording siphon rain gauges, or au-
tion heights follow Dentener et al. (2006) for the Aerosol       tomatic rain gauges and was subject to strict quality control.
Comparison between Observations and Models (AeroCom)             The European Centre for Medium-Range Weather Forecasts
project. The natural dust emission fluxes are calculated based   (ECMWF) Reanalysis v5 (ERA5) is used as a reference for
on the adjusted GOCART dust emission scheme (Ginoux et           wind fields (Hersbach et al., 2020).
al., 2001; Zhao et al., 2010), and the emitted dust particles
are distributed into the MOSAIC aerosol size bins follow-
ing a theoretical expression based on the physics of scale-

Geosci. Model Dev., 15, 199–218, 2022                                             https://doi.org/10.5194/gmd-15-199-2022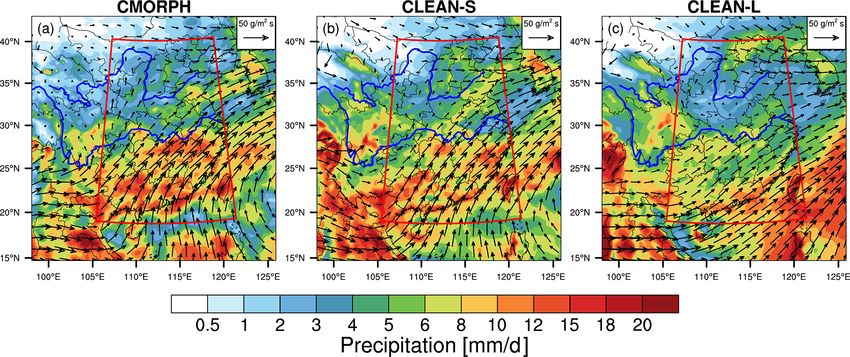
X. Wang et al.: The sensitivity of simulated aerosol climatic impact to domain size 203
Figure 1. Spatial distributions of anthropogenic emissions of primary PM2.5 averaged for June and July for the simulation domains. The red
box in the large simulation domain represents the small domain.
Table 1. Experiment description.
Experiment ID Experiment Description
CTRL-L Control experiment with large simulation domain.
CLEAN-L Similar to CTRL-L, but the anthropogenic aerosol emissions are 0.1 times of CTRL-L.
CTRL-S Control experiment with small simulation domain.
CLEAN-S Similar to CTRL-S, but the anthropogenic aerosol emissions are 0.1 times of CTRL-S.
NoRA-S Similar to CTRL-S, but with the aerosol–radiation interaction turned off.
Table 2. Summary of model configurations. 3 Results
Description Selection (L, S) 3.1 Sensitivity of simulated meteorological fields to
Horizontal grid spacing 30 km domain size
Grid dimensions 201 × 231, 121 × 121
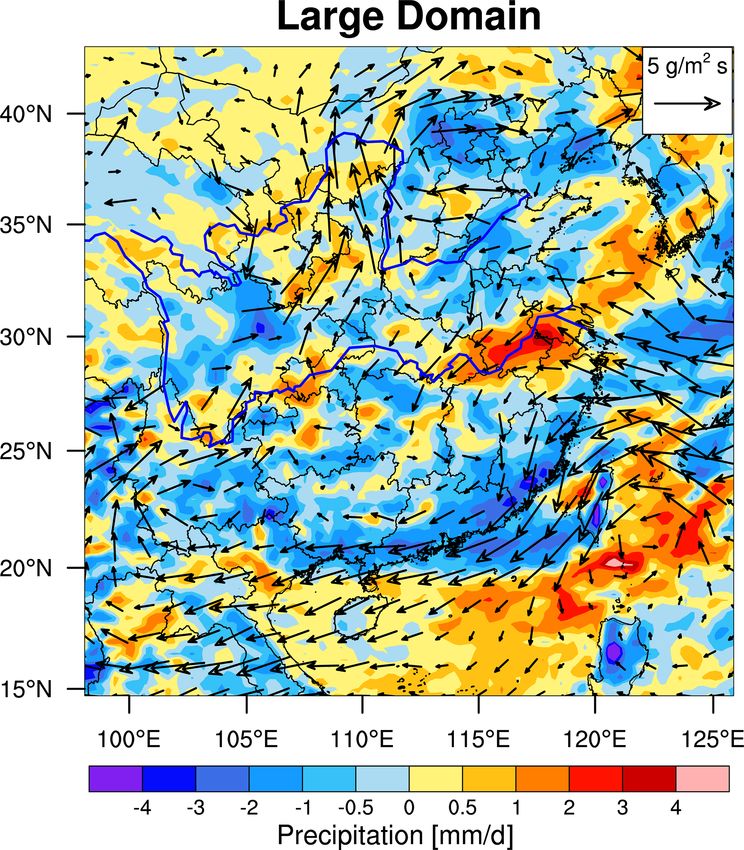
Vertical layers 41 Figure 2 shows the spatial distributions of precipitation and
Topography USGS_30s moisture transport at 700 hPa over the small domain averaged
Model top press 100 hPa for June and July 2017 from the observation and reanalysis,
Aerosol scheme MOSAIC 4 bin and the simulations of CLEAN-S and CLEAN-L. The obser-
Gas-phase chemistry CBM-Z vation and reanalysis show that the southwesterly transports
Longwave radiation RRTMG large amounts of moisture into eastern China. The conver-
Shortwave radiation RRTMG
gence of large amounts of moisture results in heavy precipi-
Cloud microphysics Morrison 2-moment
tation over southern China and its adjacent ocean. Due to the
Cumulus cloud Kain–Fritsch
Planetary boundary layer MYNN 3rd gradual weakening of northeastward moisture transport and
Land surface unified Noah land-surface model the blocking effect of western mountains, precipitation be-
Meteorological forcing FNL, 1◦ × 1◦ , 6 hourly comes much weaker over northern and western China. Com-
pared with the CMORPH observation and ERA5 reanalysis
(Fig. 2), CLEAN-S can reasonably produce the spatial dis-
tributions of precipitation and moisture transport at 700 hPa,
with slight underestimation of meridional moisture transport
over eastern China. It is evident that the meridional mois-
ture transport over southern China becomes weaker with
the increasing domain size, and the eastward transport be-
comes stronger. In addition, the overall southwesterly mois-
https://doi.org/10.5194/gmd-15-199-2022 Geosci. Model Dev., 15, 199–218, 2022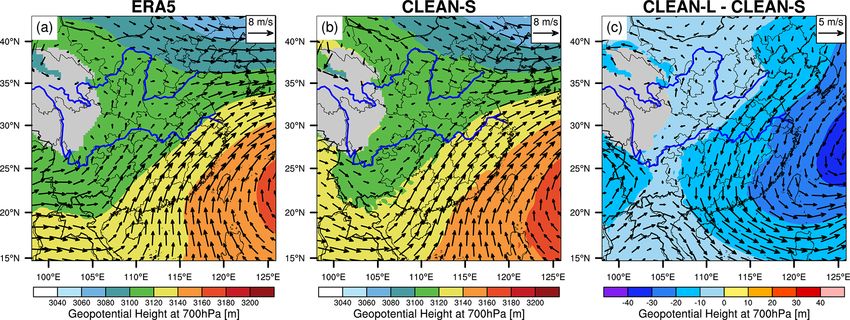
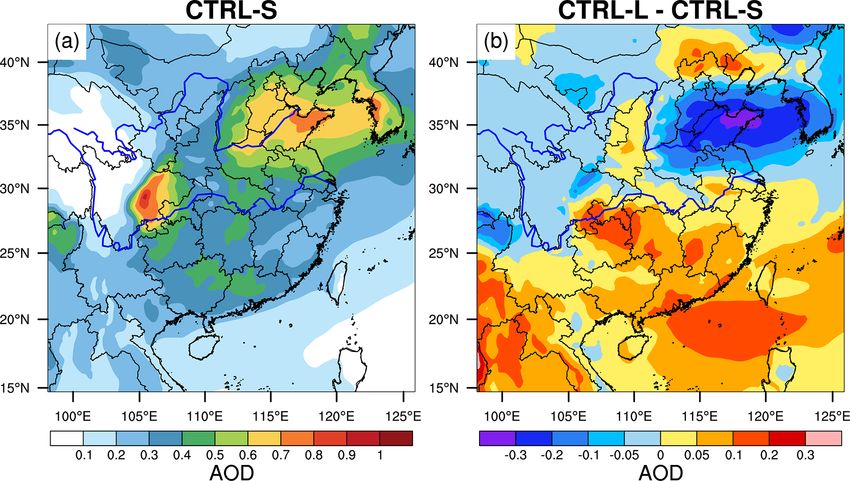
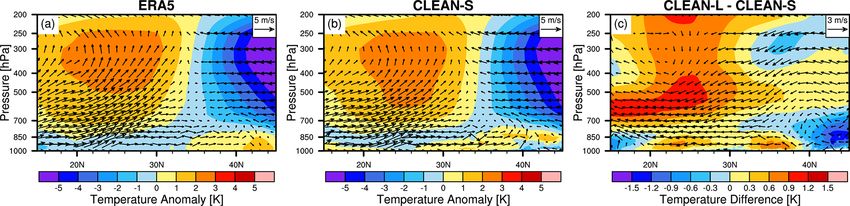
204                                      X. Wang et al.: The sensitivity of simulated aerosol climatic impact to domain size

ture transport shifts to the east. This leads to a decrease in      and the northerly wind is stronger. This results in an over-
precipitation over eastern China and an increase over the East      all northerly wind anomaly from CLEAN-L compared with
China Sea. Compared with the observations of hourly precip-         CLEAN-S, along with a southward shift of wind convergence
itation from the CMA stations over eastern China (Fig. S1 in        from 34 to 32◦ N. It is also noteworthy that the upward mo-
the Supplement), both the CLEAN-S and CLEAN-L experi-               tion is weakened around 22–38◦ N and strengthened to the
ments can generally reproduce the daily variation of precipi-       south of 20◦ N due to the increased domain size.
tation over eastern China, although the CLEAN-L simulated
precipitation is lower, consistent with its weaker moisture         3.2   Sensitivity of simulated aerosol characteristics to
transport over the region.                                                domain size
   The difference in moisture transport between the simu-
lations with different domain sizes results from their dif-         Figure 5 shows the spatial distributions of AOD averaged
ference in geopotential height and wind circulation. Fig-           for June and July of 2017 from the CTRL-S simulation, and
ure 3 shows the spatial distributions of geopotential height        of the difference between CTRL-L and CTRL-S. Relatively
(GPH) and wind field at 700 hPa from the ERA5 reanalysis            high AOD (> 0.6) exists in the Sichuan Basin and the north-
and the CLEAN-S simulation, and of the difference between           ern China plain. AOD over east-central China and southern
CLEAN-L and CLEAN-S. The comparison with the ERA5                   China is relatively lower (0.2–0.5), which is in line with pre-
reanalysis shows that the CLEAN-S can simulate well the             vious studies (e.g., Luo et al., 2014; Qi et al., 2013). In gen-
distributions of GPH and wind fields at 700 hPa. The spa-           eral, CTRL-S captures the spatial distribution of retrieved
tial distribution of wind fields is generally consistent with       AOD from MISR (Fig. S2 in the Supplement). Compared
that of moisture transport (Fig. 2) and is largely controlled       with the CTRL-S experiment, CTRL-L simulates a similar
by the West Pacific sub-tropical high (WPSH). Compared              spatial pattern of AOD but produces higher AOD in south-
to CLEAN-S, CLEAN-L simulates lower GPH at 700 hPa                  ern China and lower AOD in most areas of northern China.
and produces an anomalous lower pressure center on the              To explore the reasons of difference between the two sim-
East China Sea, which indicates the weaker WPSH with in-            ulations, Fig. 6 shows the spatial distributions of column-
creasing domain size. This causes the southwestward wind            integrated PM2.5 mass and water content in aerosols aver-
anomalies over China, which weakens the monsoon-driven              aged in June and July 2017 and of the difference between
northeastward moisture transport. Over the South China Sea,         CTRL-L and CTRL-S. The CTRL-S simulation shows high
the westerly anomalies enhance the eastward transport of            PM2.5 mass loading over the northern China plain, which is
moisture.                                                           consistent with the spatial distribution of AOD (Fig. 5). The
   The impact of domain size is not only on the horizontal          PM2.5 mass loading also shows high values over northwest-
distribution of wind fields but also on the vertical circulation.   ern China, which is not shown in the spatial distribution of
Figure 4 shows the cross section of meridional temperature          AOD. This is mainly due to the high mass loading of dust
anomalies and wind averaged for 105 and 122◦ E from the             over northwestern China (Fig. S3 in the Supplement), and
ERA5 reanalysis and the CLEAN-S simulation during June              the water content associated with dust is relatively small.
to July, and of the difference of temperature (not meridional          CTRL-L simulates higher PM2.5 mass loading over south-
temperature anomalies) and wind between CLEAN-L and                 eastern China and lower values over northern China, which
CLEAN-S. The meridional temperature anomalies are cal-              is consistent with AOD. The difference of water content in
culated by subtracting the mean temperature in this latitude        aerosols shows a similar pattern. The analysis shows that
range (as shown in Fig. 4) at each pressure level. First of all,    the difference of PM2.5 mass loading over northern China
CLEAN-S can generally reproduce the temperature gradient            is mainly due to the difference of dust, while the difference
and wind circulation from the ERA5 reanalysis. A relatively         over southeastern China is due to anthropogenic aerosols
large meridional temperature gradient exists between 700            (Fig. S3). The reduction of dust mass loading over north-
and 200 hPa, where the temperature is higher over the south.        ern China from CTRL-L is primarily due to its weakening
Below 700 hPa, the temperature gradient is relatively weaker        of westerlies over northwestern China compared to CTRL-
and the temperature is higher over the north. Along with this       S (Fig. 3), which results in less transport of dust into the
distribution of temperature gradient, meridional wind blows         downwind region. The increase in aerosol mass loading over
from the south and the north and converges at the latitude          southeastern China in CTRL-L is partly due to its less wet
around 34◦ N, which generates strong upward motion in the           scavenging associated with weak precipitation (Fig. 2). The
area of 20–35◦ N. This is consistent with the spatial distribu-     weakening of northward transport of aerosols (Fig. 3) also
tions of precipitation and moisture transport (Fig. 2). Com-        contributes to the increase in PM2.5 mass loading over south-
pared with the CLEAN-S experiment, the CLEAN-L exper-               ern China in CTRL-L. Besides the change of dry aerosol
iment produces larger meridional temperature gradient be-           mass loading, the change of water content in aerosols be-
tween 700 and 200 hPa and weaker gradient below 850 hPa.            tween the two experiments also contributes to the change in
The circulation from CLEAN-L is generally consistent with           AOD, which results from the difference of both dry aerosol
CLEAN-S, but the southerly wind from CLEAN-L is weaker              mass and moisture.

Geosci. Model Dev., 15, 199–218, 2022                                                 https://doi.org/10.5194/gmd-15-199-2022
X. Wang et al.: The sensitivity of simulated aerosol climatic impact to domain size                                                205

Figure 2. Mean precipitation rate (mm/day) and 700 hPa moisture transport (g/m2 s) over the small domain for the two months of June
and July 2017 from (a) CMORPH and ERA5 reanalysis, (b) CLEAN-S simulation, and (c) CLEAN-L simulation. The red box (20–42◦ N,
105–122◦ E) represents the focus area of analysis in follow. (a) Precipitation data come from CMORPH, and the 700 hPa moisture transport
field data are obtained by processing ERA5 reanalysis.

Figure 3. Spatial distributions of mean geopotential height and wind fields at 700 hPa of June and July 2017 from (a) ERA5, (b) CLEAN-S,
and (c) difference between CLEAN-L and CLEAN-S.

   Figure 7 shows the latitude–height cross section of to-            likely due to the difference in aerosol wet scavenging and
tal PM2.5 averaged between 105 and 122◦ E for June and                transport between the two experiments. The difference in
July 2017 from the CTRL-S experiment, and of the differ-              horizontal and vertical distributions of aerosols and also the
ence between CTRL-L and CTRL-S. The latitudinal distri-               circulation patterns between the two experiments may lead
bution of aerosols is consistent with its spatial pattern, with       to the difference in simulating aerosol impact on EASM.
high aerosol mass concentration over northern China. The
mass concentration gradually decreases from the surface to            3.3   Sensitivity of aerosol impact to domain size
the free atmosphere. The mass concentration around 500 hPa
over northern China can reach 5 µg/m3 that is comparable              Before studying the sensitivity of aerosol impact to domain
to the surface concentration over southern China. In general,         size, the impact of aerosols on precipitation and circula-
CTRL-L simulates higher aerosol mass concentration over               tion from the small-domain experiments is first investigated.
southern China and lower aerosol mass concentration over              Figure 8 shows the spatial distributions of aerosol-induced
northern China from the surface to about 500 hPa. At 32–              difference (CTRL-CLEAN) of precipitation and moisture
36◦ N, CTRL-L simulates lower aerosol mass concentration              transport at 700 hPa averaged for June and July 2017 from
near the surface and higher values between 700 and 850 hPa,           the small-domain simulations. The dominant effect is that

https://doi.org/10.5194/gmd-15-199-2022                                                     Geosci. Model Dev., 15, 199–218, 2022
206 X. Wang et al.: The sensitivity of simulated aerosol climatic impact to domain size
Figure 4. (a, b) The cross section of meridional temperature anomalies and wind averaged for 105 and 122◦ E from the ERA5 reanalysis
and the CLEAN-S simulation during June to July, and (c) the difference of temperature (not meridional temperature anomalies) between
CLEAN-L and CLEAN-S. The meridional temperature anomalies are calculated by subtracting the mean temperature in this latitude range
at each pressure level.
Figure 5. The spatial distributions of AOD for June and July 2017 from the CTRL-S simulation, and the difference between CTRL-L and
CTRL-S.
aerosols weaken the southwesterlies and reduces the mois- In order to further understand the mechanisms of aerosol
ture transport over central and southern China (primarily be- impact and isolate aerosol–radiation and aerosol–cloud inter-
tween 105–115◦ E). Along the coast of southeastern China, actions, another set of numerical experiments (NoRA-S) with
the moisture transport is enhanced slightly. Over China, the small domain is conducted, similar to CTRL-S but with
aerosols induce an alternate increase-and-decrease pattern the aerosol–radiation interaction turned off. The difference
(denoted as “+ − + − +”) of precipitation changes; i.e., pre- of results between NoRA-S and CLEAN-S (NoRA-S mi-
cipitation increases in the south of 25◦ N, north of 40◦ N, and nus CLEAN-S) is interpreted as the impact of aerosol–cloud
around 30◦ N, and decreases at 25–30 and 32–40◦ N. This interaction, while the difference of results between CTRL-
weakening of monsoonal circulation at the lower troposphere S and NoRA-S (CTRL-S minus NoRA-S) is interpreted as
is found mainly due to the cooling of the lower troposphere the impact of aerosol–radiation interaction. Figure 10 shows
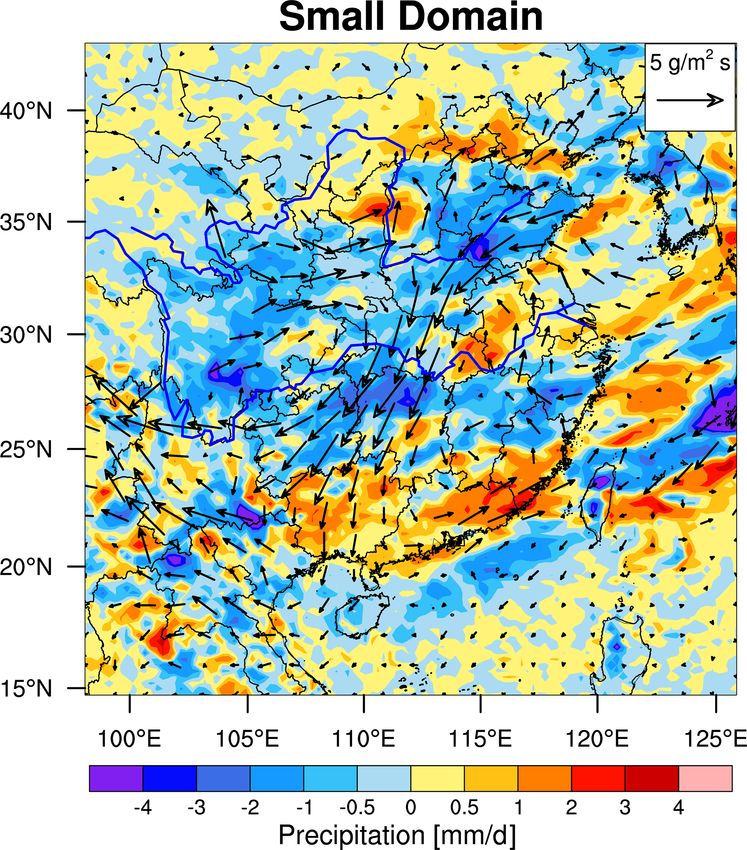
and thus the increase in surface pressure by aerosols (Fig. 9). the spatial distributions of the impact of aerosol–cloud and
The temperature averaged for the lower troposphere (below aerosol–radiation interactions on (a, d) tropospheric temper-
500 hPa) is reduced by aerosols over China, which results in ature averaged below 500 hPa, (b, e) surface pressure, and
a positive pressure anomaly center in southwestern China. (c, f) precipitation and moisture transport. The aerosol–cloud
This leads to an anticyclone anomaly as shown in Fig. 8, interaction significantly reduces the lower-tropospheric tem-
which weakens the monsoonal southwesterlies between 105– perature (Fig. 10a) over a large area of southern China (to the
115◦ E. south of 32◦ N) mainly due to its increase in cloud amounts
(Fig. S4a in the Supplement) over this area, which results in
Geosci. Model Dev., 15, 199–218, 2022 https://doi.org/10.5194/gmd-15-199-2022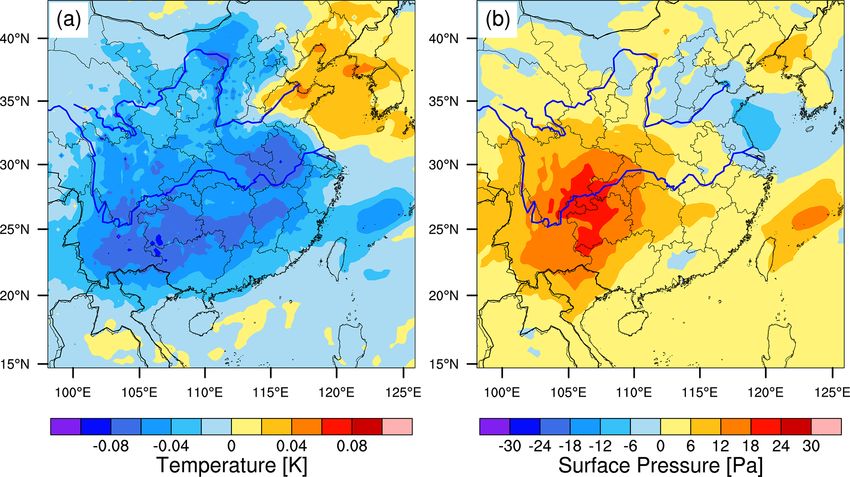
X. Wang et al.: The sensitivity of simulated aerosol climatic impact to domain size                                                  207

Figure 6. The spatial distributions of column integrated total (a) PM2.5 concentration and (c) water content in aerosols averaged for June
and July 2017 from the CTRL-S simulation, and (b, d) the difference between CTRL-L and CTRL-S.

Figure 7. The latitude–height cross section of (a) total PM2.5 averaged between 105 and 122◦ E for June and July 2017 from the CTRL-S
experiment, and (b) the difference between CTRL-L and CTRL-S.

https://doi.org/10.5194/gmd-15-199-2022                                                      Geosci. Model Dev., 15, 199–218, 2022
208 X. Wang et al.: The sensitivity of simulated aerosol climatic impact to domain size
anomalies over northern China, while the changes of circula-
tions in other areas of China are negligible.
The primary impact of aerosol–radiation interaction on
lower-atmospheric temperature is the positive temperature
anomaly over the Yellow Ocean and over central China and
the negative temperature anomaly over the Yellow River
Basin and southwestern China, which is the combined ef-
fect from the aerosol cooling and heating at the surface and
in the atmosphere, respectively, and the adjustment of cloud
distributions (Figs. S4b and S5). The two positive tempera-
ture anomaly centers lead to two negative pressure anomaly
centers and thus a large cyclone circulation anomaly over
the region of eastern China. Therefore, it can be noted that
the influence of aerosol–cloud and aerosol–radiation inter-
actions on monsoonal circulations is counteracted over the
ocean and over northern China, which results in relatively
small changes of monsoonal circulation over the ocean and
over northern China (Fig. 8). The overall aerosol impact is
shown as the weakening of the monsoonal circulation over
central and southern China (Fig. 8), which is mainly con-
tributed by the aerosol–radiation interaction.
Figure 11 shows the latitude–pressure cross section of
aerosol-induced difference (CTRL-CLEAN) of temperature
Figure 8. The spatial distributions of aerosol-induced difference
and wind averaged between 105 and 122◦ E for June and
(CTRL-CLEAN) of precipitation and moisture transport at 700 hPa
averaged for June and July 2017 from the small-domain simula-
July 2017 from the small-domain simulation. The pattern
tions. of precipitation change corresponds well to the change of
wind circulation. The weakening of monsoonal southwest-
erlies results in a sinking airflow anomaly around 28◦ N and
the compensating upward anomaly around 24◦ N in the south
an increase in surface pressure in this area (Fig. 10b). Simi- of China, and also a downdraft around 35◦ N and an up-
larly, aerosol–cloud interaction also increases cloud amounts draft around 40◦ N in northern China. These two sinking air-
over northeastern China and its adjacent ocean (Fig. S4a) flows correspond to the reduced precipitation between 25 and
and thus reduces the lower-tropospheric temperature and 30◦ N and between 32 and 40◦ N, respectively (Fig. 8), while
increases the surface pressure over the area. The surface these updrafts correspond to the increasing precipitation be-
pressure over the Yellow River Basin is reduced slightly tween 22 and 25◦ N and between 32 and 40◦ N. There is also
by aerosol–cloud interaction, which may be due to the re- weak upward compensating airflow around 30◦ N, leading to
duction of cloud amounts (Fig. S4a) and the increase in the slight increase in precipitation in the area (Fig. 8). It is
lower-tropospheric temperature. Although the experiments noteworthy that aerosols lead to an abnormal cooling cen-
can generally demonstrate that aerosol–cloud interaction can ter around 33◦ N between 400 and 200 hPa. This is mainly
largely affect cloud amount, lower-tropospheric temperature, because of less solar radiation entering the atmosphere due
and surface pressure, please note that the co-locations of the to aerosol–radiation and aerosol–cloud interactions, and also
changes of cloud, temperature, and surface pressure may not weaker monsoonal airflow that leads to less release of la-
be simply straightforward. For example, in a fully coupled tent heat from cloud and precipitation (Fig. S6 in the Sup-
system, the cloud change due to aerosols would also adjust plement). This cooling anomaly center also strengthens the
the temperature through the release of latent heat in the at- downdraft anomalies on both its sides, further weakening the
mosphere. In addition, the change of temperature would also monsoonal circulation.
modulate the circulation and further feedback to the distri- In order to explore the sensitivity of aerosol impact to do-
butions of cloud and temperature. The difference between main size, similar to Fig. 8, Fig. 12 shows the results from
NoRA-S and CLEAN-S over northwestern China is due to the large-domain simulations. One consistent signal between
the dust–radiation interaction that is included in CLEAN-S the simulations with different domain sizes is that aerosols
but not in NoRA-S. The analysis of this study focuses on weaken the southwesterlies and reduce the moisture trans-
the impact of anthropogenic aerosols. The combined effect port over central and southern China. The difference is that
of two anti-cyclone anomalies due to the two positive pres- this weakening is not only over the inland areas of China but
sure anomalies at the lower-troposphere results in the south- also extends to over the South China Sea. The weakening of
ward wind anomalies over the ocean and the northward wind monsoon airflow is broader with the increasing domain size,
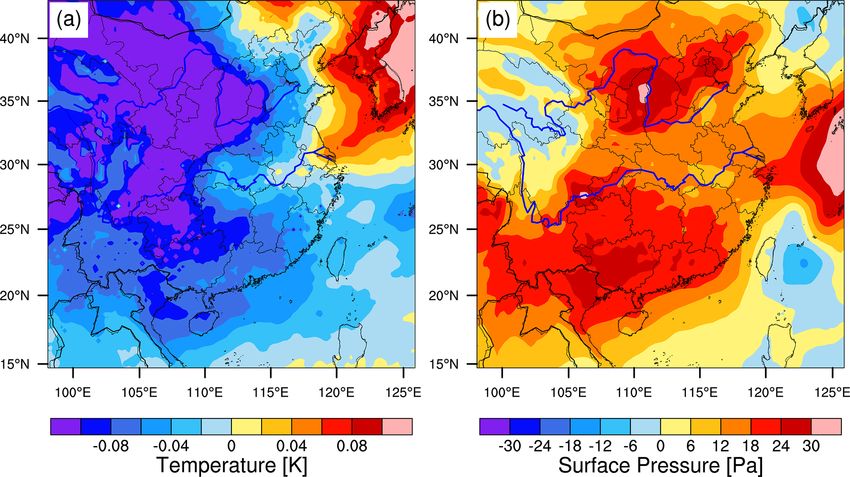
Geosci. Model Dev., 15, 199–218, 2022 https://doi.org/10.5194/gmd-15-199-2022X. Wang et al.: The sensitivity of simulated aerosol climatic impact to domain size 209 Figure 9. The spatial distributions of aerosol-induced difference (CTRL-CLEAN) of (a) atmosphere temperature below 500 hPa and (b) sur- face pressure averaged for June and July 2017 from the small-domain simulations. Atmospheric temperature is weight-averaged by the layer thickness below 500 hPa. Figure 10. The spatial distributions of aerosol–cloud interactions induced difference of (a) atmosphere temperature below 500 hPa, (b) sur- face pressure and (c) precipitation and moisture transport at 700 hPa averaged for June and July 2017 from the small-domain simulations. And the spatial distributions of aerosol–radiation interactions induced difference of (d) atmosphere temperature below 500 hPa, (e) surface pressure, and (f) precipitation and moisture transport at 700 hPa averaged for June and July of 2017 from the small-domain simulations. https://doi.org/10.5194/gmd-15-199-2022 Geosci. Model Dev., 15, 199–218, 2022
210                                      X. Wang et al.: The sensitivity of simulated aerosol climatic impact to domain size

Figure 11. The latitude-pressure cross section of aerosol-induced
difference (CTRL-CLEAN) of temperature and wind averaged be-
tween 105 and 122◦ E for June and July 2017 from the small-
domain simulation.

which may be due to its weaker monsoon airflow (Fig. 3)
and less constraint from the lateral boundary conditions in         Figure 12. The same as Fig. 8, but from the large-domain simula-
                                                                    tion.
the large-domain simulation. Another consistent signal be-
tween the two sets of simulations with different domain sizes
is that aerosols induce a similar “+ − + − +” pattern of pre-       small-domain simulation is split into two centers, one around
cipitation changes over the domain, except that the areas with      30◦ N at 250 hPa and another around 36◦ N at 700 hPa. The
precipitation reduction become broader. This leads to the pre-      weakening of the background circulation and broader cool-
cipitation reduction over almost the entire region between          ing area lead to the broader sinking airflow over the region,
20–40◦ N over China except the area around 30◦ N with in-           which results in the broader area of reduced precipitation
creasing precipitation. The increases in precipitation on the       compared with the small-domain simulation (Figs. 8 and 12).
two sides of the precipitation reduction area shift southward       The increasing precipitation around 30◦ N also resulted from
to the South China Sea and northward to the north of 40◦ N,         the compensating updraft around 30◦ N.
respectively.
   Similar to the small-domain simulation, the weakening of
monsoonal airflow in the large-domain simulation is also due        4   Summary and discussion
to the abnormal positive lower-level pressure that is caused
by the lower-tropospheric cooling (Fig. 13), which can also         Due to the importance of domain size on regional model-
be explained by the effects of aerosol–radiation and aerosol–       ing results and few studies that examined the sensitivities of
cloud interactions (Figs. S7 and S8 in the Supplement). How-        regional modeling results of aerosol impact to domain size,
ever, compared with the small-domain simulation (Fig. 9),           this study applies the WRF-Chem model to simulate the an-
the cooling anomaly of lower-tropospheric temperature and           thropogenic aerosol impact on EASM circulation and pre-
thus the positive anomaly of lower-level pressure covers a          cipitation, focusing on the modeling sensitivities to regional
broader area from the large-domain simulation. The two              domain size. The influence of domain size on meteorological
aerosol-induced cooling centers over China lead to two posi-        fields, aerosol characteristics, and aerosol impact is investi-
tive lower-level pressure anomaly centers that result in a large    gated.
anti-cycle circulation anomaly (Fig. 12), which weakens the            First of all, the domain size has a great influence on
monsoonal southwesterly airflow over southern China and             the simulated meteorological fields. From the smaller do-
the South China Sea and also slightly enhances the south-           main simulation, the circulation and precipitation are in good
westerly over western China. Again, the pattern of precipi-         agreement with the reanalysis data and observations. The
tation change corresponds well to the change of wind circu-         larger domain simulation produces a weaker and southward-
lation (Fig. 14). With larger domain size, aerosols lead to a       shifting EASM system, which results in the precipitation de-
broader area (between 20–40◦ N) of abnormal cooling in the          creasing in southern China and increasing in the adjacent
troposphere up to 200 hPa. The single cooling center in the         ocean. The changes of circulation and precipitation also lead

Geosci. Model Dev., 15, 199–218, 2022                                                 https://doi.org/10.5194/gmd-15-199-2022
X. Wang et al.: The sensitivity of simulated aerosol climatic impact to domain size 211
Figure 13. Same as Fig. 9, but from the large-domain simulation.
Figure 14. Same as Fig. 11, but from the large-domain simulation.
to the increase in aerosol mass loading in southern China and
the decrease in northern China in the larger domain simula- Figure 15. The schematic plot of aerosol impact in the (a) small-
tion. The deviation of atmospheric fields, particularly the cir- domain simulation and (b) large-domain simulation over East Asia.
culation between the simulations with different domains, is The light blue shadow area represents the extent of the aerosol-
partly due to their different constraint from lateral boundary induced decrease in lower tropospheric temperature and increase in
surface pressure. The red (blue) vector dash lines represent updraft
conditions. With fewer constraints of boundary forcing, the
(downdraft) anomalies. The “+” (“−”) above the region indicates
larger domain simulation may produce negative bias in pre- the aerosol-induced increase (decrease) in precipitation.
cipitation over the Yangtze River Basin and positive bias in
moisture transport over the South China Sea as reported by
previous studies. The uncertainties in moisture transport pre-
scribed in the lateral boundary conditions from the reanal- action between the atmosphere and the ocean (i.e., with pre-
ysis over a larger domain may also contribute to the biases scribed SST from the reanalysis), the artificial positive feed-
(e.g., Wang and Yang, 2008; Huang and Gao, 2018). Previ- back between precipitation and surface latent heat flux may
ous studies found that, with a larger simulation domain in- overestimate the precipitation over the subtropical Western
cluding more areas of ocean, without considering the inter- North Pacific (WNP) and inhibit the westward expansion of
https://doi.org/10.5194/gmd-15-199-2022 Geosci. Model Dev., 15, 199–218, 2022212 X. Wang et al.: The sensitivity of simulated aerosol climatic impact to domain size
the WNP subtropical high (e.g., Cha and Lee, 2009; Lee and lateral boundary condition may also have stronger constraint
Cha, 2020). on aerosol feedbacks to large-scale circulation. Therefore,
In terms of the climatic impact of anthropogenic aerosols unlike meteorological fields or aerosol properties, there is no
on EASM, as shown in the schematic figure (Fig. 15), direct observation or reanalysis that can be used as the refer-
aerosols induce the cooling of the lower troposphere over ences to evaluate aerosol impact (Di Luca et al., 2015; Crippa
China through aerosol–radiation and aerosol–cloud interac- et al., 2017), and it is difficult to determine the optimal con-
tions, which leads to an increase in regional pressure in the figuration of the simulation domain in this study. It may
lower atmosphere. The regional positive pressure anoma- be the key to improve the simulated meteorological fields
lies result in the anti-cyclone circulation anomalies and with larger regional domains or global domains in order to
thus weaken the summer monsoonal northeastward moisture model robust aerosol climatic impact. More generally, this
transport, which is consistent with previous studies (e.g., Y. study also highlights the impact of background meteorolog-
Q. Jiang et al., 2013; Song et al., 2014; T. Wang et al., 2015; ical fields (without aerosol effect) on simulated aerosol im-
Xie et al., 2016). The weakening of monsoonal circulation pact. Proper modeling of background meteorological fields
leads to several sinking airflows and compensating updrafts is one of the keys to simulate reliable aerosol climatic im-
that correspond well to the regions with the decrease and in- pact. The model inter-comparison study of aerosol climatic
crease in precipitation, respectively, showing a spatial pat- impact should also focus on the diversity of simulated back-
tern of “+ − + − +” for precipitation change. The differ- ground meteorological fields besides aerosol characteristics.
ence in aerosol impact from the numerical experiments with
different domain sizes is mainly determined by their differ-
ent simulated strengths and the area extent of the aerosol- Code and data availability. The release version of WRF-Chem
induced lower-tropospheric negative temperature anomalies. can be downloaded from http://www2.mmm.ucar.edu/wrf/users/
Compared with the smaller-domain simulation, the larger- download/get_source.html (last access: January 2022, Grell et
domain simulation with weaker monsoonal circulation gen- al., 2005). The code of updated USTC version of WRF-Chem
is available at https://doi.org/10.5281/zenodo.4663508 (Zhao and
erates a broader area with negative temperature and positive
Zhang, 2021) or contact chunzhao@ustc.edu.cn. The dataset
pressure anomalies in the lower troposphere, which results
from the European Centre for Medium-Range Weather Fore-
in broader sinking airflows and thus broader areas of precip- casts (ECMWF) Reanalysis v5 (ERA5) can be downloaded from
itation reduction over China. This could lead to the opposite https://rda.ucar.edu/datasets/ds633.1/ (last access: August 2021,
signals of precipitation change due to aerosols over China. Hersbach et al., 2018). The CMORPH data can be downloaded
For example, over southeastern China, the precipitation in- from https://ftp.cpc.ncep.noaa.gov/precip/CMORPH_V1.0/CRT/0.
creased (decreased) in the smaller-domain (larger-domain) 25deg-DLY_00Z/2017/ (last access: August 2021, Xie et al., 2019).
simulation. The consistent signal of aerosol impact between
the simulations with different domain sizes is the increasing
precipitation around 30◦ N that resulted from the compensat- Supplement. The supplement related to this article is available on-
ing updraft over the region. line at: https://doi.org/10.5194/gmd-15-199-2022-supplement.
Although the modeling results of aerosol impact in this
study may have some uncertainties associated with physi-
cal and chemical processes, emissions, and horizontal res- Author contributions. XW and CZ designed the experiments and
olutions (e.g., Di Luca et al., 2015; Crippa et al., 2019), it conducted and analyzed the simulations. All authors contributed to
the discussion and final version of the paper.
highlights the impact of simulation domain size on regional
modeling aerosol impact on monsoonal circulation and pre-
cipitation, which may not be limited to the region of East
Competing interests. The contact author has declared that neither
Asia. Uncertainties in modeling aerosol climatic impact are they nor their co-authors have any competing interests.
often investigated with the focus on aerosol characteristics
such as their distributions and properties. This study adds an-
other layer of complexity (impact of domain size) to regional Disclaimer. Publisher’s note: Copernicus Publications remains
modeling of aerosol climatic impact. More specifically, on neutral with regard to jurisdictional claims in published maps and
the one hand, larger-domain simulation may allow better institutional affiliations.
aerosol feedbacks on weather and climate systems without
strong lateral boundary constraints (e.g., Seth and Giorgi,
1998; Leduc and Laprise, 2009; Diaconescu et al., 2013), Acknowledgements. The study used the computing resources from
but it may produce biased meteorological fields compared to the High-Performance Computing Center of University of Science
smaller-domain simulation, which can then significantly in- and Technology of China (USTC) and the TH-2 of National Super-
fluence the modeling results of aerosol impact. On the other computer Center in Guangzhou (NSCC-GZ).
hand, although the simulation with smaller domain produces
better large-scale circulation compared to the reanalysis, the
Geosci. Model Dev., 15, 199–218, 2022 https://doi.org/10.5194/gmd-15-199-2022X. Wang et al.: The sensitivity of simulated aerosol climatic impact to domain size 213
Financial support. This research was supported by the Chen, J. P., Chen, I. J., and Tsai, I. C.: Dynamic Feedback of
National Basic Research Program of China (grant no. Aerosol Effects on the East Asian Summer Monsoon, J. Climate,
2018YFC1507400),National Natural Science Foundation of 29, 6137-6149, https://doi.org/10.1175/Jcli-D-15-0758.1, 2016.
China (grant nos. 42061134009, 41775146, 91837310), the USTC Chen, S., Zhao, C., Qian, Y., Leung, L. R., Huang, J.,
Research Funds of the Double First-Class Initiative (grant no. Huang, Z., Bi, J., Zhang, W., Shi, J., and Yang, L.: Re-
YD2080002007), Fundamental Research Funds for the Central gional modeling of dust mass balance and radiative forcing
Universities (grant no. WK2080000101), and the Strategic Priority over East Asia using WRF-Chem, Aeolian Res., 15, 15–30,
Research Program of Chinese Academy of Sciences (grant no. https://doi.org/10.1016/j.aeolia.2014.02.001, 2014.
XDB41000000). Cowan, T. and Cai, W.: The impact of Asian and non-
Asian anthropogenic aerosols on 20th century Asian
summer monsoon, Geophys. Res. Lett., 38, L11703,
Review statement. This paper was edited by Axel Lauer and re- https://doi.org/10.1029/2011gl047268, 2011.
viewed by two anonymous referees. Crippa, P., Sullivan, R. C., Thota, A., and Pryor, S. C.: The impact of
resolution on meteorological, chemical and aerosol properties in
regional simulations with WRF-Chem, Atmos. Chem. Phys., 17,
1511–1528, https://doi.org/10.5194/acp-17-1511-2017, 2017.
Crippa, P., Sullivan, R. C., Thota, A., and Pryor, S. C.: Sensitiv-
ity of simulated aerosol properties over eastern North America
References to WRF-Chem parameterizations, J. Geophys. Res.-Atmos., 124,
3365–3383, https://doi.org/10.1029/2018JD029900, 2019.
Ackerman, A. S., Toon, O. B., Stevens, D. E., Heyms- Davies, T.: Lateral boundary conditions for limited
field, A. J., Ramanathan, V., and Welton, E. J.: Reduc- area models, Q. J. Roy. Meteor. Soc., 140, 185–196,
tion of tropical cloudiness by soot, Science, 288, 1042–1047, https://doi.org/10.1002/qj.2127, 2014.
https://doi.org/10.1126/science.288.5468.1042, 2018. Dentener, F., Kinne, S., Bond, T., Boucher, O., Cofala, J., Gen-
Albrecht, B. A.: Aerosols, Cloud Microphysics, and eroso, S., Ginoux, P., Gong, S., Hoelzemann, J. J., Ito, A.,
Fractional Cloudiness, Science, 245, 1227–1230, Marelli, L., Penner, J. E., Putaud, J.-P., Textor, C., Schulz, M.,
https://doi.org/10.1126/science.245.4923.1227, 1989. van der Werf, G. R., and Wilson, J.: Emissions of primary
An, Z. S., Wu, G. X., Li, J. P., Sun, Y. B., Liu, Y. M., Zhou, W. aerosol and precursor gases in the years 2000 and 1750 pre-
J., Cai, Y., Duan, A., Li, L., Mao, J., Cheng, H., Shi, Z., Tan, scribed data-sets for AeroCom, Atmos. Chem. Phys., 6, 4321–
L, Yan, H., Ao, H., Chang, H., and Feng, J.: Global Monsoon 4344, https://doi.org/10.5194/acp-6-4321-2006, 2006.
Dynamics and Climate Change, Annu. Rev. Earth Pl. Sc., 43, 29– Diaconescu, E. and Laprise, R.: Can added value be expected in
77, https://doi.org/10.1146/annurev-earth-060313-054623, 2015. RCM-simulated large scales?, Clim. Dynam., 41, 1769–1800,
An, Z., Huang, R.-J., Zhang, R., Tie, X., Li, G., Cao, J., Zhou, https://doi.org/10.1007/s00382-012-1649-9, 2013.
W., Shi, Z., Han, Y., and Gu, Z.: Severe haze in north- Di Luca, A., de Elía, R., and Laprise, R.: Challenges in
ern China: A synergy of anthropogenic emissions and atmo- the Quest for Added Value of Regional Climate Dynam-
spheric processes, P. Natl. Acad. Sci. USA, 116, 8657–8666, ical Downscaling, Curr. Clim. Change Rep., 1, 10–21,
https://doi.org/10.1073/pnas.1900125116, 2019. https://doi.org/10.1007/s40641-015-0003-9, 2015.
Bhaskaran, B., Ramachandran, A., Jones, R., and Moufouma- Diner, D. J., Beckert, J. C., Reilly, T. H., Bruegge, C. J.,
Okia, W.: Regional climate model applications on sub-regional Conel, J. E., Kahn, R. A., Martonchik, J. V., Ackerman,
scales over the Indian monsoon region: The role of domain T. P., Davies, R., and Gerstl, S. A.: Multi-angle Imaging
size on downscaling uncertainty, J. Geophys. Res.-Atmos., 117, SpectroRadiometer (MISR) instrument description and exper-
D10113, https://doi.org/10.1029/2012jd017956, 2012. iment overview, IEEE T. Geosci. Remote S., 36, 1072–1087,
Binkowski, F. S. and Shankar, U.: The Regional Partic- https://doi.org/10.1109/36.700992, 1998.
ulate Matter Model .1. Model description and prelimi- Diner, D., Abdou, W., Bruegge, C., Conel, J., Crean, K., Gaitley, B.,
nary results, J. Geophys. Res.-Atmos., 100, 26191–26209, Helmlinger, M., Kahn, R., Martonchik, J., and Pilorz, S.: MISR
https://doi.org/10.1029/95jd02093, 1995. aerosol optical depth retrievals over southern Africa during the
Cha, D. H. and Lee, D. K.: Reduction of systematic errors in re- SAFARI-2000 dry season campaign, Geophys. Res. Lett., 28,
gional climate simulations of the summer monsoon over East 3127–3130, https://doi.org/10.1029/2001gl013188, 2001.
Asia and the western North Pacific by applying the spec- Ding, A. J., Fu, C. B., Yang, X. Q., Sun, J. N., Petäjä, T., Kerminen,
tral nudging technique, J. Geophys. Res.-Atmos., 114, 14108, V.-M., Wang, T., Xie, Y., Herrmann, E., Zheng, L. F., Nie, W.,
https://doi.org/10.1029/2008jd011176, 2009. Liu, Q., Wei, X. L., and Kulmala, M.: Intense atmospheric pol-
Chan, C. K. and Yao, X.: Air pollution in mega lution modifies weather: a case of mixed biomass burning with
cities in China, Atmos. Environ., 42, 1–42, fossil fuel combustion pollution in eastern China, Atmos. Chem.
https://doi.org/10.1016/j.atmosenv.2007.09.003, 2008. Phys., 13, 10545–10554, https://doi.org/10.5194/acp-13-10545-
Chapman, E. G., Gustafson Jr., W. I., Easter, R. C., Barnard, 2013, 2013.
J. C., Ghan, S. J., Pekour, M. S., and Fast, J. D.: Coupling Ding, Y., Sun, Y., Liu, Y., Si, D., Wang, Z., Zhu, Y., Liu,
aerosol-cloud-radiative processes in the WRF-Chem model: In- Y., Song, Y., and Zhang, J.: Interdecadal and Interannual
vestigating the radiative impact of elevated point sources, At- Variabilities of the Asian Summer Monsoon and Its Projec-
mos. Chem. Phys., 9, 945–964, https://doi.org/10.5194/acp-9-
945-2009, 2009.
https://doi.org/10.5194/gmd-15-199-2022 Geosci. Model Dev., 15, 199–218, 2022You can also read