The significant impact of shape deviations of atmospheric aerosols on light monitoring networks
←
→
Page content transcription
If your browser does not render page correctly, please read the page content below
MNRAS 512, 1805–1813 (2022)                                                                                            https://doi.org/10.1093/mnras/stac548
Advance Access publication 2022 February 28

The significant impact of shape deviations of atmospheric aerosols on light
monitoring networks
Ladislav Kómar,1 ‹ Stefan Wallner                    1,2 ‹
                                                              and Miroslav Kocifaj1,3
1 ICA,Slovak Academy of Sciences, Dubravska cesta 9, 84503 Bratislava, Slovakia
2 Department  of Astrophysics, University of Vienna, Türkenschanzstraße 17, A-1180 Wien, Austria
3 Faculty of Mathematics, Physics, and Informatics, Comenius University, Mlynská dolina, 84248 Bratislava, Slovakia

Accepted 2022 February 21. Received 2022 February 17; in original form 2022 January 7

                                                                                                                                                               Downloaded from https://academic.oup.com/mnras/article/512/2/1805/6539341 by guest on 27 June 2022
ABSTRACT
Aerosol particles are important modulators of night sky brightness (NSB) due to their manifold impacts on spectral and angular
properties of scattered light. The majority of radiative transfer models currently in use are based on rigorous Mie theory
for spherical homogeneous particles. This fundamental concept enables significant simplifications in theoretical formulae and
numerical modelling. However, as known from many studies, spherical shapes are rare for both natural and anthropogenic
aerosols. Therefore, the aim of this paper is to analyse the potential magnitude of the subsequent effect in skyglow modelling
assuming that the aerosol particles are of different aspect ratios. The zero-order approximation to tackle the problem is to
characterize the non-sphericity by the ratio of the largest to smallest size of an ellipsoidal particle. We use T-matrix formalism
to perform light scattering calculations on spheroidal particles of arbitrary size, composition, and orientation in respect to
the incident light. Results indicate that the particle-shape impact on NSB can be of significant size leading to both positive
and negative amplitudes around the zenith. In the most extreme case, an increase of up to 70 per cent in zenithal luminance
was displayed. As a consequence, especially light monitoring devices like the sky quality meter, usually measuring the NSB
around the zenith, are particularly influenced by this effect. In summary, the paper underlines both the importance of treating
non-spherical aerosols in theoretical modelling of skyglow and also the significance of including atmospheric parameters to
analyses of light monitoring networks.
Key words: radiative transfer – scattering – atmospheric effects – light pollution – methods: numerical.

                                                                                 decent accuracy (Cinzano 2007; Posch, Binder & Puschnig 2018).
1 I N T RO D U C T I O N
                                                                                 Ground-based long-term analyses rely on such data, whereas it was
The phenomenon of light pollution caused by artificial light at night            found that either due to the device itself, showing ageing effects and
(ALAN) is a global issue causing threats for wildlife, environment,              a weakened spectral sensitivity (Sánchez de Miguel et al. 2017; Bará
and human health as a great number of studies in the past have shown             et al. 2021; Puschnig et al. 2021), or variable surface properties at
(e.g. Rich & Longcore 2006; Falchi et al. 2011). The consequence                 its observational location (Wallner & Kocifaj 2019), results must be
of overilluminated and misdirected light is visible and measurable               analysed with considerable care.
significantly as the night sky brightness (NSB) increases potentially               However, it has been demonstrated in numerous computational
many times over its natural value, especially at urban areas (Falchi             studies (Garstang 1991; Joseph, Kaufman & Mekler 1991; Kocifaj
et al. 2016). With an annual growth of 1.8 per cent of total radiance            2007; Aubé 2015; Kocifaj & Kómar 2016) and field experiments
as quantified by Kyba et al. (2017), the issue is not only constituting          (Cinzano & Elvidge 2004; Kocifaj 2014; Bará, Lima & Zamorano
an increasingly critical matter for interdisciplinary research, also it          2019; Kolláth & Kolláth 2020) that the NSB underlies strong linkages
poses the risk of the daily astronomical work becoming more and                  with the atmospheric turbidity – a property that is typically related
more severely restricted. Consequently, it is of great importance to             to the optical attenuation by particles comparable to or larger than
keep track of the exact development of the state regarding the night             the wavelength (λ). The optical attenuation in the uniform sphere
sky being affected by ALAN. In order to do so, there is a variety                can be computed using the conventional Mie theory. Since Mie
of instruments for ground-based observations with the possibility                scattering dominates the angular distribution of scattered light under
of connecting them into remote sensing light monitoring networks                 high aerosol rates, it is widely used and benefits from its exact
(Hänel et al. 2018). Globally, the most common instruments for                  mathematical formulation and fine numerical convergence. Although
such networks are Sky Quality Meters (SQMs), which are one-                      strictly applicable to spherical bodies of arbitrary radius (r), its
dimensional photometric devices, measuring the zenithal NSB with                 probability distribution mimics its real-life counterpart qualitatively
                                                                                 well, with exceptions at large scattering angles (ranging from a
                                                                                 side scatter region to a backscatter zone) and particles with size
   E-mail: ladislav.komar@savba.sk (LK); stefan.wallner@univie.ac.at (SW)       parameters (x = 2πr/λ) comparable to the first maximum of the

© The Author(s) 2022.
Published by Oxford University Press on behalf of Royal Astronomical Society. This is an Open Access article distributed under the terms of the Creative
Commons Attribution License (https://creativecommons.org/licenses/by/4.0/), which permits unrestricted reuse, distribution, and reproduction in any medium,
provided the original work is properly cited.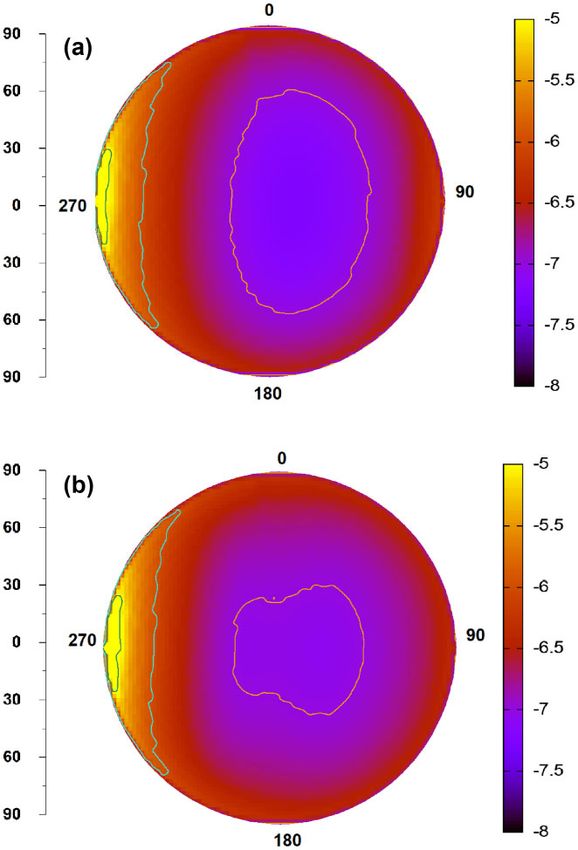
1806        L. Kómar, S. Wallner and M. Kocifaj
scattering efficiency factor. It follows that depending on material
composition, scattering features of spherical particles can differ
substantially from volume-equivalent irregular particles (van de
Hulst 1957), both showing complex scattering patterns. This forms
fundamental importance for atmospheric examinations since neither
natural nor anthropogenic particles are of spherical shapes (Kocifaj
et al. 2006; Munoz˜    & Hovenier 2011; Nousiainen et al. 2012).
Furthermore, resonance features typically present in spherical par-
ticles are suppressed efficiently in irregularly shaped particles, such
as dust grains. Consequently, peak amplitudes seen in scattering
diagrams become less pronounced as the particle shape tends to
deviate from an idealized sphere (Mishchenko, Travis & Lacis 2002).
To be taken into consideration, a ripple structure of the scattering
phase function partly or completely disappears when transitioning

                                                                                                                                                     Downloaded from https://academic.oup.com/mnras/article/512/2/1805/6539341 by guest on 27 June 2022
from a monodisperse system of spherical homogeneous particles to
a polydisperse population of randomly oriented irregular particles.                Figure 1. Typical shapes of oblate and prolate spheroids.
With this in mind, a well-designed flexible analytical representation
for scattering phase function can resolve an apparent contradiction        of sizes, aspect ratios, and complex refractive indices (Mishchenko
between Mie’s oscillatory forms and smooth scattering patterns             et al. 1997). This method is one of the most efficient and widely used
typically observed in nature. Among many empirical approaches,             techniques to calculate the scattering characteristics of randomly
the Henyey–Greenstein formula (Braak et al. 2001) demonstrates             oriented non-spherical particles. We use extended-precision floating-
great potential to mimic a wide range of scattering signatures from        point variables and the LU-factorization-based matrix inversion
various families of atmospheric aerosols and thus be a particularly        procedure to determine T-matrix elements. This allows for modelling
good candidate to study skyglow effects in different atmospheric           a wide range of particle sizes – compared to, e.g., separation of
conditions (Aubé & Kocifaj 2012).                                         variables method (Farafonov, Voshchinnikov & Somsikov 1996;
   Morphology-induced shaping of light scattering patterns is a driv-      Voshchinnikov 1996). However, the good convergence is achieved
ing force to perform a thorough investigation of its potential effect on   only for a limited range of size parameters, while the convergence rate
NSB. In this work, we quantify and interpret a potential uncertainty       strongly depends on the spheroid aspect ratio and can significantly
of zenith brightness due to aerosol morphology imperfections. A            decrease with increasing refractive index. The numerical solution
special focus is placed on the impact on light monitoring networks         may become numerically unstable even for oblate spheroids with
and the influence of adopted shape deviations on their observations.       a refractive index of n = 1.311 and ε = 2 when size parameters
We show that light scattering from a population of randomly oriented       x = 2πr/λ are as large as 90 or more (Mishchenko & Travis 1994b,
spheroids can simulate the flat form of the scattering phase function      1998). This is an acceptable constraint, bearing in mind that particles
at side scattering. This feature is typical for a much wider class of      larger than 0.001 and smaller than 20 μm represent an absolute major-
particle shapes (Ulanowski et al. 2006; Nousiainen et al. 2012); thus,     ity of particulate matter in the atmospheric environment and that the
our study may be of more general value.                                    modelling is performed for visible wavelengths (380–780 nm). In our
                                                                           case, the extended-precision T-matrix method converges well to the
                                                                           specified error tolerance for all mineral particles with r = 6.0 μm
2 C O M P U TAT I O N A L M O D E L                                        and ε < 2.0 typically found in urban atmospheres, including, e.g.,
                                                                           partially absorbing dust with a refractive index of 1.55 + 0.008i. For
2.1 Theoretical basis                                                      x exceeding 90◦ , the scattering matrix elements and efficiency factors
Aerosol particles in the atmosphere appear to have a great variety of      for extinction (Qext ), absorption (Qabs ), and scattering (Qsca ) are
shapes. As a consequence, it is generally difficult or rather impossible   computed from Mie theory, which allows for very rapid modelling,
to characterize realistic morphologies within a single generalized         while the computed optical properties differ from the true solution
particle model. Moreover, no exact analytical tools aiming to com-         within a few per cent.
pute the optical properties of arbitrarily shaped particles exist yet.        Among the optical parameters computed, the scattering phase
The present solvers are still CPU and MEM intensive and therefore          function, P(θ), is a key element in light scattering theories as
non-efficient in performing mass computations on various particle          it describes the angular distribution of scattered light at an arbi-
shapes in order to generate a vast data base of optical properties         trary altitude. For a polydisperse system of homogeneous particles
for assessing their potential impacts on NSB. A simplistic approach        characterized by the radius r, the scattering phase function is an
in which randomly oriented particles of complex morphology are             integral product of Mie scattering function S11 and the number size
replaced with volume-equivalent spheroids has been found to be a           distribution f(r):
useful concept explaining a wide range of optical effects observed in                            ∞
                                                                                         4π
a number of particulate media (Mishchenko & Travis 1994a).                 P (θ) = 2                 f (r )S11 (r , θ)dr ,                     (1)
                                                                                     k AODsca 0
   Spheroids are a kind of rotational ellipsoids, being distinguishable
between oblate (rotation about the minor axis) and prolate spheroids       with P(θ) satisfying the following normalization condition:
(rotation about the major axis). The shape of a spheroid can be                               π
specified by the aspect ratio ε = a/b and the radius of a sphere r.            P (θ)d = 2π        P (θ)sinθdθ = 4π                            (2)
                                                                            4π                  0
The aspect ratio ε > 1 matches up to oblate spheroids, ε < 1 for
prolate spheroids (see Fig. 1), and ε = 1 for spheres.                     and AODsca being the scattering aerosol optical depth
                                                                                       ∞
   The electromagnetic scattering from spheroids can be described
by the T-matrix method, providing an exact solution for a wide range       AODsca = π      r 2 f (r )Qsca (r , θ)dr .                          (3)
                                                                                          0

MNRAS 512, 1805–1813 (2022)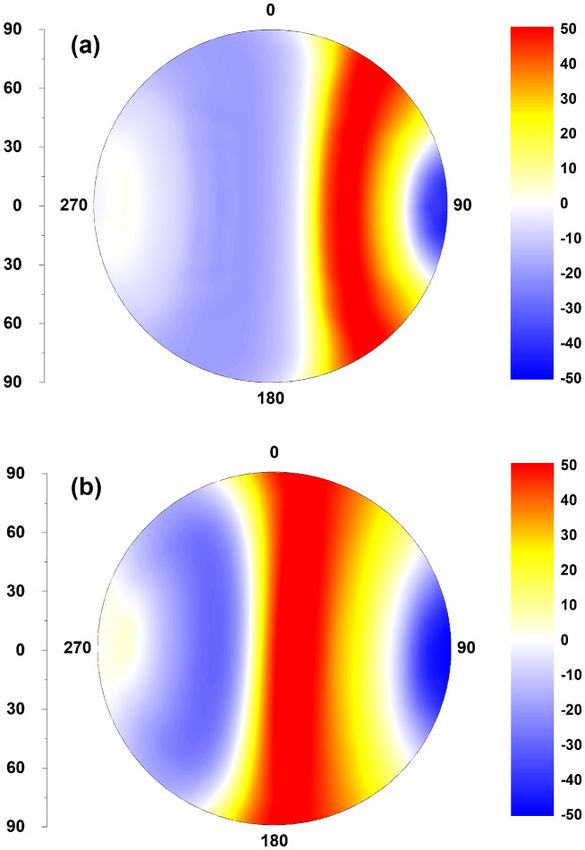
Aerosol shapes impacting night sky brightness                         1807

                                                                                                                                                         Downloaded from https://academic.oup.com/mnras/article/512/2/1805/6539341 by guest on 27 June 2022
                                                                            Figure 3. Relative, theoretical sensitivity of the SQM as included to the
                                                                            computations for monitoring network applications.

       Figure 2. Lognormal distribution of studied aerosol model.
                                                                            photometric devices measuring the NSB at the zenith with a full
                                                                            width at half-maximum (FWHM) of 20◦ . As discussed by Cinzano
In equation (1), k = 2π/λ is the wavenumber. Analogously to
                                                                            (2005, 2007), its theoretical relative sensitivity should reflect the
AODsca , a similar formula applies to the absorption aerosol optical
                                                                            photopic sensitivity of the naked eye as illustrated in Fig. 3. In-situ
depth AODabs :
              ∞                                                            measurements, like provided by Sánchez de Miguel et al. (2017),
                                                                            seem to indicate some discrepancies to the theoretical sensitivity.
AODabs = π        r 2 f (r )Qabs (r , θ )dr .                    (4)
               0                                                            However, since devices themselves can be varying in their exact
The total AOD is a sum of AODsca and AODabs .                               receptivity and also due to the fact that the sensitivity is kept constant
   Computations are performed on prolate spheroids composed of              while focusing on particle-shape impacts, the theoretical curve as
silicates, which are are well representative for dust with a refractive     illustrated was chosen to be included for further investigations.
index of n = 1.5 − i0.0077. We considered aspect ratios a/b of 2.0             In order to analyse the impacts of varying aerosol shapes on
and 1.5 for spheroids, while a/b = 1 for an idealized sphere.               measurements provided by SQM devices characterizing light moni-
   Aerosol systems in polluted urban areas usually appear to have           toring networks in general, both the FWHM and the relative spectral
monomodal or bimodal distributions f(r). A bimodal distribution             sensitivity will be applied to simulated observations.
introduces an additional degree of freedom in modelling, making
impacts on radiance caused solely by particle morphology variations
difficult or even impossible to identify. Consequently, we use a            3 M O D E L L I N G R E S U LT S
monomodal distribution since it significantly simplifies the analysis
and enables the reducing of results to illustrate potential effects from    3.1 The impact of aerosol shapes on NSB
particle-shape imperfections only. This is what optimally meets a           Since the phase shifts of an electromagnetic wave in a non-spherical
need for our study. Lognormal distributions are characterized by the        particle and the volume-equivalent sphere may differ considerably,
peak (modal) radius rm and a standard deviation σ . For an urban            the scattered light field around both particles may manifest in
atmosphere, we use rm = 0.5 μm and σ = 1.09527 (see Fig. 2):                different properties. The differences are expected to comprise in
                                                                          angular distribution and magnitudes of scattered light – both having
         B          (ln r − ln rm )2
f (r) = exp −                          ,                              (5)   a direct impact on NSB. In the following, we demonstrate these
          r               2σ 2
                                                                            effects in a few examples.
where r is the particle radius. The scaling parameter B is linearly            The theoretical NSB distribution is modelled for a circular city,
proportional to the concentration of aerosol particles and AOD as           assuming a hypothetical observer is one city diameter westwards
well.                                                                       from the city edge, i.e. the city is located at an azimuth of 270◦
   The phase function and AOD are calculated from the T-matrix              (Fig. 4). The NSB is due to a superposition of light beams emitted
method, which is embedded into Skyglow Simulator (Kocifaj 2014).            and scattered to a wide range of angles; thus, sky radiance patterns
The numerical demonstrations are for high-pressure sodium lumi-             for spherical (Fig. 4A) and prolate ellipsoidal particles (Fig. 4B,
naires distributed roughly uniformly over the urbanized area of Žilina     ε = 2.0) do differ only slightly. Shape-induced impacts on the NSB
– a city in Slovak Republic with approximately 80 000 inhabitants           are mostly located at large scattering angles, i.e. near the zenith and
and 5 km diameter. A hypothetical observer is located one city              in sky elements opposite to the azimuthal position of the city. This
diameter eastwards the city edge.                                           falls well within the range of angles for which the scattering phase
                                                                            function exhibits the largest sensitivity to the particle morphology
                                                                            (Fig. 5).
2.2 Application to SQM-monitoring networks
                                                                               Figs 6 and 7 illustrate the relative magnitude of net changes in
Globally, the majority of monitoring networks are built up using            the NSB (in per cent) for an atmosphere contaminated by ellipsoidal
SQM devices by Unihedron. Currently used SQMs (specifically                 aerosols with a/b = 1.5 (Figs 6A and 7A) and a/b = 2.0 (Figs 6B
SQM-LE devices for remote sensing networks) are one-dimensional             and 7B) and an atmosphere containing volume-equivalent spheres.

                                                                                                                 MNRAS 512, 1805–1813 (2022)
1808         L. Kómar, S. Wallner and M. Kocifaj

                                                                                                                                                               Downloaded from https://academic.oup.com/mnras/article/512/2/1805/6539341 by guest on 27 June 2022
Figure 4. Sky radiance distribution computed for the visible spectrum           Figure 6. Relative difference in the NSB distributions (in per cent) as
assuming AOD = 0.4 at the reference wavelength of 500 nm and with               computed for a population of spherical particles and for two models of
Ångström exponent of 1.3: (A) the model of spherical particles, (B) the        spheroidal particles: (A) a/b = 1.5 and (B) a/b = 2.0. The graphs formatting
volume-equivalent spheroids of aspect ratio a/b = 2.0. The radiance unit        is as in Fig. 4, while AOD = 0.2.
in the legend is given in W m−2 sr−1 , while the plot is on log-scale. For
both figures, azimuth is measured in the clockwise direction (north is at the   The relative difference is computed as below:
top). The zenith and horizon are in the centre and at the edge of each plot,
respectively.                                                                           R ellipsoid (z, A) − R sphere (z, A)
                                                                                RD =                                         × 100,                     (6)
                                                                                                     R sphere (z, A)
                                                                                where R(z, A) is the radiance for zenith angle z and azimuth angle
                                                                                A. Fig. 6 is for moderate atmospheric pollution (AOD = 0.2), while
                                                                                Fig. 7 is for elevated air pollution (AOD = 0.4).
                                                                                   As seen from results, the NSB signatures for non-spherical
                                                                                particles deviate from those for idealized spheres. However, the
                                                                                changes to NSB are neither monotonic nor uniform over the sky. In
                                                                                a heavily polluted atmosphere, dominated by the particles of aspect
                                                                                ratio a/b = 1.5, the most significant changes to NSB are found
                                                                                at large angular distances from the light source, typically in dark
                                                                                sky areas (Fig. 7A). This is dissimilar to the optical behaviour of
                                                                                even more elongated particles, which tend to preferably intensify the
                                                                                brightness specifically around the zenith (Fig. 7B). Such a finding is
                                                                                consistent with light scattering theories as studied before (see Plate
                                                                                10.7b in Mishchenko et al. 2002). The scattering angles change as
                                                                                the distance to the city increases; thus, the peak impacts on NSB
                                                                                from the scattering phase function may shift towards other angles.
                                                                                   Such previously undisclosed peculiarities in NSB having a relation
                                                                                to particle morphologies may potentially result in misinterpretation
Figure 5. Normalized phase function of spheroidal particles of three aspect     of SQM measurements or misconception in further development of
ratios for AOD = 0.4.                                                           NSB forecasting tools, as seen in more detail below in Section 3.4.

MNRAS 512, 1805–1813 (2022)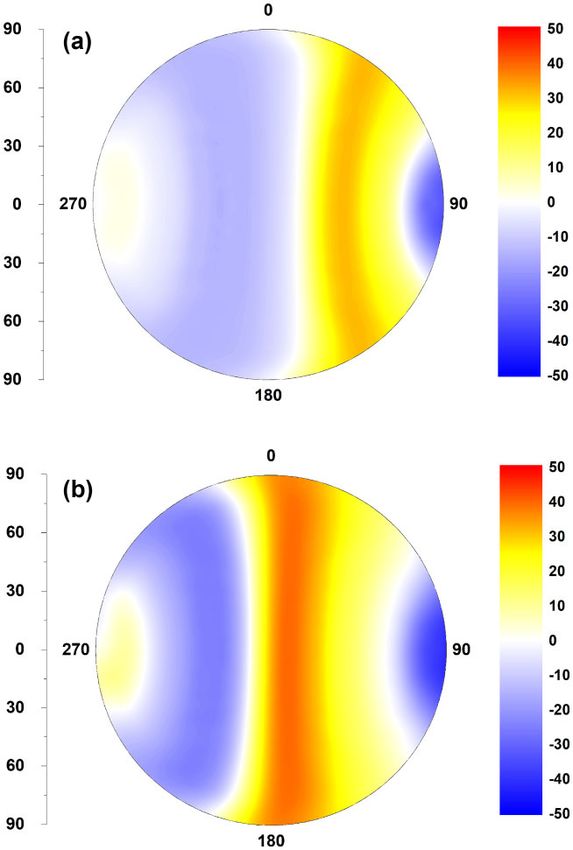
Aerosol shapes impacting night sky brightness                              1809

                                                                                                                                                             Downloaded from https://academic.oup.com/mnras/article/512/2/1805/6539341 by guest on 27 June 2022
                                                                           Figure 8. Broad-band radiance (500–580 nm) computed as a function of
                                                                           zenith angle for two uplight fractions (F = 0.05 and 0.15). Other input
                                                                           parameters are considered as in the previous plots, except that the radiance is
                                                                           now exclusively computed for a vertical plane crossing the zenith and source
                                                                           of light on horizon. Zenith angles are positive towards the source of light and
                                                                           negative at the side opposite to the light source. Three aspect ratios a/b are
                                                                           analysed.

                                                                           concentration are independent of locality. Unlike a varying mass
                                                                           concentration, particles transported by the wind may also differ
                                                                           in size distributions and chemical compositions, meaning that their
                                                                           impact on NSB in different wavelengths is not necessarily the same
                                                                           as what we may expect from a linear increase of particle volume
                                                                           concentration.
          Figure 7. The same as in Fig. 6 but for AOD = 0.4.

                                                                           3.2 Varying uplight fractions
However, compared to spherical particles, non-spherical ones may
produce a significant increase of zenith radiance (up to + 50 per cent)    The contribution of source emissions to NSB is weighted by the
or a rapid decrease of NSB in more distant sky areas (typically            scattering phase function, which strongly depends on the angle
in azimuths opposite to the light source). NSB differences around          contained by the direction of beam propagation and line of sight
the position of the light source have origin in a specific relation        – otherwise called the scattering angle. An angular distribution of
between incident and scattered field amplitudes and the fact that          ground-reflected light usually differs substantially compared to direct
a non-spherical particle typically provides a larger projection area       emission upwards. For the first case, we most frequently use a model
compared to a volume-equivalent sphere. It follows from light              of Lambertian radiator; however, the direct emission upwards shows
scattering theories (consult the optical theorem in equation 3.24          higher asymmetry with lobed shape depending on the distribution
in Bohren & Huffman 1983) that the optical cross-section is pro-           and properties of light-emitting urban elements. Due to its arbitrary
portional to the amplitude scattering matrix elements S1 and S2 in         form, the light output pattern may impact NSB in different manners.
the forward direction. Therefore, arbitrary shape perturbation causes      A detailed analysis of the effects being expected from each specific
the projection area of a non-spherical particle to differ from that of     light emission would be a time-consuming work, which, nevertheless,
spherical particles. Scattered intensities differ for the same reason.     does not provide a high significance for the purpose of this work.
To be more specific, a misunderstanding that NSB amplification             The main intention is to understand the magnitude of potential
can also occur due to an influx of non-spherical particles into the        changes to NSB emerging from different particle shapes dispersed
local atmosphere can be interpreted mistakenly in terms of partially       over an urban area illuminated by well and partially shielded light
increased volume concentration of aerosol particles. Associated            sources. Consequently, this kind of analysis is easily realizable with
consequences to the characterization of light pollution are potentially    Garstang’s model, which scales the direct emissions upwards through
significant. Particle shapes can change with, e.g., wind direction         a parameter F called the uplight fraction. We use F = 0.05 for
as the pollution sources in close surroundings may produce the             modernized lighting, and F = 0.15 for moderate uplight fractions.
particles of different shapes. For instance, biomass burning products         Replacing poorly shielded lights by street light retrofits of higher
may preferably contain carbonaceous elements, while agricultural           quality usually is accompanied with a lowering of direct emissions
activities are associated with lifting the soil particles into the lower   upwards. We model such transitioning by lowering the uplight
atmospheric layer. These particles differ in composition and shapes        fraction from F = 0.15 to 0.05. Fig. 8 illustrates that the impact
and are specific for the locality where the modelling/measurement          derived from the particle shape on broad-band radiance (500–
is conducted. On the other hand, the changes in the particle mass          580 nm) is negligible around the position of the light source and

                                                                                                                   MNRAS 512, 1805–1813 (2022)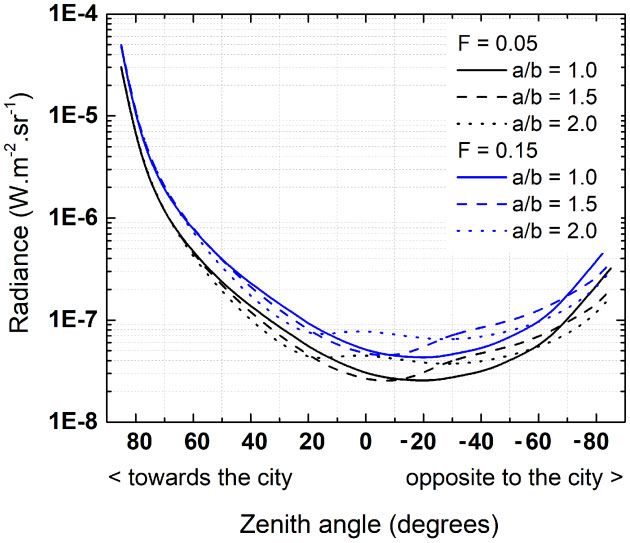
1810 L. Kómar, S. Wallner and M. Kocifaj
gradually increases as the angular distance to the source increases.
The peak distinctions between radiance values are found near the
zenith (compare black and blue lines for all aspect ratios evaluated).
In general, light-emitting urban structures with higher values of F
brighten the night sky further, while elongated particles can increase
the zenith brightness even more by tens of per cent compared to
volume-equivalent spheres. A relative increase of non-spherical
atmospheric aerosol loading is therefore particularly annoying for
professional astronomy since high-quality observations are typically
conducted at high elevation angles. Non-spherical particles may
dominate in dry environments, such as deserts, but can also appear
as a product of industrial activity. Particles tend to be hydrophilic
(accept water rather than repel) and become more spherical in humid
environments.
Downloaded from https://academic.oup.com/mnras/article/512/2/1805/6539341 by guest on 27 June 2022
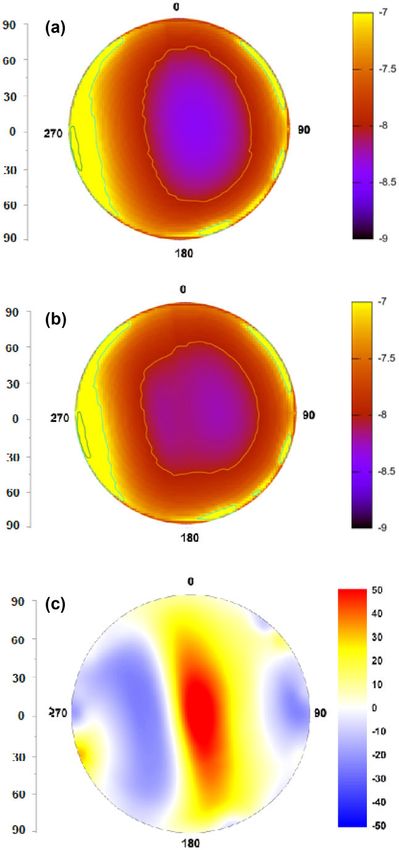
In the majority of field experiments, data are recorded in a het-
erogeneous environment with a number of light sources surrounding
a measuring site. This is numerically simulated in Figs 9(A) and
(B). As becoming apparent from here, the particle-shape-induced
uncertainty of the NSB magnitude is reduced efficiently at large
zenith angles, but remains amplified near the zenith due to the
coherent effect of all light sources distributed randomly around a
measuring point. To substantiate this claim, Fig. 9(C) illustrates
the relative deviation, while the exact positions of light sources
are unimportant, and thus not specified. Fig. 9(A) documents NSB
distribution in such environment assuming that atmospheric aerosols
are of spherical shape, while Fig. 9(B) is for the same environment
and spheroidal aerosols with aspect ratio a/b = 2.0. Fig. 9(C) is
obtained by subtracting NSB in Fig. 9(A) from that in Fig. 9(B).
3.3 Varying relative air humidity
One of the most important parameters used in the model is the relative
humidity. Particles composed of deliquescent materials may become
solution droplets in a humidified atmosphere, which is associated
with a change of the particle refractive index. Most of particles
increase in size as the relative humidity of air increases, implying
that their optical properties smoothly change as a dry-phase material
uptakes water from the atmosphere. The particle growth in the
process of humidification is described by the following formula (Bi
et al. 2018):
mw
r = r0 1 + ρ , (7)
m0
where r0 and m0 are the initial radius and mass of a particle, mw is
the mass of condensed water, and ρ is the particle density relative to
that of water. Dielectric function (ε = εr + iεi ) of a particle with
the water shell on its surface is modelled in accordance with the
Figure 9. NSB (in W m−2 sr−1 log-scale) comparing spherical (A) and ellip-
Bruggeman mixing rule (Bruggeman 1935):
soidal aerosol content with a/b = 2.0 (B) in the heterogeneous environment
ε − εc ε − εm of several randomly located cities. Relative deviation between two cases (in
fc + (1 − fc ) =0, (8)
εc + 2ε εm + 2ε per cent) is depicted in plot (C).
where fc is the volume fraction of the core, and ε c and ε m are dielectric
functions of the core and shell, respectively. Assuming the volume
more spherical (Bi et al. 2018). A sphere scatters intensively to the
fraction of the water shell being fm = 1 − fc , the mean refractive
backward direction due to constructive interference – the effect that
index of the particle is obtained as below:
is otherwise not observed or significantly suppressed in irregularly
shaped particles. Consequently, the spherical symmetry along with
εr2 + εi2 + εr εr2 + εi2 − εr
m= +i . (9) increased particle size can result in reduced side scatter and therefore
2 2 NSB around the zenith potentially becomes darker, but enhanced
The appearing impact due to relative air humidity on NSB can in sky areas around the light source and at the opposite side. A
primarily be explained by the particle growth. With increasing size modest increase of NSB around a city is due to a forward-lobed
of the particle, backscatter is more dominating and side scatter loses scattering pattern, which is more pronounced in large particles. This
efficiency. Additionally, with their growth, particles also become is demonstrated in Fig. 10, where plot (A) demonstrates the case for a
MNRAS 512, 1805–1813 (2022)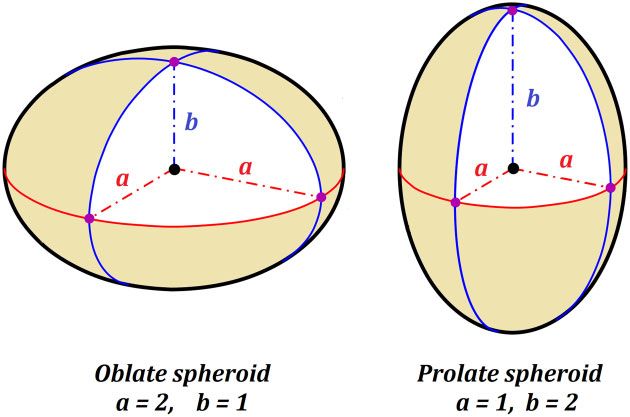
Aerosol shapes impacting night sky brightness                            1811

                                                                                                                                                                Downloaded from https://academic.oup.com/mnras/article/512/2/1805/6539341 by guest on 27 June 2022
                                                                                Figure 11. Zenith luminance as computed for three shape models as a func-
                                                                                tion of AOD. Values indicate simulated measurement results as theoretically
                                                                                provided by an SQM device, depending on the aerosol shape. Other modelling
                                                                                parameters are as discussed before.

                                                                                Table 1. Results (extract) of the applied model as described in the text.
                                                                                Absolute values illustrate the discrepancies in theoretically observed zenith
                                                                                luminance values by an SQM, depending on particle aspect ratio (a/b) and
                                                                                the aerosol optical depth (AOD).

                                                                                a/b                        AOD                    L (magSQM arcsec−2 )

                                                                                1.0                         0.0                          20.321
                                                                                                            0.2                          20.674
                                                                                                            0.4                          20.991
                                                                                                            0.9                          21.575
                                                                                1.5                         0.0                          20.321
                                                                                                            0.2                          20.758
Figure 10. Changes in percentages for NSB values occurring as a result of                                   0.4                          21.141
transitioning from dry air conditions to the relative humidity of 50 per cent                               0.9                          21.789
(top) and 70 per cent (bottom). Other modelling parameters were kept constant   2.0                         0.0                          20.321
as for computations before and described in the text.                                                       0.2                          20.496
                                                                                                            0.4                          20.748
                                                                                                            0.9                          21.282
relative humidity of 50 per cent and plot (B) for particles growing in
the process of humidification, i.e. the relative humidity is 70 per cent.
In this process, NSB changes by tens of per cent at low elevation               spherical setting of a/b = 1.5 in lower luminance values. To get
angles, but only slightly around the zenith.                                    an insight into absolute values of SQM measurements, Table 1
                                                                                highlights extracted results in magSQM arcsec−2 . As logically follows,
                                                                                for an aerosol optical thickness of 0.0, zenith luminance values do
3.4 Impacts on SQM-monitoring networks                                          not depend on aerosol shape here.
In order to analyse the direct impacts of the discussed aerosol shape
variation to ground-based measurements, parameters adjusted to
                                                                                4 DISCUSSION
SQM device properties were considered for this study. In detail,
not the whole sky but only the FWHM of 20◦ around the zenith                    Computations as performed in this work illustrate the impacts of
was included, and also the relative spectral sensitivity was taken into         deviations in aerosol shapes and relative humidity on the NSB. While
account. The theoretical observed zenith brightness was computed                the latter has shown to take influence especially towards and in
for spherical aerosols (a/b = 1.0), non-spherical spheroids (a/b = 1.5          the opposite of the theoretically modelled city, deviations due to
and 2.0), and also for aerosol optical thicknesses ranging from 0.0 to          non-spherical aerosol shapes appeared to occur especially around
0.9. The results are illustrated in Fig. 11.                                    the zenith. Consequently, remote sensing light monitoring networks,
   By the examination of occurring impacts, it can be deduced that              especially those consisting of one-dimensional photometric devices
the sky brightness follows the trend as found for the weighted                  like the SQM pointed towards the zenith, are potentially suffering
phase function (Fig. 5), specifically in the range of scattering angles         from this effect.
from 80◦ to 100◦ . Findings demonstrate that higher aerosol optical                First off, it should be determined at which point the above-
thicknesses result in more distinguished zenith luminance values,               described impact could arise in real-life conditions. This applies if
with the most extreme spheroidal shape of a/b = 2.0 resulting                   measurements are conducted near the locations where large amounts
in higher sky luminance than spherical shapes and the other non-                of aerosols different to those already situated in the atmosphere

                                                                                                                       MNRAS 512, 1805–1813 (2022)
1812 L. Kómar, S. Wallner and M. Kocifaj
Table 2. Aspect ratios of various particle types based on literature review. and scattering phase function free of ripple structures, which are
otherwise typical for Mie resonances.
Particle type Aspect ratio Source
Mineral aerosols 1.32–1.42 [1] 5 CONCLUDING REMARKS
Specifically: Calcite, Quartz 1.2–2.0, 1.1–2.5 [2]
Metal-containing particles, China 1.47 [3] One of the primary goals of this paper is to better understand the
Carbonaceous particles 1.5–1.96 [4] limits of present skyglow models in explaining differences constantly
Urban aerosols, India 1.8–1.96 [5] found between experimental NSB data and theoretical predictions,
Semi-arid region, 1.5 km a.s.l. 1.0–1.2 [6] howsoever accurate the computation can be. Along with random
Regional: Madrid particles 1.5–2.4 [7] statistical uncertainties, such limits can be related to particle shapes,
Organic matter 1.0–1.5 [8] which can potentially vary in a local atmosphere and a particular
Biological particles 1.0–3.5 [9] moment depending on, e.g., wind direction. We have shown that
Sulphates (Na-Mg-K-Ca-sulphates) 1.2–1.8 [10]
missing information on the particle aspect ratio can increase NSB
Sources: [1] = Okada et al. (2001), [2] = Veghte & Freedman (2014), [3] uncertainty significantly and potentially leads to misinterpretation of
Downloaded from https://academic.oup.com/mnras/article/512/2/1805/6539341 by guest on 27 June 2022
= Li et al. (2013), [4] = Tiwari et al. (2015), [5] = Bharti et al. (2017), [6] skyglow features and misapprehension of NSB fluctuations caused
= Tian et al. (2015), [7] = Coz et al. (2010), [8] = Chen et al. (2017), [9] primarily by varying particle shapes. Without a thorough analysis
= Li et al. (2020), and [10] = Kandler et al. (2009).
of atmospheric conditions, observed instabilities of NSB can be
mistakenly related to a varying light output from ambient ground-
are emitted. In that eventuality, industrial sites might be a potential based sources or to atmospheric parameters other than the particle
cause for this. Also relatively briefly occurring events like forest shape (e.g. AOD). This poses a question of whether the above
fires, volcano eruptions, or other natural events could be a source. uncertainty could become a real issue in future research, which
Consequently, it can be concluded that especially for long-term normally aims to achieve progressively higher accuracy in skyglow
measurements and the analysis of light pollution development, in- modelling. However, there is no doubt that further improvements
depth knowledge of the atmospheric condition in such locations to computational tools remain of low value without resolving this
must be acquired. Furthermore, it should be highlighted that real- issue. We speculate that a reasonable estimation of the particle
life applications are subject of a combination of various aspect aspect ratio can be possible based on the information on particle
ratios. Although oblate and prolate particles usually coexist in production, transportation, conversion, and aggregation in the area
the Earth’s atmosphere (Torres et al. 2018), tropospheric aerosols around the measuring point. The particle aspect ratio also depends
have been found to show predominately moderate aspect ratios on meteorological conditions such as humidity, since the particles
with typical values between 1.0 and 2.3 (Mishchenko et al. 1995). composed of water-soluble elements tend to become spherical in
Experimental investigations have underlined this finding with a/b the process of humidification. Therefore, the basic meteorological
values of the lower atmospheric layer ranging from 0.8 to 2.2 parameters and NSB should be monitored concurrently. As studied
with the peak probability located in the interval between 1.0 and in the past, only individual measurements associated with theo-
1.4 (Kocifaj, Horvath & Gangl 2008), supporting the decision to retical simulations can neglect atmospheric information, without
choose a/b = 1.0, 1.5, and 2.0 in simulations above. A reasonable being comparable to other observations however (Wallner et al.
generalization is, however, impossible since specific shape mixtures 2020).
show spatial and temporal variations, making it more preferable Both the particle shape and relative humidity of air are found
to refer to a mean aspect ratio of present aerosol particles. Such to increase the NSB amplitude by up to 70 per cent. Consequently,
values are rarely available in site, but can be inferred from pre- and due to the fact that especially shape deviations imply higher
sumably maintainable information including the location, prevail- or lower NSB values around the zenith, light monitoring network
ing aerosol types, relative humidity, etc. For instance, the aspect measurements are potentially influenced in particular. This work
ratio of aerosol particles tends to approach unity if water-soluble underlines the importance of incorporating aerosol shapes to analyses
materials uptake water in humid air. Pollen grains appear to also of light pollution development in order to draw the right conclusions
have low aspect ratios (about 1.2), unlike micron and submicron from observed absolute values.
desert dust, which often have large aspect ratios (Gómez Martı́n
et al. 2021). Information on aspect ratios typical for different
AC K N OW L E D G E M E N T S
aerosol types is scattered in scientific literature; an extract can
be found in Table 2. Findings of this work clearly show the This work was supported by the Slovak Research and Development
importance of this optical parameter, and prove the need for a Agency under Project No. APVV-18-0014. Computational work was
research investment on classification of aerosol types based on supported by the Slovak National Grant Agency VEGA (grant No.
their prevailing shapes like building and developing aerosol data 2/0010/20). Open Access funding was provided by the University
bases, such as Amsterdam Light Scattering Database (Munoz ˜ et al. of Vienna. The authors want to thank the reviewer for its valuable
2012). comments.
Furthermore, not only the results itself, but their influence to
theoretical applications in skyglow modelling and conclusions on
DATA AVA I L A B I L I T Y
potentially present light pollution must be a matter of discussion.
Here, the question arises: How to optimally deal with this effect The numerical and all-sky NSB results were computed using the
in modelling tools? With the intention of doing so, results of this SkyGlow model available at http://skyglow.sav.sk/#simulator. The
work justify the use of Henyey–Greenstein phase function (Braak ‘T-Matrix Code for Computing Electromagnetic Scattering by Non-
et al. 2001) since it is capable of mimicking the optical behaviour spherical and Aggregated Particles’ is available at https://www.gi
of random disperse media containing non-spherical particles. The ss.nasa.gov/staff/mmishchenko/t matrix.html. Input parameters and
key signs of such media are: a flat backscatter, weak side scatter, resulting data are available in the paper.
MNRAS 512, 1805–1813 (2022)Aerosol shapes impacting night sky brightness 1813
REFERENCES Li W. et al., 2020, Sci. Total Environ., 719, 137520
Mishchenko M., Travis L., Kahn R. A., West R. A., 1997, J. Geophys. Res.,
Aubé M., 2015, Phil. Trans. R. Soc. B, 370, 20140117 102, 831
Aubé M., Kocifaj M., 2012, MNRAS, 422, 819 Mishchenko M. I., Travis L., 1994a, Appl. Opt., 33, 7206
Bará S., Lima R. C., Zamorano J., 2019, Sustainability, 11, 3070 Mishchenko M. I., Travis L., 1994b, Opt. Commun., 109, 16
Bará S., Marco E., Ribas S. J., Gil G., de Miguel A. S., Zamorano J., 2021, Mishchenko M. I., Travis L., 1998, J. Quant. Spectrosc. Radiat. Transfer, 60,
Int. J. Sustain. Light, 23, 1 309
Bharti S. K., Kumar D., Anand S., Poonam Barman S. C., Kumar N., 2017, Mishchenko M. I., Lacis A. A., Carlson B. E., Travis L. D., 1995, Geophys.
Micron, 103, 90 Res. Lett., 22, 1077
Bi L., Lin W., Wang Z., Tang X., Zhang X., Yi B., 2018, J. Geophys. Res.: Mishchenko M. I., Travis L. D., Lacis A. A., 2002, Scattering, Absorption, and
Atmos., 123, 543 Emission of Light by Small Particles. Cambridge Univ. Press, Cambridge
Bohren C. F., Huffman D. R., eds, 1983, Absorption and Scattering of Light ˜ O., Hovenier J. W., 2011, J. Quant. Spectrosc. Radiat. Transfer, 112,
Munoz
by Small Particles, Vol. 1. Wiley, New York 1646
Braak J. C., de Haan J. F., der Mee C. V. M. V., Hovenier J. W., 2001, J. ˜ O., Moreno F., Guirado D., Dabrowska D., Volten H., Hovenier J.,
Munoz
Quant. Spectrosc. Radiat. Transfer, 69, 585 2012, J. Quant. Spectrosc. Radiat. Transfer, 113, 565
Bruggeman D. A. G., 1935, Ann. Phys., 416, 636
Downloaded from https://academic.oup.com/mnras/article/512/2/1805/6539341 by guest on 27 June 2022
Nousiainen T., Zubko E., Lindqvist H., Kahnert M., Tyynelä J., 2012, J.
Chen S. et al., 2017, Atmos. Chem. Phys., 17, 1259 Quant. Spectrosc. Radiat. Transfer, 113, 2391
Cinzano P., 2005, ISTIL Internal Report 9, v1.4, Night Sky Photometry with Okada K., Heintzenberg J., Kai K., Qin Y., 2001, Geophys. Res. Lett., 28,
Sky Quality Meter. ISTIL, Thiene 3123
Cinzano P., 2007, ISTIL Internal Report v0.9, Report on Sky Quality Meter, Posch T., Binder F., Puschnig J., 2018, J. Quant. Spectrosc. Radiat. Transfer,
Version L. ISTIL, Thiene 211, 144
Cinzano P., Elvidge C. D., 2004, MNRAS, 353, 1107 Puschnig J., Näslund M., Schwope A., Wallner S., 2021, MNRAS, 502, 1095
Coz E., Gómez-Moreno F. J., Casuccio G. S., Artı́˜nAno B., 2010, J. Geophys. Rich C., Longcore T., eds, 2006, Ecological Consequences of Artificial Night
Res.: Atmos., 115, D12204 Lighting. Island Press, Washington, p. 15
Falchi F. et al., 2016, Sci. Adv., 2, e1600377 Sánchez de Miguel A., Aubé M., Zamorano J., Kocifaj M., Roby J., Tapia C.,
Falchi F., Cinzano P., Elvidge C. D., Keith D. M., Haim A., 2011, J. Environ. 2017, MNRAS, 467, 2966
Manage., 92, 2714 Tian P., Cao X., Zhang L., Wang H., Shi J., Huang Z., Zhou T., Liu H., 2015,
Farafonov V. G., Voshchinnikov N. V., Somsikov V. V., 1996, Appl. Opt., 35, Atmos. Environ., 117, 212
5412 Tiwari S. et al., 2015, Environ. Sci. Pollut. Res., 22, 10744
Garstang R. H., 1991, Publ. Astron. Soc. Pac., 103, 1109 Torres O., Bhartia P. K., Jethva H., Ahn C., 2018, Atmos. Meas. Tech., 11,
Gómez Martı́n J. C. et al., 2021, J. Quant. Spectrosc. Radiat. Transfer, 271, 2701
107761 Ulanowski Z., Hesse E., Kaye P. H., Baran A. J., 2006, J. Quant. Spectrosc.
Hänel A. et al., 2018, J. Quant. Spectrosc. Radiat. Transfer, 205, 278 Radiat. Transfer, 100, 382
Joseph J. H., Kaufman Y. J., Mekler Y., 1991, Appl. Opt., 30, 3047 van de Hulst H. C., 1957, Light scattering by small particles. Dover
Kandler K. et al., 2009, Tellus B: Chem. Phys. Meteorol., 61, 32 Publications, Inc., New York
Kocifaj M., 2007, Appl. Opt., 46, 3013 Veghte D. P., Freedman M. A., 2014, Aerosol Sci. Technol., 48, 715
Kocifaj M., 2014, J. Quant. Spectrosc. Radiat. Transfer, 139, 43 Voshchinnikov N. V., 1996, J. Quant. Spectrosc. Radiat. Transfer, 55, 621
Kocifaj M., Kómar L., 2016, MNRAS, 458, 438 Wallner S., Kocifaj M., 2019, J. Quant. Spectrosc. Radiat. Transfer, 239,
Kocifaj M., Gangl M., Kundracik F., Horvath H., Videen G., 2006, J. Aerosol 106648
Sci., 37, 1683 Wallner S., Kocifaj M., Kómar L., Solano-Lamphar H. A., 2020, MNRAS,
Kocifaj M., Horvath H., Gangl M., 2008, Atmos. Environ., 42, 2582 494, 5008
Kolláth K., Kolláth Z., 2020, J. Quant. Spectrosc. Radiat. Transfer, 253,
107158
Kyba C. C. M. et al., 2017, Sci. Adv., 3, e1701528
Li W., Wang T., Zhou S., Lee S., Huang Y., Gao Y., Wang W., 2013, Environ.
Sci. Technol., 47, 9124 This paper has been typeset from a TEX/LATEX file prepared by the author.
MNRAS 512, 1805–1813 (2022)You can also read