The U.S. Economic Outlook: Welcome to Boomtown - Kevin L. Kliesen Business Economist and Research Officer Federal Reserve Bank of St. Louis
←
→
Page content transcription
If your browser does not render page correctly, please read the page content below
The U.S. Economic Outlook:
Welcome to Boomtown
Kevin L. Kliesen
Business Economist and Research Officer
Federal Reserve Bank of St. Louis

FRB St. Louis Louisville Branch Regional Economic Briefing (webinar)
March 23, 2021
                                                                       1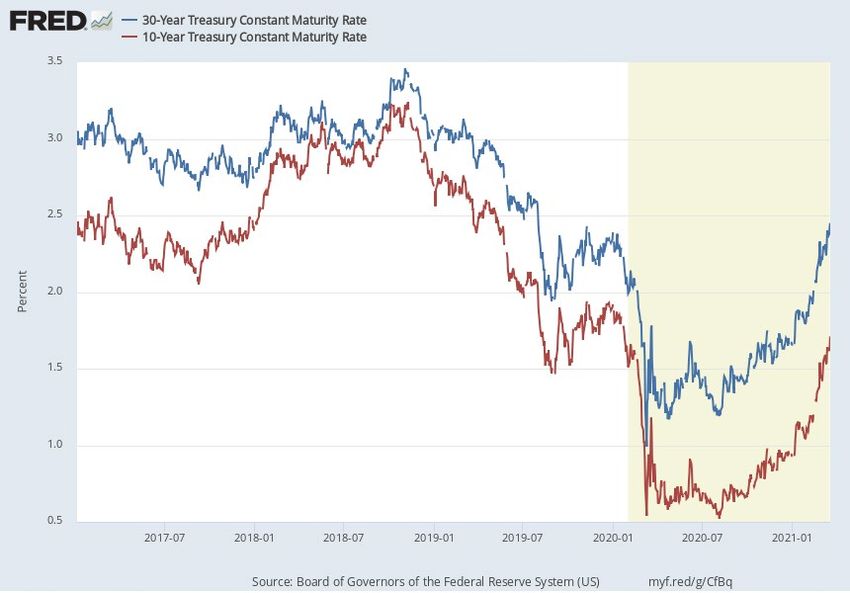
Disclaimer
The views I will express today are my
own and do not necessarily reflect the
positions of the Federal Reserve Bank
of St. Louis or the Federal Reserve
System.

                                         2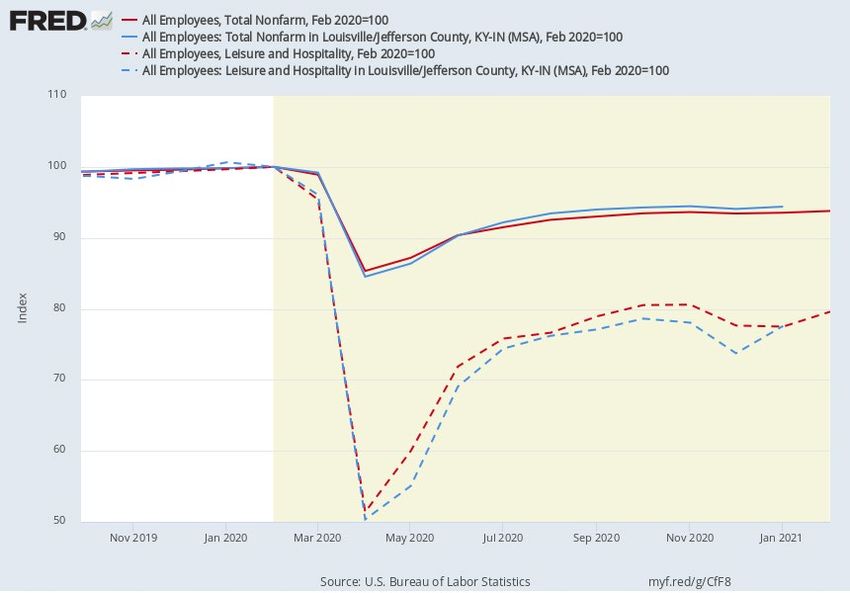
The Big Picture
• My baseline forecast is for very strong U.S. GDP
 growth this year and next. Vaccine dynamics!
• Strong growth will generate large monthly job gains
 and a rapid decline in the unemployment rate.
• The big question: Will an inflationary impulse follow
 on the heels of this jet-fueled growth? Markets say, yes.
• The marked rise in federal debt: There are no free
 lunches.
                                                             3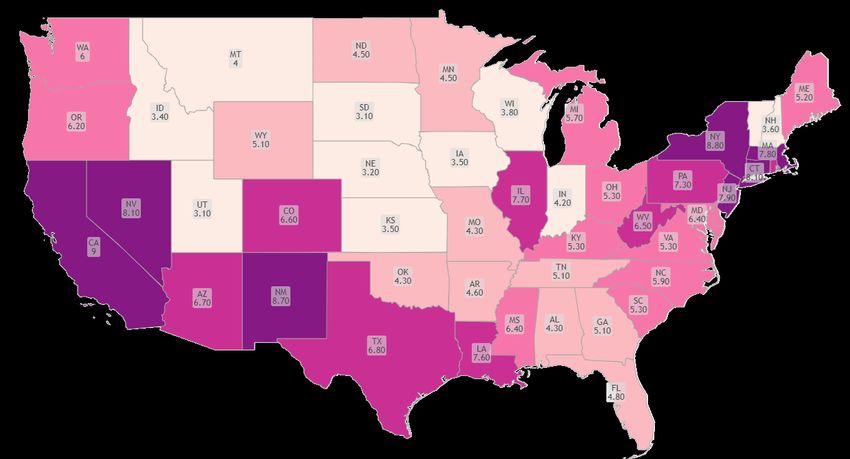
THE BIG PICTURE IN
    PICTURES

                     4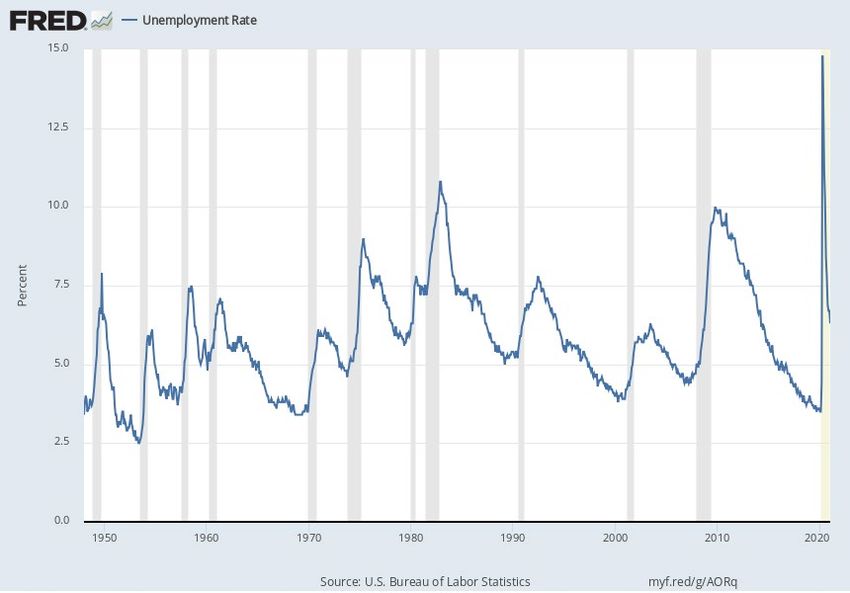
Real GDP Continues to Recover
                        Growth of Real GDP, 2019-20:

                                Annual      Quarterly
                                 Rate         Rate
                        2019:Q4 2.4%         0.6%
                        2020:Q1 - 5.0%       -1.3%
                        2020:Q2 -31.4%       -9.0%
                        2020:Q3   33.4%       7.5%
                        2020:Q4     4.1%      1.0%
                        2021:Q1(F) 6.0% to 7%

                        Percent below peak: 2.4%

                                                     5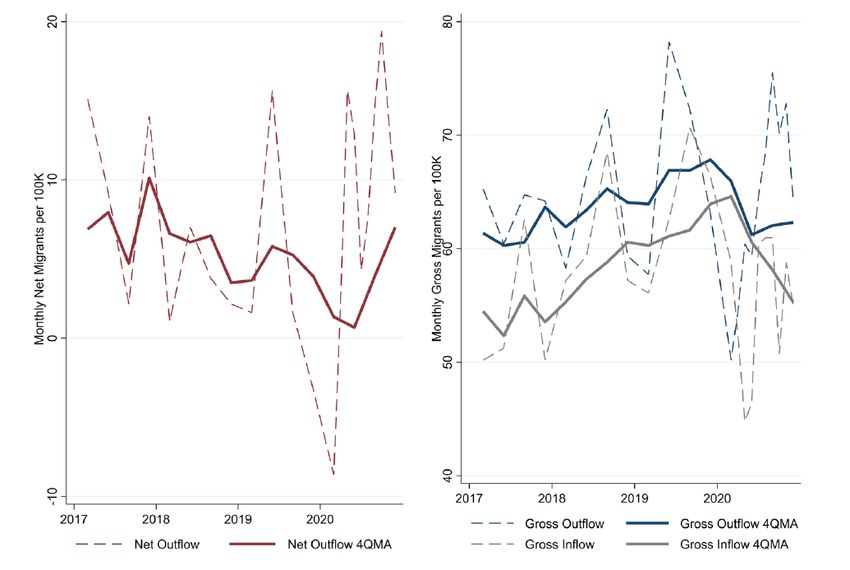
Employment Growth is Rebounding
                      Monthly Changes in U.S.
                      Nonfarm Payroll Employment:

                      Sept. 2020   716,000
                      Oct. 2020    680,000
                      Nov. 2020    264,000
                      Dec. 2020    -306,000
                      Jan. 2021    166,000
                      Feb. 2021    379,000
                      Mar. 2021    500,000 (F)
                      Employment is still 9.5 million
                      below the peak.

                                                    6
A Falling U.S. Unemployment Rate
Unemployed as a Percent of
the U.S. Labor Force:
April 2020 14.8%
June 2020 11.1%
Nov. 2020 6.7%
Dec. 2020 6.7%
Jan. 2021 6.3%
Feb. 2021 6.2%
Mar. 2021 6.1% (F)
7Temp Unemployment Surges, Falls
Unemployed: Those on Temporary and Not Temporary Layoff
Percent of labor force
14
12
Temp. UR Not Temp. UR
10
8
6
4
2
0
2005 2007 2009 2011 2013 2015 2017 2019 2021
SOURCE: BLS and Haver Analytics Data through Feb. 2021
8A Most Unusual Recession
Personal After-Tax Incomes and Expenditures, 2018 to the Present
Billions of $2012
18,000
After-Tax Real Income
17,000
16,000
Real Personal Consumption Expenditures
The passage of the
15,000 ARP Act will
14,000 Personal Saving increase after-tax
13,000 income and saving
12,000 even more!
11,000
10,000
Jan.2018 Jul.2018 Jan.2019 Jul.2019 Jan.2020 Jul.2020 Jan.2021
SOURCE: BEA and Haver Analytics
9Federal Finances Deteriorate
U.S. Federal Tax Receipts, Outlays, and Surplus/Deficit
$Billions, 12-month rolling sums (through Feb. 2021)
8,000
7,044 Total Legislative Response to
6,000
COVID thus far: $6 trillion.1
4,000
3,490
CBO Feb. Budget Projections:
2,000
• Deficit
0 ‒ FY 2020: $3.1 trillion
‒ FY 2021: $2.3 trillion
-2,000
-4,000
(3,554) • Debt/GDP (%)
‒ FY 2020: 100.1% (A)
-6,000
1994 1996 1998 2000 2002 2004 2006 2008 2010 2012 2014 2016 2018 2020
‒ FY 2021: 102.3% (P)
Outlays Receipts Surplus/Deficit 1covidmoneytracker.org
10Fed on Hold at the “Zero-Lower Bound”
The FOMC's Nominal Federal Funds Target: Actual and Projected
Percent
6
5
NOTE: FOMC
Actual FFTR projections are
4
Mar. 2021 SEP Projection based on each
(Median)
3 person’s view of
2 “appropriate”
1
policy for the
projection period.
0
2003 2004 2006 2008 2010 2011 2013 2015 2017 2018 2020 2022
SOURCE: Federal Reserve and Haver Analytics
11The Fed’s Balance Sheet is Still Growing
The FOMC is
purchasing “at
least” $80 billion
per month in
Treasury securities
and $40 billion per
month in
mortgage-backed
securities.
12Moving Up: Long-Term Interest Rates
13Financial Conditions Still Look Good
Values below zero
imply below average
levels of financial
stress, which point to
improving economic
conditions.
14THE U.S. ECONOMIC
OUTLOOK
NARRATIVE
15Uncertainty is Falling—That’s Good!
Businesses don’t like
uncertainty! Falling
levels of uncertainty,
coupled with faster
growth, should trigger a
healthy rebound in
business investment.
The Blue Chip
Consensus forecast is for
7.25% growth in 2021.
NOTE: An index value of 100 is defined to be “average.”
16Housing Likely to Remain Strong
New and Existing Single-Family Homes for Sale Housing Affordability Index
Thousands of Units, End of Period Values in Excess of 100 Indicate Housing is More Affordable
4,500 250
4,000 225
3,500 200
3,000 175
2,500 150
2,000 125
1,500 100
1,000 75
Jan.2001 Jan.2005 Jan.2009 Jan.2013 Jan.2017 Jan.2021 1991 1994 1997 2000 2003 2006 2009 2012 2015 2018 2021
Index = 100 when median family income qualifies for an 80% mortgage on a median priced existing single-family home.
SOURCE: Census, NAR, and Haver Analytics. Last observation is January 2021. SOURCE: National Association of Realtors and Haver Analytics
17PCE Services Spending Still Lags
Real Consumer Spending and its Major Components
Index, Jan. 2020 = 100
120
115
110
105
Expenditures on
100 services comprise
95
61% of the average
90
85
person’s consumption
80 basket and 44% of
75
70
GDP before the
Jan.2020 Mar.2020 May.2020 Jul.2020 Sep.2020 Nov.2020 Jan.2021
pandemic.
Total PCE Durables Nondurables Services
18A Lot of Fuel for the Fire
Real Personal Saving: Actual and Hypothetical No Pandemic Scenario
Billions of $2012
7,000
The passage of the
ARP Act will
increase saving
6,000
Actual
even more.
5,000
Hypothetical
3,930
4,000
3,000
Key question: How
$2.7 Trillion
2,000
much of this extra
1,000
1,168 saving is
0
2011 2012 2013 2014 2015 2016 2017 2018 2019 2020 2021 2022 2023
precautionary?
NOTE: Last observation is January 2021.
19PCE-Services: Jet Fuel
PCE Services: Actual and Hypothetical No Pandemic Scenario
Billions of $2012
9,500
Actual Currently, PCE Goods
9,000
expenditures are 10% above it
Hypothetical
8,500
pre-pandemic peak.
$764 Billion
8,000
If real PCE services exceeds its
pre-pandemic peak by 10% in
7,500 Dec. 2021, this will increase
real GDP by about 6.5%
7,000 above its 2020:Q4 level.
6,500
2011 2012 2013 2014 2015 2016 2017 2018 2019 2020 2021 2022 2023
SOURCE: BEA, Haver Analytics, and author's calculations.
20Have Vaccine, Will Eat Out . . . Will Travel
Open Table Seated Diners at Restaurants: United States US Airline Passenger Traffic Since February 1, 2020
Percent change from a year earlier
Total Passengers
10 2,500,000
0 Actual Current 7-Day Mov. Avg.
-10
7-Day Moving Avg.
2,000,000
-20
-30
1,500,000
-40
-50
1,000,000
-60
-70
-80 500,000
-90
-100 0
20200218 20200518 20200818 20201118 20210218 1-Feb 1-Apr 1-Jun 1-Aug 1-Oct 1-Dec 1-Feb
SOURCE: Open Table and Haver Analytics Data through Mar. 19, 2021 SOURCE: TSA Data through March 22, 2021
As of March 22, a little less than 80 million U.S. persons have received at least one dose. This
number represents about 30% of the population age 16 and older.
21Inflation Remains Below 2%
2% is the Fed’s
inflation target.
Data through January 2021.
22Firms are Reporting Price Pressures
ISM Manufacturing and Nonmanufacturing Prices Indexes
Index, 50+ = More respondents reporting higher than lower prices
90
Manufacturing
80
Nonmanufacturing
70
60
50
40
30
Jan.2013 Jan.2015 Jan.2017 Jan.2019 Jan.2021
Last actual observation is February 2021
23Rising Fuel Prices
Retail Gasoline and Diesel Prices: Actual and March 2021 EIA Forecast
Dollars per barrel
$3.50
Diesel
$3.00
$2.50
Gasoline
$2.00
Gasoline Forecast Diesel Forecast
$1.50
$1.00
Jan.2019 Jul.2019 Jan.2020 Jul.2020 Jan.2021 Jul.2021 Jan.2022 Jul.2022
SOURCE: U.S. Energy Information Administration. NOTE: Last actual observation is week ending, March 15, 2021
24And Inflation Expectations Are Rising
Breakeven Inflation Rates: 0-5 Years and 5Y5Y Forward
Percent
3.0
FOMC, March 17
2.5
2.0
1.5
1.0
5Y5Y 5Y
0.5
0.0
Dec.2017 Aug.2018 Apr.2019 Dec.2019 Aug.2020 Apr.2021
NOTE: Last actual observation is March 19, 2021
25Forecasters Expect Interest Rates to
Remain Low Over the Next Year
What Are Forecasters Predicting for 3-Month and
10-Year Interest Rates?
Percent, at annual rates
4.0
10-Year Yield Forecast But the 10-Year
3.0
(2021:Q1 to
2022:Q1)
Treasury is already
2.0 yielding about
1.75%.
1.0
3-Month Yield
0.0
2018:Q1 2018:Q4 2019:Q3 2020:Q2 2021:Q1 2021:Q4
SOURCE: Survey of Professional Forecasters, Feb. 2021.
26Inflation is Currently Low But Maybe
Not for Very Long.
• The probability of an inflationary impulse seems high.
All the ingredients are there.
‒ Price declines caused by the pandemic should reverse as
the economy strengthens.
‒ Rising input prices (e.g., commodities), exacerbated by
supply chain issues in some industries.
‒ Record money growth, rising debt and deficits, and a Fed
actively striving to run a “hot” economy.
27The FOMC’s Economic Outlook
March 2021 FOMC Economic Projections
Percent
10.0
2020 (A) 2021
8.0
6.5 6.8 2022 Longer run
6.0
4.5
4.0 3.9 4.0
3.3
2.4 2.0 2.0
2.0 1.8
1.2
0.0
-2.0
-2.4
-4.0
Real GDP Unemployment Rate PCEPI Inflation
NOTE: FOMC Projections are the median estimates of FOMC participants. The unemployment
rate is the average of the fourth-quarter for the year indicated.
28Risks to the Outlook
• So, what are some potential potholes?
• Problems might arise with the new vaccines; or, a new virus
strain that is totally or partially immune to the new vaccines.
• Strong growth and huge deficits could cause a spike in
interest rates and inflation expectations. Overheating!
• Rising interest rates and an inflation spike could trigger
financial market distress and a possible sell-off in stocks.
• Something not on our radar.
29QUESTIONS?
30REGIONAL
ECONOMIC BRIEFING Louisville Regional
Economic Outlook
Charles S. Gascon
March 23, 2021
The views I will express are my own and do not necessarily reflect the
positions of the Federal Reserve Bank of St. Louis or the Federal Reserve
System.Was the pandemic shock
localized?
Two pictures of the recovery
Outline
Short-run outlook
Long-run outlook
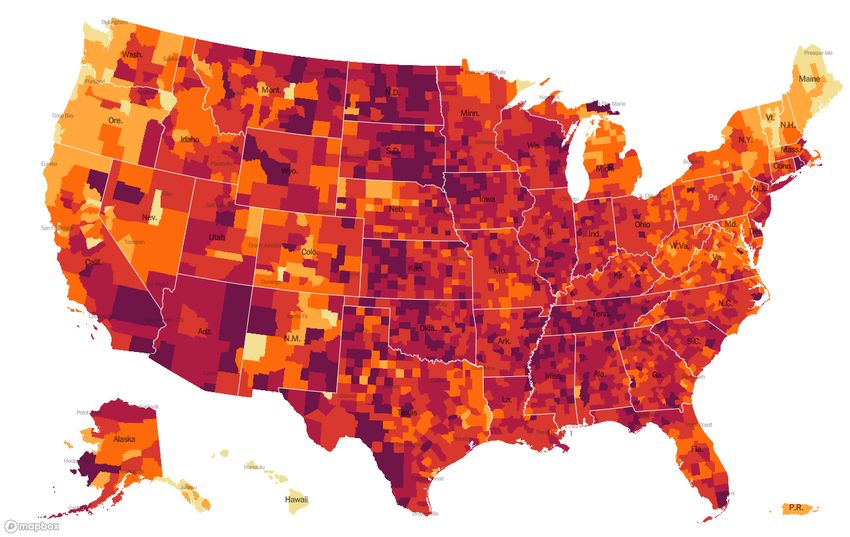
1We have all seen maps like this
Share of population with a reported COVID-19 case: Range 1:40 to 1:8
Source: New York Times, Accessed 3/22/2021
2Or even maps like this
Unemployment Rate by State: January 2021
3Or even maps like this
Unemployment Rate by State: January 2021
But maps like these are
designed to highlight differences
4Regional impact is more the same than different
Total
-5.6%
-6.5%
Hospitality: -22.5%
5Where you work matters more than where you are
Summary of employment changes Summary of employment changes
across 350 US MSAs across US major sectors (2-digit NAICS)
Feb. to Apr. Apr. to Dec. Feb. to Apr. Apr. to Dec.
Average -13 9 Average -13 9
Min -33 -1 Min -53 -4
Max -5 29 Max -1 51
+/-1 Std. Dev. -17 to -9 5 to 13 +/-1 Std. Dev. -27 to 1 -5 to 23
6Low-income workers have been more severely impacted
Employment Level relative to January 2020
10.0
5.0 4.1%
0.0
-5.0 -5.3%
-10.0 -10.1%
-15.0 -15.5%
-20.0
-25.0
-30.0
-35.0
-40.0
Jan-20 Feb-20 Mar-20 Apr-20 May-20 Jun-20 Jul-20 Aug-20 Sep-20 Oct-20 Nov-20 Dec-20 Jan-21
US LOI-High Income LOI-Low Income LOI
Source: Payechex, Ernin, Intuit, and Kronos via Opportunity Insights
7Two pictures of the recovery
8A quick rebound: look at the unemployment rate!
Jan 2021
6.3
4.7
9A long way to go: look at total employment!
-38,100 jobs
-42,300 jobs
10How to reconcile these two pictures?
Labor Force Nonfarm Employment Unemployed Unemployment
Payrolls Rate
Feb 2020 679,000 680,000 655,000 24,000 3.5%
Jan 2021 659,000 641,900 627,000 31,300 4.7%
Diff -20,000 -38,100 -27,200 7,300 1.2%
¼ are out of
¾ are out of labor force unemployed
• Does this mean unemployment rate is really 7.6%? No
• Changes in the unemployment rate will depend on if, and how, people re-enter
labor force.
11Where is the economy headed?
Forecasts for 2021
US US Kentucky Louisville
(FOMC*)
Real GDP Growth (Q4/Q4) 6.5 5.9 5.2 6.0
Unemployment Rate (Q4) 4.5 4.9 5.0 4.9
Forecasts for 2022
US US Kentucky Louisville
(FOMC*)
Real GDP Growth (Q4/Q4) 3.3 2.9 3.3 3.5
Unemployment Rate (Q4) 3.9 3.8 4.5 4.2
Source: IHS/Markit; *Federal Reserve Board of Governors, March 2021 Summary of Economic Projections
12Where is the economy headed in the next 5 years?
• Future of telework, what does it mean for cities?
• Look to trends and not the cycle
• Slow growth on the horizon?
– Aging population and low rates of immigration
– Loss of human capital from no school and declines in labor
force participation are concerning
– Focus on economic equity and inclusive growth could expand
labor force
13Are people fleeing urban neighborhoods due to COVID-19?
Average Louisville
Metro
Change in Net Flow 24 21
Change in Outflow 5 1
Change in Inflow -20 -21
Note: Values per 100,000 Residents
Source: Whitaker “Did the COVID-19 Pandemic Cause an Urban Exodus?” March, 2021
14Are people fleeing? Not really.
Estimated Gross and Net Migration into and out of Urban Neighborhoods: Louisville, MSA
Source: Whitaker “Did the COVID-19 Pandemic Cause an Urban Exodus?” March, 2021
15What does telework mean for cities?
• A survey of 22k Americans found 22% of all workdays would be supplied
from home after the pandemic. Up from 5% pre-pandemic.
• Economic models find that when WFH increases, jobs move to the core of
cities and residents move toward the suburbs.
• Housing prices near city center should grow slowly, while suburban
housing prices would grow faster.
• Impact on congestion is unclear:
– Commutes per week decline
– weekly commuting miles may not change
– non-work commuting would likely increase.
16When will Louisville regain all jobs from the pandemic?
Nonfarm Payroll Employment (Actual and Forecast)
Index 2019:Q4=100
105
US LOI
2022:Q3
100
95
90
85
2016 2017 2018 2019 2020 2021 2022 2023 2024 202
Source: IHS/Markit
17Where is the economy headed?
Forecasts for 2025
US FOMC- US Kentucky Louisville
(Longer Run)
Real GDP Growth (Q4/Q4) 1.8 2.3 1.8 1.8
Unemployment Rate (Q4) 4.0 3.6 4.2 3.8
Source: IHS/Markit; *Federal Reserve Board of Governors, March 2021 Summary of Economic Projections
18Don’t lose sight of the trend during the cycle
19Concluding thoughts
• COVID-19 impact
– More similar than different across US Metro areas.
– Recession accelerated trends already occurring, the goal is to move forward, not back.
• The long-term outlook is for slower employment growth due to an aging
population and low rates of in-migration.
• Telework creates a disconnect between location of jobs and households,
particularly at the upper-income.
– Attracting business to stimulate migration becomes more problematic in this environment.
– A renewed focus on households and their decision-making process is important for regional
economic growth post-pandemic.
• Decisions ahead: Regional leaders must balance the desire to promote a quick
recovery and making investments that accelerate trend growth.
20You can also read