The VoilA team (2020). Variable water input controls evolution of the Lesser Antilles volcanic arc. Nature, 582(7813), 525-529 ...
←
→
Page content transcription
If your browser does not render page correctly, please read the page content below
the VoilA team (2020). Variable water input controls evolution of the
Lesser Antilles volcanic arc. Nature, 582(7813), 525-529.
https://doi.org/10.1038/s41586-020-2407-5

Peer reviewed version

Link to published version (if available):
10.1038/s41586-020-2407-5

Link to publication record in Explore Bristol Research
PDF-document

This is the author accepted manuscript (AAM). The final published version (version of record) is available online
via Nature Research at https://www.nature.com/articles/s41586-020-2407-
5#:~:text=Abstract,continental%20crust%20and%20mineral%20resources . Please refer to any applicable terms
of use of the publisher.

University of Bristol - Explore Bristol Research
General rights

This document is made available in accordance with publisher policies. Please cite only the
published version using the reference above. Full terms of use are available:
http://www.bristol.ac.uk/red/research-policy/pure/user-guides/ebr-terms/
1        Variable water input controls evolution of the Lesser Antilles
2                                           volcanic arc
3
4    George F. Cooper1*, Colin G. Macpherson2, Jon D. Blundy1, Benjamin Maunder3, Robert W.

5    Allen3, Saskia Goes3, Jenny Collier3, Lidong Bie5, Nick Harmon4, Stephen P. Hicks3,

6    Alexander A. Iveson2, Julie Prytulak2, Andreas Rietbrock5,6, Catherine Rychert4, Jon P.

7    Davidson2 and the VoiLA team

8
     1
9        School of Earth Sciences, University of Bristol, Wills Memorial Building, Bristol BS8 1RJ,

10   UK
     2
11       Department of Earth Sciences, Durham University, Science Labs, Durham DH1 3LE, UK
     3
12       Department of Earth Science and Engineering, Imperial College London, SW7 2AZ, UK
     4
13       University of Southampton, National Oceanography Centre, European Way, Southampton,

14   SO14 3ZH, UK
     5
15       Department of Earth Ocean & Ecological Sciences, University of Liverpool, UK
     6
16       Geophysical Institute (GPI), Karlsruhe Institute of Technology, 76187 Karlsruhe, Germany

17

18   *corresponding author, email: CooperG3@cardiff.ac.uk, current address: School of Earth and
19   Ocean Sciences, Cardiff University, Cardiff, CF10 3AT, UK
20
21   A list of authors and their affiliations appears at the end of the paper

22

23   Oceanic lithosphere carries volatiles, notably water, into the mantle via subduction at

24   convergent plate boundaries. This subducted water exercises a key control on the

25   production of magma, earthquakes, formation of continental crust and mineral

26   resources. However, identifying different potential fluid sources (sediments, crust and
27 mantle lithosphere) and tracing fluids from their release to observed surface 28 expressions has proved challenging1. The two Atlantic subduction zones are valuable 29 end members to study this deep water cycle because hydration in Atlantic lithosphere, 30 produced by slow spreading, is expected to be highly non-uniform2. As part of an 31 integrated, multi-disciplinary project in the Lesser Antilles3, we studied boron trace 32 element and isotopic fingerprints of melt inclusions. These reveal that serpentine, i.e. 33 hydrated mantle rather than crust or sediments, is a dominant supply of subducted 34 water to the central arc. This serpentine is most likely to reside in a set of major 35 fracture zones subducted beneath the central arc over the past ~10 Myr. Dehydration 36 of these fracture zones is consistent with the locations of the highest rates of 37 earthquakes and prominent low shear velocities, as well as time-integrated signals of 38 higher volcanic productivity and thicker arc crust. These combined geochemical and 39 geophysical data provide the clearest indication to date that the structure and hydration 40 of the downgoing plate are directly connected to the evolution of the arc and its 41 associated hazards. 42 43 The 750 km-long Lesser Antilles volcanic arc (LAA), located along the eastern margin of the 44 Caribbean Plate, is the result of slow (1-2 cm/year) westward subduction of Atlantic and 45 proto-Caribbean oceanic lithosphere (Fig 1). Water hosted in hydrous phases within the 46 subducting plate will be released as the slab sinks into the mantle and warms up. As the water 47 migrates out of the slab the stress on faults is reduced, causing earthquakes. At the same time, 48 the addition of water to the overlying mantle wedge reduces the solidus temperature which 49 may enhance melting. LAA magma production rates lie at the lower end of the global range, 50 probably due to the low convergence rates, and are very unevenly distributed, being greatest 51 in the centre of the arc (Dominica and Guadeloupe)4. The LAA also displays notable along-
52   arc variations in geochemistry, volcanic activity, crustal structure, and seismicity5–8.

53   Subducting plate velocity and age are often held responsible for variations in convergent

54   margin behaviour9 but are unlikely to have first-order influence on lateral variations within

55   the LAA as neither vary significantly along-strike. Instead, variations in LAA magmatism

56   and seismicity have been proposed to reflect; (i) a combination of a strong north to south

57   increase in sediment input10, (ii) subduction of bathymetric ridges below the central arc11,

58   which may enhance plate stress and coupling, (iii) and/or subduction of strongly hydrated

59   fracture zones12 at several locations along arc (Fig. 1).

60

61   Current plate reconstructions13 show the northern LAA to be underlain by ~90 Ma subducted

62   lithosphere that formed at the Equatorial Mid-Atlantic Ridge and includes the Marathon and

63   Mercurius fracture zones (Fig. 1), whereas beneath the southern LAA, the subducted

64   lithosphere is up to 120 Ma old and formed at the, now-fully subducted, proto-Caribbean

65   mid-ocean ridge. The seafloor spreading rates were slow in both cases. The boundary

66   between the two seafloor-spreading domains is clearly visible in both bathymetric and gravity

67   data, projecting from the Demerera Plateau toward the central islands before becoming

68   obscured by the accretionary prism around Barbados (Fig. 1; Extended Data Fig. 1).

69

70   Hydration of lithosphere formed by intermediate or fast spreading occurs mainly in the mafic

71   crust through faults that form as the plate bends into the trench. By contrast, slow spreading

72   produces highly tectonised oceanic lithosphere with relatively thin mafic crust, pronounced

73   faults, and sections of upper mantle material exposed at the seafloor14. The transform faults at

74   slow spreading ridges, which manifest as fracture zones in mature oceanic crust, are more

75   seismically active and penetrate to greater depths than in faster-spread lithosphere15. These

76   large-scale faults provide pathways for seawater and low/medium temperature alteration
77    including hydration of the mantle mineral olivine to serpentine16. Serpentine, in the form of

78    antigorite, can hold up to 13 wt. % structural water, at least double the water capacity of

79    hydrated mafic crust. Thus, subduction of serpentinized mantle lithosphere has the potential

80    to supply substantial volumes of fluid to magmatic arcs. In order to evaluate along-arc

81    variations of slab-derived fluid sources (e.g. sediment, oceanic crust, or serpentinized mantle

82    lithosphere), we measured trace element concentrations and boron isotopic ratios of melt

83    inclusions along the entire LAA. To investigate how fluids influence arc magma genesis and

84    evolution we compare these geochemical proxies for slab-derived fluids with newly-acquired

85    geophysical data3, and with the predicted positions of subducted fracture zones and the proto-

86    Caribbean/Equatorial Atlantic plate boundary below the arc at different times.

87

88    In subduction zone magmas, boron and its isotopes trace contributions from fluids released

89    by the subducting plate17,18. Boron is fluid mobile, and a high ratio of boron to fluid-

90    immobile elements, like Ti, Nb, or Zr, in arc magmas suggests boron is principally supplied

91    by subducting-plate fluids19. Serpentine-derived boron is enriched in 11B compared to 10B,

92    producing distinctively elevated δ11B values of +7‰ to +20‰17 (δ11B=

93    ((11B/10B)sample/(11B/10B)standard -1) x103). As a result, arc magmas produced through mantle

94    melting induced by serpentine-derived fluids have significantly higher δ11B values (up to

95    +18‰20) than MORB-source mantle (-7.1 ± 0.9‰21). Fluids derived from subducted

96    sediments have yet a different distinct chemical signature22. Sediments in ocean drill cores

97    east of the LAA contain terrigenous turbidites, pelagic clays, and ashy siliceous clays23.

98    Although these sediments are enriched in boron (50-160 ppm B), they have significantly

99    lower δ11B values (approximately -15 to +5‰21) than serpentine-derived fluids at sub-arc

100   depths24.

101
102   Using secondary ion mass spectrometry (SIMS), we measured 198 glassy, clinopyroxene-

103   hosted melt inclusions for volatiles (H2O, CO2) and trace elements, of which 92 were further

104   analysed for boron isotopic composition. The analysed melt inclusions are from fresh

105   volcanic deposits assumed to be
128   within each volcanic centre is unlikely to be due to crustal differentiation because there are

129   no systematic trends in δ11B with indicators of differentiation (e.g. SiO2 and Rb/Sr, Extended

130   Data Fig. 3). This is consistent with prior findings that fractional crystallisation has negligible

131   effect on melt δ11B values25,26. Crustal assimilation during open-system differentiation may

132   also modify δ11B and B/Nb, but inputs from this source likely have a similar isotopic and

133   geochemical composition to AOC and sediment22. Assimilation of LAA crust would lower

134   melt δ11B values during differentiation, a trend that is not observed in our data (Extended

135   Data Fig. 3). Although there is a range of melt inclusion δ11B values within each single

136   volcanic centre (e.g 3.5 ‰ in Martinique) there are clear δ11B differences between

137   neighboring volcanic centres with similar major element chemistry. Therefore, we interpret

138   the distinct δ11B values in evolved melt inclusions at each island as a reflection of differences

139   between the mantle source regions of each island, such that boron isotopes provide a robust

140   tracer for the fluid source18.

141

142   We interpret the δ11B differences between islands and the systematic δ11B change along the

143   arc to result from variable involvement of fluids from two distinct sources: (1) altered

144   oceanic crust (AOC) and sediment; and (2) serpentine dehydration (Fig. 3). In the central

145   portion of the arc, melt inclusions from Guadeloupe and Dominica have δ11B values

146   significantly greater than +5‰. Of the available sources, only fluid with > 60% contribution

147   from serpentine dehydration has the capacity to generate this isotopic signature (Fig. 3). The

148   lower δ11B values found in the north and south of the arc can be attributed primarily to fluid

149   released by dehydration of AOC and sediment (Fig. 3). However, there is no simple

150   relationship between δ11B and indicators of varying volume of fluid addition (e.g. B/Be and

151   B/Nb; Extended Data Fig. 3). In contrast to Guadeloupe and Dominica, St. Lucia melt

152   inclusions from this study have a high net fluid contribution based on the Nb/B values, but
153 we estimate
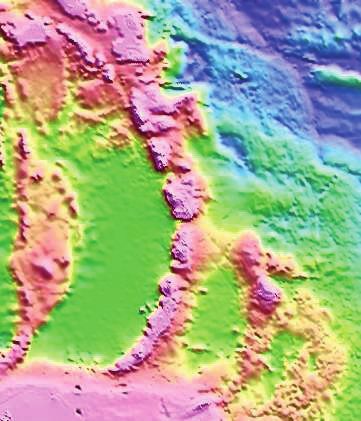
178   predict a peak in dehydration from 0-2 Ma of subduction of the Marathon and Mercurius

179   fracture zones. Therefore, our data indicate that enhanced fluid fluxing of the mantle wedge

180   is associated with higher magma production in the LAA. However, because it is not possible

181   to quantify the relative controls of flux melting versus decompression melting with the

182   available data we cannot identify the cause of any relationship at present.

183

184   High ratios of small to large earthquakes (high b-values) on the plate interface and forearc12

185   (Fig. 4c), as well as low shear-wave velocities (4.3 +/- 0.05 km/s) at 50 km depth (Fig. 4d,

186   derived from Rayleigh waves recorded during the VoiLA seismic experiment3 - see Methods)

187   could reflect excess dehydration at shallower depths. High b-values are commonly attributed

188   to seismogenic failure at lower stresses due to higher pore fluid pressures, while shear

189   velocity anomalies of around 9% could correspond to about 1.1 vol. % of fluids and

190   associated melts32. Shear velocities and b-values are characterised by a prominent maximum

191   and minimum, respectively, in the region around Martinique, i.e. displaced southward from

192   the peak in boron isotopes. Due to the obliquity of the fracture zones to the trench, excess

193   forearc dehydration (derived from shallower slab depths) is expected to occur further to the

194   south than dehydration below the arc, coincident with the b-value and shear velocity peaks

195   (Fig. 4b).

196

197   Finally, there are systematic variations in crustal thickness along the arc7, with thicknesses of

198   around 35 km north of Martinique and around 30 km in the south. These reflect a long-term

199   integrated variation in magma productivity. When we consider the excess dehydration over

200   the age of the present arc (around 25 Myr), the position of Marathon-Mercurius fracture zone

201   subduction has shifted from the north near St Kitts to Dominica today, hence a larger crustal
202   thickness would be expected along the whole northern arc, as observed. Again, however, we

203   cannot constrain the relative role of decompression melting in this magma production.

204

205   None of the other Atlantic fracture zones have contributed to dehydration below the arc. The

206   15-20 fracture zone has not subducted deep enough (but higher b-values and lower shear-

207   wave velocities in the forearc near Antigua in Fig. 4 could, given spatial resolution of these

208   measurements, indicate shallow fluid release from it). Other Atlantic fracture zones have yet

209   to reach the trench. It is likely that there were fracture zones in the Proto-Caribbean oceanic

210   lithosphere but their location is uncertain. We included in our model a single, large-offset

211   fracture zone at the location required to fit the basin geometry between the Bahamas Bank

212   and Demerara Rise (Fig. 1; see Methods). This yields a small peak in excess dehydration in

213   the southernmost arc. Thus, within the uncertainties, Proto-Caribbean fracture zones could

214   explain the increases in δ11B and b-values and decrease in shear velocities around St.

215   Vincent and Grenada.

216

217   Given the geological complexity of subduction systems, our new geochemical and

218   geophysical expressions of fluids along the LAA show remarkable coherence with the

219   predicted history of fluid release from fracture zones in the subducting plate at different

220   locations in the system and over different temporal windows. Furthermore, the high boron

221   contents and elevated δ11B signature of melt inclusions in magmas from the central segment

222   of the arc are unambiguous indicators of dehydration of subducted serpentine, which is

223   expected to be one the main minerals formed in fracture zone hydration. Therefore, our

224   observations provide strong evidence that a heterogeneous distribution of serpentine in

225   subducting mantle lithosphere exerts a primary control on along-arc variations in mantle
226   wedge hydration and seismicity and may also influence the crustal structure and magmatic

227   productivity of volcanic arcs.

228

229   References

230   1. Hacker, B. R. H2O subduction beyond arcs. Geochem. Geophys. Geosystems 9, (2008).

231   2. Grevemeyer, I., Ranero, C. R. & Ivandic, M. Structure of oceanic crust and

232       serpentinization at subduction trenches. Geosphere 14, 395–418 (2018).

233   3. Goes, S. et al. Project VoiLA: Volatile Recycling in the Lesser Antilles. Eos 100, (2019).

234   4. Wadge, G. Comparison of volcanic production rates and subduction rates in the Lesser

235       Antilles and Central America. Geology 12, 555–558 (1984).

236   5. Boynton, C. H., Westbrook, G. K., Bott, M. H. P. & Long, R. E. A seismic refraction

237       investigation of crustal structure beneath the Lesser Antilles island arc. Geophys. J. R.

238       Astron. Soc. 58, 371–393 (1979).

239   6. Macdonald, R., Hawkesworth, C. J. & Heath, E. The Lesser Antilles volcanic chain: a

240       study in arc magmatism. Earth-Sci. Rev. 49, 1–76 (2000).

241   7. Melekhova, E. et al. Lateral variation in crustal structure along the Lesser Antilles arc

242       from petrology of crustal xenoliths and seismic receiver functions. Earth Planet. Sci.

243       Lett. 516, 12–24 (2019).

244   8. Hayes, G. P., McNamara, D. E., Seidman, L. & Roger, J. Quantifying potential

245       earthquake and tsunami hazard in the Lesser Antilles subduction zone of the Caribbean

246       region. Geophys. J. Int. 196, 510–521 (2014).

247   9. Keken, P. E. van, Hacker, B. R., Syracuse, E. M. & Abers, G. A. Subduction factory: 4.

248       Depth-dependent flux of H2O from subducting slabs worldwide. J. Geophys. Res. Solid

249       Earth 116, (2011).
250   10. Carpentier, M., Chauvel, C. & Mattielli, N. Pb–Nd isotopic constraints on sedimentary

251       input into the Lesser Antilles arc system. Earth Planet. Sci. Lett. 272, 199–211 (2008).

252   11. Bouysse, P. & Westercamp, D. Subduction of Atlantic aseismic ridges and Late Cenozoic

253       evolution of the Lesser Antilles island arc. Tectonophysics 175, 349–380 (1990).

254   12. Schlaphorst, D. et al. Water, oceanic fracture zones and the lubrication of subducting

255       plate boundaries—insights from seismicity. Geophys. J. Int. 204, 1405–1420 (2016).

256   13. Müller, R. D. et al. A Global Plate Model Including Lithospheric Deformation Along

257       Major Rifts and Orogens Since the Triassic. Tectonics 38, 1884–1907 (2019).

258   14. Escartín, J. et al. Central role of detachment faults in accretion of slow-spreading oceanic

259       lithosphere. Nature 455, 790–794 (2008).

260   15. Manea, V. C., Leeman, W. P., Gerya, T., Manea, M. & Zhu, G. Subduction of fracture

261       zones controls mantle melting and geochemical signature above slabs. Nat. Commun. 5,

262       5095 (2014).

263   16. Bach, W. & Früh-Green, G. L. Alteration of the Oceanic Lithosphere and Implications

264       for Seafloor Processes. Elements 6, 173–178 (2010).

265   17. De Hoog, J. C. M. & Savov, I. P. Boron Isotopes as a Tracer of Subduction Zone

266       Processes. in Boron Isotopes: The Fifth Element (eds. Marschall, H. & Foster, G.) 217–

267       247 (Springer International Publishing, 2018). doi:10.1007/978-3-319-64666-4_9.

268   18. Leeman, W. P., Tonarini, S. & Turner, S. Boron isotope variations in Tonga-Kermadec-

269       New Zealand arc lavas: Implications for the origin of subduction components and mantle

270       influences. Geochem. Geophys. Geosystems 18, 1126–1162 (2017).

271   19. Leeman, W. P. Boron and other fluid-mobile elements in volcanic arc lavas: Implications

272       for subduction processes. Wash. DC Am. Geophys. Union Geophys. Monogr. Ser. 96,

273       269–276 (1996).
274   20. Tonarini, S., Leeman, W. P. & Leat, P. T. Subduction erosion of forearc mantle wedge

275       implicated in the genesis of the South Sandwich Island (SSI) arc: Evidence from boron

276       isotope systematics. Earth Planet. Sci. Lett. 301, 275–284 (2011).

277   21. Marschall, H. R. Boron Isotopes in the Ocean Floor Realm and the Mantle. in Boron

278       Isotopes: The Fifth Element (eds. Marschall, H. & Foster, G.) 189–215 (Springer

279       International Publishing, 2018). doi:10.1007/978-3-319-64666-4_8.

280   22. Bezard, R. et al. Assimilation of sediments embedded in the oceanic arc crust: myth or

281       reality? Earth Planet. Sci. Lett. 395, 51–60 (2014).

282   23. Plank, T. 4.17 - The Chemical Composition of Subducting Sediments. in Treatise on

283       Geochemistry (Second Edition) (eds. Holland, H. D. & Turekian, K. K.) 607–629

284       (Elsevier, 2014). doi:10.1016/B978-0-08-095975-7.00319-3.

285   24. Benton, L. D., Ryan, J. G. & Tera, F. Boron isotope systematics of slab fluids as inferred

286       from a serpentine seamount, Mariana forearc. Earth Planet. Sci. Lett. 187, 273–282

287       (2001).

288   25. Kaliwoda, M. et al. Boron and boron isotope systematics in the peralkaline Ilímaussaq

289       intrusion (South Greenland) and its granitic country rocks: A record of magmatic and

290       hydrothermal processes. Lithos 125, 51–64 (2011).

291   26. Jones, R. E. et al. Temporal variations in the influence of the subducting slab on Central

292       Andean arc magmas: Evidence from boron isotope systematics. Earth Planet. Sci. Lett.

293       408, 390–401 (2014).

294   27. McCaig, A. M. et al. No significant boron in the hydrated mantle of most subducting

295       slabs. Nat. Commun. 9, 1–10 (2018).

296   28. Paulatto, M. et al. Dehydration of subducting slow-spread oceanic lithosphere in the

297       Lesser Antilles. Nat. Commun. 8, 15980 (2017).
298   29. Vils, F., Tonarini, S., Kalt, A. & Seitz, H.-M. Boron, lithium and strontium isotopes as

299       tracers of seawater–serpentinite interaction at Mid-Atlantic ridge, ODP Leg 209. Earth

300       Planet. Sci. Lett. 286, 414–425 (2009).

301   30. Bie, L. et al. Along Arc Heterogeneity in Local Seismicity across the Lesser Antilles

302       Subduction Zone from a Dense Ocean Bottom Seismometer Network. Seismol. Res.

303       Lett. 91, 237–247 (2020).

304   31. Kirby, S., Engdahl, R. E. & Denlinger, R. Intermediate-Depth Intraslab Earthquakes and

305       Arc Volcanism as Physical Expressions of Crustal and Uppermost Mantle Metamorphism

306       in Subducting Slabs. in Subduction 195–214 (American Geophysical Union (AGU),

307       2013). doi:10.1029/GM096p0195.

308   32. Hammond, W. C. & Humphreys, E. D. Upper mantle seismic wave velocity: Effects of

309       realistic partial melt geometries. J. Geophys. Res. Solid Earth 105, 10975–10986 (2000).

310   33. Gurenko, A. A., Trumbull, R. B., Thomas, R. & Lindsay, J. M. A melt inclusion record

311       of volatiles, trace elements and Li–B isotope variations in a single magma system from

312       the Plat Pays Volcanic Complex, Dominica, Lesser Antilles. J. Petrol. 46, 2495–2526

313       (2005).

314   34. Bouvier, A.-S., Métrich, N. & Deloule, E. Light elements, volatiles, and stable isotopes in

315       basaltic melt inclusions from Grenada, Lesser Antilles: Inferences for magma genesis.

316       Geochem. Geophys. Geosystems 11, (2010).

317   35. Bouvier, A.-S., Manzini, M., Rose-Koga, E. F., Nichols, A. R. L. & Baumgartner, L. P.

318       Tracing of Cl input into the sub-arc mantle through the combined analysis of B, O and Cl

319       isotopes in melt inclusions. Earth Planet. Sci. Lett. 507, 30–39 (2019).

320

321   End notes

322   Data availability statement
323   All geochemical data generated during this study are included in this published article (and

324   its supplementary information files) and can be accessed in the EarthChem repository

325   (https://doi.org/XXXX/XXXX). Compiled geochemical data is freely available from the

326   GEOROC database. Metadata of the VoiLA broadband OBS network and used land stations,

327   a catalogue of the local earthquakes, and teleseismic Rayleigh wave data can be accessed

328   through the Zenodo repository: https://doi.org/10.5281/zenodo.3725528. All broadband OBS

329   data collected by the VoiLA project will become freely available through the IRIS DMC

330   (Data Management Center) via their data request tools, at the end of the project (April 2021).

331

332   VOILA team consortium
333
334   George F. Cooper1, Colin G. Macpherson2, Jon D. Blundy1, Benjamin Maunder3, Robert W.

335   Allen3, Saskia Goes3, Jenny Collier3, Lidong Bie5, Nick Harmon4, Stephen P. Hicks3,

336   Andreas Rietbrock5,6, Catherine Rychert4, Jon P. Davidson2, Richard G. Davy3, Tim J.

337   Henstock4, Michael J. Kendall2, David Schlaphorst2, Jeroen van Hunen2, Jamie J.

338   Wilkinson3,7, Marjorie Wilson8

339
      6
340       Geophysical Institute (GPI), Karlsruhe Institute of Technology, 76187 Karlsruhe, Germany
      7
341       Department of Earth Sciences, Natural History Museum, Cromwell Road, London SW7

342   5BD, UK
      8
343       School of Earth and Environment, University of Leeds, Leeds, LS2 9JT, UK

344

345   Acknowledgements

346   We thank our project partners, Richard Robertson, Joan Latchman, Steve Tait and Frank

347   Krüger for support and discussion over the course of this project. We thank C. J. de Hoog for

348   assistance with SIMS analysis at the Edinburgh Ion Microprobe Facility and Stuart Kearns
349 for help with EPMA analysis, the German Instrument Pool for Amphibian Seismology 350 (DEPAS), hosted by the Alfred Wegener Institute Bremerhaven, for providing the ocean- 351 bottom and temporary island seismometers, and UCSD (Scripps) for providing additional 352 ocean-bottom seismometers. This research was funded by the VoiLA NERC consortium 353 grant (NE/K010824/1). SIMS analysis was funded by EIMF proposals IMF619/0517 and 354 IMF653/0518. 355 356 Author Contributions 357 All authors discussed the results and implications of the work and commented on the 358 manuscript at all stages. G.F.C., C.G.M., J.D.B., and A.A.I carried out geochemical analysis 359 and interpretation. G.F.C, S.G., C.G.M, J.D.B., and J.C. drafted the manuscript. N.H. and 360 C.R. produced the shear-wave velocity model. B.M. made the dehydration model. L.B. and 361 S.P.H compiled local seismicity data, D.S. mapped b-values. R.W.A and J.C. produced the 362 tectonic reconstruction and associated figures. C.G.M., S. G., J. D. B., J.C., A.R., N.H., C.R., 363 J.P.D., T.J.H., J.v.H., J.J.W and M.W designed the original VoiLA experiment. 364 365 Author Information Statement 366 Reprints and permissions information is available at www.nature.com/reprints. 367 The authors declare no competing interests. 368 Correspondence and requests for materials should be addressed to CooperG3@cardiff.ac.uk 369 370 371 Figure Captions 372 Fig. 1. Bathymetric map of the study area showing the islands of the Lesser Antilles Arc 373 (LAA, red). Map shows locations of the trench (purple line), oceanic fracture zones (black
374   lines, dashed where subducted), boundary between the proto-Caribbean and equatorial

375   Atlantic seafloor (red line) and South American continent-ocean boundary (yellow line).

376   Proto-Caribbean fracture zones have fully subducted; the likely location of a single one,

377   required by basin geometry, is shown as a light dashed line. The bathymetric contrast

378   between the northern and southern forearc is due to a strong difference in sediment thickness

379   (from a few km in the north to > 15 km in the Barbados accretionary prism). Depth contours

380   of the slab below the LAA are shown every 20 km (light blue lines) and every 100 km (dark

381   blue lines). See Methods and Extended Data Figures 1 and 2 for further details.

382

383   Fig. 2. Bathymetric map of the Lesser Antilles Arc compared to water, B/Nb ratios, and δ11B

384   of melt inclusions in lavas. H2O (this study and compiled published values) and B/Nb

385   symbols are coloured by the SiO2 wt% of melt inclusions, as an indicator of magmatic

386   differentiation. δ11B symbols are coloured by B/Nb as an indicator of fluid addition.

387   Previously published boron isotope ratios from melt inclusions33–35 are shown as crosses.

388   Error bars on δ11B values represent propagated 1σ uncertainties and are typically 60% (green), 30-60% (blue), and
399   and ‘low’ fluid contributions, respectively. Only samples measured in this study are plotted.

400   Error bars on δ11B values represent propagated 1σ uncertainties and are smaller than symbol

401   size where absent. All 1σ uncertainties are typically
423   Crystals were separated from crushed and sieved scoria, pumice or lava. Picked crystals from

424   the 0.5-1 mm and 1-2 mm size fractions were mounted on glass slides within 2.5 cm diameter

425   aluminium rings, back-filled with epoxy resin, and polished to expose the centre of the

426   crystals. Crystals were imaged under transmitted light to locate the most suitable glassy

427   inclusions before further polishing to expose the maximum number of melt inclusions. All

428   epoxy mounts were gold-coated prior to SIMS analysis.

429

430   b) Trace elements by SIMS

431   We measured concentrations of H2O, CO2 and trace elements in 198 melt inclusions using the

432   Cameca IMS-4f at the NERC Edinburgh Ion Micro-Probe Facility (EIMF), over two sessions

433   (October 2017 and January 2018). The IMS-4f instrument was run with a 15 kV (nominal)

434   primary beam of O- ions with a beam current of ~5 nA, resulting in a spot size at the sample

435   surface of ~15 μm diameter. Positive secondary ions were extracted at 4.5 kV, using energy

436   filtering with an energy window of 50±25 eV (for CO2 analysis) or 75±25 eV (for all other

437   elements). CO2 measurements were performed first. Prior to each analysis, the sample was

438   pre-sputtered using a primary beam raster of 20 μm for 4 minutes to reduce C backgrounds

439   resulting from surface contamination. The isotopes 12Mg2+, 12C, 26Mg, and 30Si were

440   measured. Peak positions were verified at the start of each analysis. The background C signal

441   was determined through analysis of the nominally C-free KL2-G glass standard. Following

442   CO2 analysis, H2O and trace element concentrations were measured on the same analytical

443   spot as the CO2 analyses, using a secondary accelerating voltage of 4500 V with 75 V offset

444   and a 25 μm image field. The isotopes 1H, 7Li, 11B, 19F, 26Mg, 35Cl, 30Si, 42Ca, 44Ca, 45Sc,
      47
445        Ti, 84Sr, 85Rb, 88Sr, 89Y, 90Zr, 93Nb, 133Cs, 138Ba, 139La, 140Ce, and 149Sm were measured.

446   Calibration was carried out on a range of basaltic glass standards with 0–4 wt.% H2O,

447   repeated throughout the day. Absolute element concentrations were calculated using the in-
448 house JCION5 software and by normalizing the intensities to Si (as measured using 30Si)
449 which was determined by subsequent electron microprobe analysis. A summary of repeat
450 analyses of GSD-1G and T1-G are presented in the Supplementary Data.
451
452 c) Electron microprobe
453 Following volatile and trace element analysis, we measured major elements using a Cameca
454 SX100 electron microprobe (EPMA) at the University of Bristol, UK. The gold coat was
455 removed and samples were carbon-coated. Concentrations of SiO2, TiO2, Al2O3, Fe2O3,
456 MnO, MgO, CaO, Na2O, K2O, P2O5, Cr2O3, SO2, and Cl in glass were made with a 20 kV
457 accelerating voltage, a 4 nA beam current and a 5 μm or 10 μm defocused beam to minimise
458 alkali loss36. Major elements were calibrated using a range of synthetic oxide, mineral and
459 metal standards.
460
461 d) Boron isotopes by SIMS
462 Prior to boron isotope analysis, crystals hosting the measured melt inclusions were cut out of
463 the epoxy mounts and pressed into indium within 24 mm diameter Al holders. This step
464 reduced the total number of sample mounts and, as indium outgasses less than epoxy, reduces
465 the time required to reach a suitable vacuum for analysis.
466
467 We measured boron isotopes (11B and 10B) in 92 melt inclusions using the Cameca IMS-1270
468 at the NERC Edinburgh Ion Micro-Probe Facility (EIMF), in December 2018. Prior to
469 analysis, the samples were cleaned and a gold coat was applied. Positive secondary ions of
10
470 B+ and 11B+ were produced by sputtering the sample with a 5nA, 16O2- primary beam with a
471 net impact energy of 22 keV, focused using Köhler illumination to a ~25µm spot size.
472 Secondary ions were extracted at 10 kV and counted by a single electron multiplier detector.473 No energy filtering was applied. Analyses were performed using a mass resolution (M/ΔM) 474 of ~2400. Single analyses consisted of 50 measurement cycles of 10B and 11B signals, using 475 counting times of 2 s. Instrumental fractionation was determined using the reference 476 materials GSD1-G, B6, GOR132-G, StHs6/80-G and BCR2-G, measured at the beginning, 477 during and end of the session (Supplementary Data). 478 479 Boron mixing model 480 Element contents for AOC and sediment and serpentinite-derived fluids are from ref.20. 481 Isotope ratios used for serpentinite fluids lie within the range of Atlantic peridotites29,37–39 482 . Depleted Mantle boron concentrations and isotope ratios are from ref.40; Nb concentrations 483 are from ref.41. Values are presented in Extended Data Table 1. Composite fluids are 484 produced by mixing the two most significant endmembers in the Lesser Antilles (AOC + 485 sediment and serpentinite derived fluid). 486 487 Shear velocity 488 The ocean-bottom seismic data analysed in this study were collected during two cruises 489 aboard the RRS James Cook42,43. We used vertical seismograms to measure the amplitude 490 and phase of ambient noise cross correlation function and teleseismic Rayleigh Waves. The 491 onshore and offshore data were corrected for instrument response, detrended and demeaned 492 prior to processing. The teleseismic data were further processed as detailed in ref.9. 493 Measurements of Rayleigh wave dispersion and estimates of the amplitude at selected period 494 were made using frequency-time analysis44,45. We measured dispersion from 18-11 s period. 495 We used up to 2486 dispersion measurements from 93 events from teleseismic Rayleigh 496 waves in the tomography. 497
498   Shear velocity tomography was performed in two steps: first the amplitude and phase data

499   were inverted for phase velocity maps46–48 and then at each location in the phase velocity

500   maps we inverted for 1D shear velocity structure to generate a 3-D volume46. For the shear

501   velocity inversion, we included the effects of the water column and sediment using a priori

502   information; our initial crustal thickness was based on Airy isostasy across the region. The

503   shear velocity inversion subsequently solved for the best fitting crustal thickness as well as

504   shear velocity.

505

506   Plate reconstruction and hydration modelling

507   a) Mapping the tectonic features

508   Our modelling of the subducted features below the Lesser Antilles is based upon the global

509   plate reconstruction of ref.13 as implemented within the software G-Plates 2.1. In this

510   reconstruction, the opening of the proto-Caribbean seaway occurs from 150 Ma through

511   symmetrical seafloor spreading between the diverging North American and South

512   America/African plates. For ease of reference, we will refer to this stage as the “proto-

513   Caribbean and central Atlantic” opening. Breakup between the South American and African

514   plates starts around 100 Ma with northward propagation from the south Atlantic. We refer to

515   this second stage of seafloor spreading as “equatorial Atlantic” opening.

516

517   Most of the proto-Caribbean oceanic lithosphere has been subducted, but there remains a

518   small segment in the south of the study area. The rifted oceanic lithosphere boundary

519   between it and the equatorial Atlantic is visible in satellite gravity to the north-west of the

520   Demerara Rise where it clearly acts as the termination point for a number of small fracture

521   zones south of Doldrums Fracture Zone (red ellipse, Extended Data Fig 1b).

522
523   We first compared major Atlantic fracture zones in the region (15-20, Marathon, Mercurius,

524   Vema and Doldrums) as detected in satellite gravity data to modelled flow lines according to

525   the Müller et al. (2019) model (Extended Data Fig 1). Overall, the largest misfit between the

526   two was ~50 km, and we assign this value to the positional uncertainty of these features (see

527   below). The geometrical relationships between the two phases of seafloor spreading are

528   particularly clear on the African side of the Atlantic, where the sediment cover is thin and the

529   full sequence preserved (compared to the sedimented and partially subducted American side).

530   The analysis showed that the southern two fracture zones (Vema and Doldrums) have only

531   just reached the Lesser Antilles trench, whereas the northern fracture zone (15-20) only

532   grazes the Lesser Antilles subduction zone. None of these three fracture zones are therefore

533   sources of hydration below the Lesser Antilles Arc.

534

535   Next we refined the location of the proto-Caribbean / equatorial Atlantic Ocean boundary

536   through time (Extended Data Fig.2) based upon two observations. 1) The oldest section of the

537   Marathon and Mercurius fracture zones can be well fitted by a flowline based entirely upon

538   relative motion between North America and Africa. Therefore, this region must have lain

539   entirely north of (or upon) the boundary between the central Atlantic and proto-Caribbean

540   prior to opening of the equatorial Atlantic. 2) The major fracture zones to the south (Vema

541   and Doldrums) can be well fitted by a flowline based entirely upon relative motion between

542   South America and Africa. In this case, the far western extent of these fracture zones (which

543   is constrained by symmetry with the clearly observable extent of fracture zones on the

544   African side) must mark the edge of the proto-Caribbean oceanic crust in order for the

545   Demerara Rise to close back against the African continental margin prior to initiation of

546   equatorial Atlantic spreading (Extended Data Fig 2a). Finally, the proto-Caribbean spreading
547   ridge was placed mid-way between the separating North and South America plates, with a

548   minimum number of transform faults inserted to satisfy the continental plate geometries.

549   Using this updated geometry for the proto-Caribbean / equatorial Atlantic boundary, and our

550   computed flowlines for the Marathon, Mercurius and unnamed proto-Caribbean fracture

551   zones, we model the subduction of these incoming plate features beneath the Caribbean plate

552   from 50 Ma through to the present day. Convergence azimuths and velocities between the

553   Caribbean plate and the Atlantic are extracted directly from the model of ref.13.

554

555   b) Projecting tectonic features onto the slab

556   To properly track the features once they enter the subduction zone and the slab begins to dip,

557   it is necessary to adjust their horizontal velocities. To do this, we use three different

558   assumptions for how the slab deforms as it enters the subduction zone. One end-member is

559   the “kinematic” approach outlined in ref.49 whereby features are assumed to follow

560   streamlines over the surface of a slab with a fixed geometry, i.e. minimal to no plate

561   stretching during subduction. We use the slab geometry of ref.30 determined using local

562   seismicity, and ref.50, which is based on teleseismic tomography, for the regions that this first

563   model does not cover. We also assume that the slab geometry remains fixed relative to the

564   Caribbean plate for the modelled time period. In the other end-member, the slab is assumed

565   to maintain its horizontal velocity and acquire an additional vertical sinking velocity, which

566   would imply some amount of plate stretching. For the plate motions of the region, the first

567   approach places incoming plate features further south than the second. We run a third, “best-

568   estimate” model that is intermediate between the two.

569

570   c) Dehydration modelling
571   As incoming plate features move into the subduction zone, they dehydrate. Major pulses of

572   subducting-plate dehydration occur9 below the forearc and at subarc depths. Forearc

573   dehydration includes the expulsion of pore fluids and the first breakdown of hydrous phases

574   in the oceanic crust, while the subarc pulse starts with the blueshist transition that initiates

575   directly below the maximum decoupling depth, below which the cool subducting plate first

576   becomes coupled to the hot convecting mantle wedge. Following ref.1 in computing phase

577   stability fields, and using the kinematic thermal model set up of ref.51 to compute a thermal

578   structure for the geometry and velocity of the Antilles slab, we predict that the first pulse of

579   dehydration extends down to about 40 km depth, and the subarc pulse peaks at a depth up to

580   100-120 km (based on preliminary tomographic models by ref.52). In a similar model for the

581   Greek subduction zone (which is similarly slow and old as the Antilles), the main

582   dehydration depth intervals agree with regions of high Vp/Vs above the slab, as expected

583   from fluid release53. Motivated by these thermal models, sub-arc observations (number of

584   Benioff zone earthquakes) and observations at the volcanic arc itself (boron isotopic

585   signature, present day volcanic output and crustal thickness) are compared at a dehydration

586   depth of 100 km, which matches the average sub-arc slab depth. Comparisons with

587   observations that reflect conditions beneath the fore-arc (forearc Vs and b-value anomalies),

588   are done at a dehydration depth of 40 km.

589

590   For this study, our interest is in lateral variations in water input. We assume that the fracture

591   zones and Atlantic-Proto-Caribbean boundary are all sources of excess slab hydration, i.e.

592   where the slab incorporates significantly larger quantities of water, mainly in the form of

593   serpentinite, than in the plate away from the fracture zones., based on observations of similar

594   structures offshore central America54. In the modelling, we apply the same Gaussian excess

595   hydration profile with a width of 15 km to all these features (i.e. in addition to the uniform
596   background). This width is informed by the lateral extent of the Vp/Vs anomaly observed

597   underneath the Marathon fracture zone on the incoming plate56. To put a very approximate,

598   order-of-magnitude estimate on the absolute values for the rate of excess hydration along the

599   arc due to the subduction of each feature, we assume that the region of anomalous Vp/Vs

600   corresponds to 50% serpentinised mantle lithosphere, and that half of this additional water is

601   released under the fore-arc and half under the arc. We only model the along strike-variations

602   in excess dehydration (i.e. we set background hydration to zero).

603

604   We ultimately use the models to calculate the relative rate of hydration along the arc over the

605   past 2 Myr for meaningful comparison with features that should depend on the present

606   day/recent dehydration below the arc and fore-arc, and over the past 25 Myr (the age of the

607   current arc) for meaningful comparison with features that should depend on the total amount

608   of water supplied to the arc (i.e. the crustal thickness). The results of these calculations are

609   presented in Extended Data Fig. 4 for a “best estimate” calculation which uses the “halfway”

610   approach to slab deformation; a “southern bound” calculation, which uses the stretched-slab

611   end member plus a 50 km shift to the south (the maximum misfit between our modelled

612   fracture zones and the actual fracture zones on the African side of the Atlantic); and a

613   “northern bound” model which uses the “minimal-stretching” approach49 plus a 50 km shift

614   to the north.

615

616   d) Key results

617   If we take the best estimate model, we predict that the dehydration peak due to the Marathon

618   and Mercurius fracture zones and the Proto-Caribbean / equatorial Atlantic plate boundary

619   lies currently underneath Dominica (solid red line). In the main article, we demonstrate that

620   this corresponds well with the peak in δ11B, sub-arc Wadati-Benioff earthquakes and volcanic
621   output. We also predict that, if these three features are dehydrating underneath the fore-arc,

622   then they would currently be doing so trenchwards of Martinique (dashed yellow line). This

623   corresponds well with anomalies in Vs at a depth of around 50 km and the b-values for

624   earthquakes in the fore-arc/plate-interface region. Looking at the full history of the arc (0-25

625   Ma: dotted blue line), there is a broad peak between Dominica and St. Kitts and Nevis; the

626   northern part of the arc. This higher rate of fluid flux in the north of the arc throughout the

627   lifetime of the current arc may have resulted in a higher long-term magmatic output and

628   therefore, a thicker crust7 if flux melting occurred. However, we cannot constrain the relative

629   contribution of flux melting versus decompression melting. There are also peaks in the

630   present-day dehydration rate and long-term dehydration rate in the far south of the arc

631   between Grenada and St. Vincent. These are due to the subduction of the unnamed proto-

632   Caribbean fracture zone, the exact position of which is more speculative than for the Atlantic

633   features. However, such features on the proto-Caribbean plate could potentially be

634   responsible for the δ 11B anomaly observed at St. Vincent.

635

636

637   References for methods

638   36. Humphreys, M. C. S., Kearns, S. L. & Blundy, J. D. SIMS investigation of electron-beam

639       damage to hydrous, rhyolitic glasses: Implications for melt inclusion analysis. Am.

640       Mineral. 91, 667–679 (2006).

641   37. Boschi, C. et al. Serpentinization of mantle peridotites along an uplifted lithospheric

642       section, Mid Atlantic Ridge at 11° N. Lithos 178, 3–23 (2013).

643   38. Boschi, C., Dini, A., Früh-Green, G. L. & Kelley, D. S. Isotopic and element exchange

644       during serpentinization and metasomatism at the Atlantis Massif (MAR 30°N): Insights

645       from B and Sr isotope data. Geochim. Cosmochim. Acta 72, 1801–1823 (2008).
646   39. Spivack, A. J. & Edmond, J. M. Boron isotope exchange between seawater and the

647      oceanic crust. Geochim. Cosmochim. Acta 51, 1033–1043 (1987).

648   40. Marschall, H. R. et al. The boron and lithium isotopic composition of mid-ocean ridge

649      basalts and the mantle. Geochim. Cosmochim. Acta 207, 102–138 (2017).

650   41. Workman, R. K. & Hart, S. R. Major and trace element composition of the depleted

651      MORB mantle (DMM). Earth Planet. Sci. Lett. 231, 53–72 (2005).

652   42. Collier, J. S. VOILA - Volatile recycling in the Lesser Antilles arc: RRS James Cook

653      cruise report JC133. 79

654      https://www.bodc.ac.uk/resources/inventories/cruise_inventory/reports/jc133.pdf (2015).

655   43. Collier, J. S. VOILA - Volatile recycling in the Lesser Antilles arc: RRS James Cook

656      cruise report JC149. 161

657      https://www.bodc.ac.uk/resources/inventories/cruise_inventory/reports/jc149.pdf (2017).

658   44. Landisman, M., Dziewonski, A. & Satô, Y. Recent Improvements in the Analysis of

659      Surface Wave Observations. Geophys. J. Int. 17, 369–403 (1969).

660   45. Levshin, A. L. & Ritzwoller, M. H. Automated Detection, Extraction, and Measurement

661      of Regional Surface Waves. in Monitoring the Comprehensive Nuclear-Test-Ban Treaty:

662      Surface Waves (eds. Levshin, A. L. & Ritzwoller, M. H.) 1531–1545 (Birkhäuser Basel,

663      2001). doi:10.1007/978-3-0348-8264-4_11.

664   46. Harmon, N. & Rychert, C. A. Joint inversion of teleseismic and ambient noise Rayleigh

665      waves for phase velocity maps, an application to Iceland: Noise-Teleseismic Phase

666      Velocity Maps. J. Geophys. Res. Solid Earth 121, 5966–5987 (2016).

667   47. Forsyth, D. W. & Li, A. Array analysis of two-dimensional variations in surface wave

668      phase velocity and azimuthal anisotropy in the presence of multipathing interference.

669      Seism. Earth Array Anal. Broadband Seism. 157, 81–97 (2005).
670   48. Yang, Y. & Forsyth, D. W. Regional tomographic inversion of the amplitude and phase

671       of Rayleigh waves with 2-D sensitivity kernels. Geophys. J. Int. 166, 1148–1160 (2006).

672   49. Harmon, N. et al. Mapping geologic features onto subducted slabs. Geophys. J. Int. 219,

673       725–733 (2019).

674   50. Brazuz, B. 3D teleseismic travel time tomography along the Lesser Antilles subduction

675       zone. (Karlsruhe Institute of Technology, Faculty of Physics, Geophysical Institute,

676       2019).

677   51. Perrin, A. et al. Reconciling mantle wedge thermal structure with arc lava

678       thermobarometric determinations in oceanic subduction zones. Geochem. Geophys.

679       Geosystems 17, 4105–4127 (2016).

680   52. Hicks, S. P. et al. Evidence for an Anomalously Large Cold Mantle Wedge Corner of the

681       Caribbean Plate in the Lesser Antilles Subduction Zone. in AGU Fall Meeting 2019

682       (AGU, 2019).

683   53. Halpaap, F. et al. Earthquakes track subduction fluids from slab source to mantle wedge

684       sink. Sci. Adv. 5, eaav7369 (2019).

685   54. Avendonk, H. J. A. V., Holbrook, W. S., Lizarralde, D. & Denyer, P. Structure and

686       serpentinization of the subducting Cocos plate offshore Nicaragua and Costa Rica.

687       Geochem. Geophys. Geosystems 12, (2011).

688   55. Sandwell, D. T., Müller, R. D., Smith, W. H. F., Garcia, E. & Francis, R. New global

689       marine gravity model from CryoSat-2 and Jason-1 reveals buried tectonic structure.

690       Science 346, 65–67 (2014).

691

692

693

694
695   Extended Data

696

697   Extended Data Fig. 1. a) Modelled fracture zones in the central Atlantic, overlain on an

698   oceanic crust age grid from ref.13. Coloured stars denote conjugate points associated with

699   opening of the equatorial Atlantic at either end of the Vema (green) and Doldrums (yellow)

700   fracture zones and between the Demerara rise and African continental margin (red). b)

701   Modelled fracture zones overlain on satellite free-air gravity55. Red ellipse marks the location

702   of the proto-Caribbean / Atlantic boundary.

703

704   Extended Data Fig. 2. Snap shot of modified plate reconstruction at 50Ma13. Velocity

705   vectors (coloured by plate) shown are relative to the mantle reference frame. The figure

706   shows the four sources of dehydration from the subducted slab over the past 25 Ma

707   considered here ((i) Marathon FZ; (ii) Mercurius FZ; (iii) proto-Caribbean/ equatorial

708   Atlantic boundary and (iv) unnamed FZ formed during proto-Caribbean opening – labelled

709   PCFracture Zone)

710

711   Extended Data Fig. 3. All melt inclusion δ11B values measured in this study versus

712   indicators of fluid composition (a, b), and differentiation (c-e). No clear observable trends are

713   shown between islands, indicating that these differences are largely controlled by the mantle

714   source.

715

716   Extended Data Fig. 4. The average rate of excess-dehydration (above a uniform

717   background), resulting from the subduction of fracture zones and the proto-Caribbean /

718   Atlantic plate boundary, along the arc from 11o N to 18o N over the past 2 Myr (red solid

719   curve) and 25 Myr (blue dotted curve), and below the fore-arc over the past 2 Myr (dashed
720   yellow line). The pattern of relative distribution of dehydration is robust, constrained by the

721   history of fracture-zone/plate-boundary subduction, but the absolute values of the

722   dehydration rates should be treated with caution, as they depend strongly on the simple model

723   assumptions of the level of hydration and relative strength of fore- and sub-arc dehydration.

724   Panel (a) is the best estimate (b) is the “northern bound” end-member and (c) is the “southern

725   bound” (see text for details).

726

727   Extended Data Table 1. δ11B values, B concentrations, and Nb/B of sources of fluids used in

728   the mixing model (Fig. 3).
Trenc
20˚                                         h          −8        −6       −4       −2        0
                                                                  Bathymetry (km)

                             100 km    Statia
                 200 km          St Kitts     Antigua
                                                                      1520 F
         300 k                               Montserrat                      Z
                 m
      pr                                         Guadeloupe
        ot
          o-                                                                     Equatorial Atlantic
               Ca                     Dominica
15˚               r   ib                                                             lithosphere
                        be            Martinique                          Marathon F
                           an                                                            Z
                                FZ                  St Lucia                                 Mercurius FZ
                                       St Vincent
                                                            Barbados                    Vema
                                                                                             FZ
                                                 Grenada
                                                               Pr             Dold
                                           LAA                    ot               rum
                                                                                       s FZ
                                                                    o
                                                               lit -C
                                                                  ho a
10˚                                                                  sp rib
                                                                       he be
                            South                                        re an
                           America
                                                                                          Demerara
                                                                                           Plateau

                  −65˚                               −60˚                           −55˚
18˚N
18˚
15 2 B/Nb
Statia 0F 20
Z
St Kitts 15
Redonda
10
Montserrat Guadeloupe
5
Equatorial Atlantic 16˚N
16˚ lithosphere
Ma
rath
Me o nF
Dominica rcu Z
rius
FZ
Martinique
un
na Ve
14˚ m St Lucia ma 14˚N
(p ed FZ
ro FZ
to
-C
ar St Vincent SiO2 (wt%)
ib 80
be
an P. Mustique
) 70
Proto-Caribbean 60
12˚ Grenada lithosphere 12˚N
Bathymetry (m)
50
−6000 −5000 −4000 −3000 −2000 −1000 0
-64˚ -62˚ -60˚ 0 2.5 5.0 7.5 10 0 10 20 30 40 -10 -5 0 +5 +10
H2O (wt%) B/Nb δ11B (‰)15
Statia
north
Serpentinite derived fluid St. Kitts
5% 2% 1%
0.5% Redonda
Montserrat
10
Guadeloupe
central
>60%
0.1% Dominica
>60%
Martinique
0.05%
St. Lucia
30-60%
5
south
St. Vincent
δ B (‰)
Petite Mustique
30-60% Grenada
11
0.02%
0b-value no. of earthquakes crustal thickness (km)
60% 0 20 40 60 20 30 40
18˚N 18˚N
(a) serpentine signature (b) (c) (d) (e) (f) (g)
Statia
St. Kitts
Montserrat
Guadeloupe
16˚N 16˚N
Dominica
Martinique
14˚N 14˚N
St. Lucia
St. Vincent
12˚N 12˚N
Grenada
-10 -5 0 +5 +10 0 50 100 150 0.1 1 10 100
shear velocity (km s-1)
δ11B (‰) Rate of water released from slab above uniform DREV (km3)
background level (kg/m)/yrYou can also read