Topic Model or Topic Twaddle? Re-evaluating Semantic Interpretability Measures
←
→
Page content transcription
If your browser does not render page correctly, please read the page content below
Topic Model or Topic Twaddle? Re-evaluating Semantic Interpretability
                              Measures

                  Caitlin Doogan                                      Wray Buntine
         Faculty of Information Technology                  Faculty of Information Technology
           Monash University, Australia                       Monash University, Australia
        caitlin.doogan@dmonash.edu                          wray.buntine@dmonash.edu

                     Abstract                            Tws (Nerghes and Lee, 2019), the corresponding
                                                         Tdc (Maier et al., 2018), or both (Törnberg and
     When developing topic models, a critical ques-      Törnberg, 2016). Since meaning requires topics
     tion that should be asked is: How well will this
                                                         to be interpretable to humans, empirical assurance
     model work in an applied setting? Because
     standard performance evaluation of topic inter-     is needed to confirm a novel topic models’ capac-
     pretability uses automated measures modeled         ity to generate “semantically interpretable” topics,
     on human evaluation tests that are dissimilar       as well as a method to guide model selection and
     to applied usage, these models’ generalizabil-      other parameters such as the number of topics, K.
     ity remains in question. In this paper, we probe    This is often achieved by calculating the coherence
     the issue of validity in topic model evaluation     scores for Tws (Lau and Baldwin, 2016)
     and assess how informative coherence mea-
     sures are for specialized collections used in an
                                                            Recent literature contradicts previous evalua-
     applied setting. Informed by the literature, we     tions of some short-text topic models that claim su-
     propose four understandings of interpretability.    perior  interpretability (Li et al., 2018; Eickhoff and
    We evaluate these using a novel experimental         Wieneke, 2018; Bhatia et al., 2017). Such rethink-
     framework reflective of varied applied settings,    ing flows from the fact there is no agreement on the
     including human evaluations using open label-       best measure of interpretability (Lau et al., 2014b;
     ing, typical of applied research. These evalu-      Morstatter and Liu, 2017) and is compounded by
     ations show that for some specialized collec-
                                                         the unclear relationship between human evaluation
     tions, standard coherence measures may not
     inform the most appropriate topic model or          methodologies and automated coherence scores
     the optimal number of topics, and current in-       (Lau   et al., 2014b). Finally, despite assurances
     terpretability performance validation methods       of generalizability and applicability, topic model
     are challenged as a means to confirm model          evaluations in machine learning are conducted in
     quality in the absence of ground truth data.        experimental settings that are not representative
                                                         of typical applied use. This raises questions of
1 Introduction                                           whether coherence measures are suitably robust to
Topic modeling has become a popular tool for ap- measure topic interpretability and inform model
plied research such as social media analysis, as         selection in applied settings, particularly with chal-
it facilitates the exploration of large document- lenging datasets like that of social media.
collections and yields insights that would not be           Advances in topic modeling for static document-
accessible by manual methods (Sinnenberg et al., collections have produced non-parametric ap-
2017; Karami et al., 2020). However, social media        proaches such as HDP-LDA, which employ sophis-
data can be challenging to model as it is both sparse    ticated hierarchical priors that allow for different
and noisy (Zhao et al., 2011). This has resulted in      prior proportions (Teh et al., 2006). Non-negative
increased demand for short-text topic models that        matrix factorization (Zhou and Carin, 2015), the
can handle these challenges (Lim et al., 2013; Zuo       use of word embeddings, and neural network meth-
et al., 2016; Chen et al., 2015).                        ods (Zhao et al., 2021) are a few of these other
   Topic word-sets, denoted Tws , are considered to      innovations.
be semantically related words that represent the la-        To support these advances, it is crucial to estab-
tent component of the underlying topic’s document- lish the robustness of topic modeling interpretabil-
collection, denoted Tdc . Meaning is derived from        ity measures, especially given the growing trend
these topics through the interpretation of either the    towards evaluating topic models using coherence
                                                      3824
                        Proceedings of the 2021 Conference of the North American Chapter of the
              Association for Computational Linguistics: Human Language Technologies, pages 3824–3848
                           June 6–11, 2021. ©2021 Association for Computational Linguistics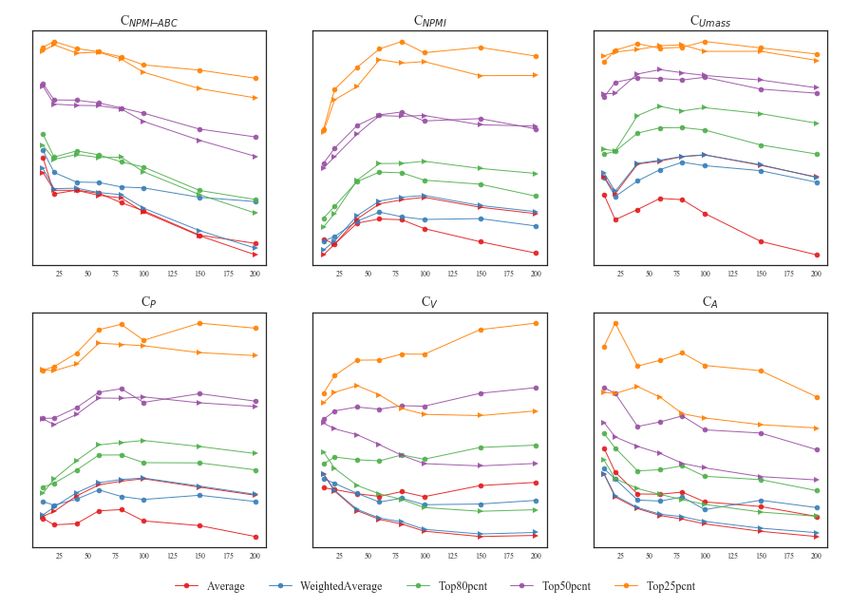
measures, often in the absence of perplexity or                  viously reported factors (Morstatter and Liu,
other predictive scores (?). Additionally, increas-              2017; Lau and Baldwin, 2016), on coherence
ingly sophisticated methods for automatic topic                  measures for many topics across four variant
labeling have been developed. Beginning with Lau                 datasets and two topic models.
et al. (2011), this research relies on models which
                                                              4. Provide evidence to show that interpretability
generate interpretable topics. While these advances
                                                                 measures for evaluating Tws and Tdc for ap-
enhance the technologies available to conduct ap-
                                                                 plied work in specialized contexts (e.g., Twit-
plied research, they do not address the underlying
                                                                 ter) are ill-suited and may hinder model devel-
question of whether topic interpretability can be
                                                                 opment and topic selection.
adequately assessed using coherence measures.
   In this paper, we demonstrate a research gap in        The remainder of this paper is organized as follows.
topic model evaluation methods in light of their          Section 2 provides a review of related work around
growing use in specialized settings. Previously de-       the interpretability of topic models. Section 3 de-
clared state-of-the-art models are under-performing       scribes five propositions that have informed the
in applied settings (Li et al., 2018; Arnold et al.,      design of interpretable topic models and their eval-
2016), and little work has been done to improve           uation measures. This is followed by a description
application relevance (Hecking and Leydesdorff,           of the experimental framework we designed to test
2019). Following the work of (Lau and Baldwin,            these propositions. Section 4 provides the results
2016; Bhatia et al., 2017; Hecking and Leydesdorff,       of these evaluations and Section 5 contains a dis-
2019), this study examines whether coherence is a         cussion of findings.
valid predictor of topic model interpretability when
                                                          2     Background
interpretability is defined as more than just the abil-
ity to label a Tws , and as the diversity of topic        This section provides a brief overview of work re-
models, datasets and application tasks increases.         lated to interpretability evaluation, followed by a
   Earlier research has established a correlation be-     review of the challenges associated with coherence
tween novel coherence measures and human rank-            optimization for specialized contexts.
ing of interpretability, as measured by qualitative
                                                          2.1    Topic Model Interpretability
tests (Cheng et al., 2014; Newman et al., 2010a).
However, since bounded experimental settings con-     Topic model interpretability is a nebulous concept
strain these tests, they are unlikely to reliably and (Lipton, 2018) related to other topic model quali-
consistently indicate topic quality in applied re-    ties, but without an agreed-upon definition. Mea-
search settings. As a result, we ask the following    sures of semantic coherence influence how easily
question: To what extent can we rely on current       understood the top-N Tws are (Morstatter and Liu,
coherence measures as proxies for topic model in-     2017; Lund et al., 2019; Newman et al., 2010a;
terpretability in applied settings?                   Lau et al., 2014b). This is also referred to as topic
   This work has significant practical implications.  understandability (Röder et al., 2015; Aletras et al.,
It signals the need to re-develop interpretability    2015).
measures and reappraise best-practice for validat-       A coherent topic is said to be one that can be
ing and evaluating topic models and their applica-    easily labeled and thus interpreted (Newman et al.,
tions. Our research contributes the following:        2011; Morstatter and Liu, 2017), but only if the
                                                      label is meaningful (Hui, 2001; Newman et al.,
  1. Introduces a novel human-centered qualita- 2010b,a). Some have modeled coherence measures
     tive framework for evaluating interpretability   based on topic meaningfulness (Lau et al., 2014a);
     in model development that mimics those pro- others state that a meaningful topic is not neces-
     cesses seen in applied settings.                 sarily a useful one (Boyd-Graber et al., 2015). In-
  2. Demonstrates that the ranking of topic quality   deed, the literature remains divided over whether
     using state-of-the-art coherence measures is     usefulness is a property of an interpretable topic
     inconsistent with those produced through vali- (Röder et al., 2015), or if interpretability is a prop-
     dation tasks performed in an applied setting.    erty of a useful topic (Aletras and Stevenson, 2013;
                                                      Newman et al., 2010b). Such terminological dis-
  3. Systematically quantifies the impact of model    agreement suggests that there are challenges to the
     behavior, dataset composition, and other pre- progression of this area of research.
                                                   3825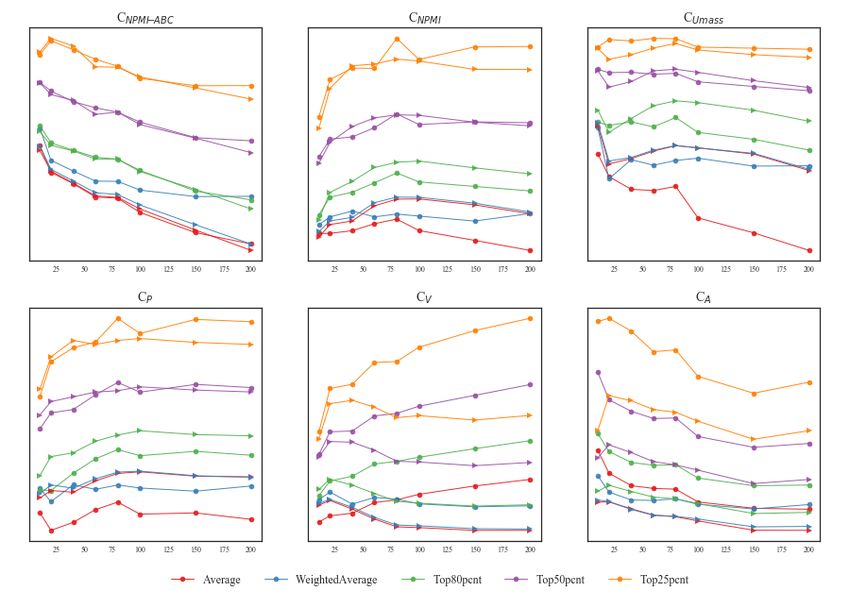
The ease of labeling a topic is assumed to be          dings of the top-N Tws . Human evaluation tasks
an expression of how coherent that topic is and           have also been created to measure how representa-
thus its degree of interpretability. This assump-         tive a topic model is of the underlying Tdc (Chang
tion is challenged when annotators provide differ-        et al., 2009; Bhatia et al., 2017; Morstatter and Liu,
ent labels for a topic. Morstatter and Liu (2017)         2017; Alokaili et al., 2019; Lund et al., 2019).
presented interpretability from the perspective of
both coherence and consensus, where consensus             2.3   Practical Applications
is a measure of annotator agreement about a top-          Within computer science, topic modeling has been
ics’ representation in its Tdc . Alignment is how         used for tasks such as word-sense disambiguation
representative a topic is of its Tdc and is another       (Boyd-Graber and Blei, 2007), hierarchical infor-
understanding of interpretability (Ando and Lee,          mation retrieval (Blei et al., 2003), topic correla-
2001; Chang et al., 2009; Mimno et al., 2011; Bha-        tion (Blei and Lafferty, 2007), trend tracking (Al-
tia et al., 2017; Alokaili et al., 2019; Morstatter and   Sumait and Domeniconi, 2008), and handling short-
Liu, 2017; Lund et al., 2019). However, the proba-        texts (Wang et al., 2018). Outside of computer
bilistic nature of topic models impede this measure.      science, topic modeling is predominantly used to
The ambiguity of interpretability as a performance        guide exploration of large datasets (Agrawal et al.,
target raises questions about how topic models are        2018), often with a human-in-the-loop approach.
used and evaluated.                                       Here topics are generated before some form of
                                                          qualitative method is used to gain insights into
2.2   Related Work                                        the data. These methods include exploratory con-
                                                          tent analysis (Korenčić et al., 2018), critical dis-
Following the seminal work of Chang et al. (2009),
                                                          course analysis (Törnberg and Törnberg, 2016),
the development of coherence measures and the
                                                          digital autoethnography (Brown, 2019), grounded
human evaluation tasks that guide their design has
                                                          theory (Baumer et al., 2017), and thematic analysis
been actively pursued (Newman et al., 2010a; Bha-
                                                          (Doogan et al., 2020; Andreotta et al., 2019).
tia et al., 2017, 2018; Morstatter and Liu, 2017;
                                                             Qualitative techniques make use of topics in dif-
Lau and Baldwin, 2016; Lund et al., 2019; Alokaili
                                                          ferent ways. “Open labeling” of topics by Subject
et al., 2019). Newman et al. (2010a) showed that
                                                          Matter Experts (SME) is followed by a descriptive
human ratings of topic coherence (observed co-
                                                          analysis of that topic (Kim et al., 2016; Morstat-
herence) correlated with their coherence measure
                                                          ter et al., 2018; Karami et al., 2018). However,
when the aggregate Pointwise Mutual Information
                                                          this method is subjective and may fail to produce
(PMI) pairwise scores were calculated over the
                                                          the depth of insight required. Supplementing a
top-N Tws . In addition to the word intrusion task
                                                          topic analysis with samples from the Tdc increases
(Chang et al., 2009), Mimno et al. (2011) validated
                                                          the depth of insight (Eickhoff and Wieneke, 2018;
their coherence measure for modeling domain-
                                                          Kagashe et al., 2017; Nerghes and Lee, 2019). Al-
specific corpora using expert ratings of topic qual-
                                                          ternatively, the Tdc alone cam be used for in-depth
ity. The measure takes the order of the top-N Tws
                                                          analysis (Törnberg and Törnberg, 2016). However,
into account using a smoothed conditional proba-
                                                          human evaluation tasks that require open labeling
bility derived from document co-occurrence counts.
                                                          are not generally used to validate new coherence
This performance was further improved by substi-
                                                          measures (O’Callaghan et al., 2015; Korenčić et al.,
tuting PMI for Normalized PMI (CNPMI ) (Aletras
                                                          2018).
and Stevenson, 2013; Lau et al., 2014b). Aletras
and Stevenson (2013) used crowdsourced ratings of
                                                       3 Evaluating Interpretability
topic usefulness to evaluate distributional semantic
similarity methods for automated topic coherence. We have generated five propositions about the rela-
Röder et al. (2015) conducted an exhaustive study      tionship between coherence scores, human evalua-
evaluating prior work and developing several im- tion of topic models, and the different views of in-
proved coherence measures.                             terpretability to explore the research question. We
   Similarly, Ramrakhiyani et al. (2017) made use      conduct five experiments to interrogate these propo-
of the same datasets and evaluations and presented     sitions and re-evaluate how informative coherence
a coherence measure which is approximated with         measures are for topic interpretability. Because
the size of the largest cluster produced from embed- we are evaluating existing coherence measures, we
                                                    3826
do not employ automatic topic labeling techniques.      pretability. A robust way to measure agreement on
Instead, we make use of human evaluation tasks          a topic label is needed. Inter-coder reliability (ICR)
that reflect those conducted in applied settings.       measures are an appropriate means to achieve this.
Proposition 1. If coherence scores are robust, they     Proposition 4. An interpretable topic is one where
should correlate. The battery of coherence mea-         the document-collection is easily labeled. The
sures for evaluating novel topic models and auto-       investigation of topic document-collections is an
mated labeling approaches are inconsistent across       emerging trend in the applied topic modeling liter-
the literature. Each new measure claims superior        ature. In these studies, authors have either used a
alignment to topic model interpretability. As these     topics “top documents” to validate or inform the
measures are evolutionary (Röder et al., 2015), and     labels assigned to Tws (Kirilenko et al., 2021), or
there is no convention for which measure should         have ignored the Tws in favor of qualitative analy-
be used, particularly as a standard measure of qual-    sis of the richer Tdc (Doogan et al., 2020). The use
itative performance (Zuo et al., 2016; Zhao et al.,     of topic modeling for the exploration of document-
2017; Zhang and Lauw, 2020), they are consid-           collections requires a Tdc to be coherent enough
ered notionally interchangeable. Thus, we would         that a reader can identify intertextual links between
expect that there would be some correlation be-         the documents. The label or description given to
tween these measures. However, previous studies         the Tdc results from the readers’ interpretation of
have not considered the impact that the data type       individual documents relative to the other docu-
or model has on the coherence scores. Particularly      ments in the collection. Tdc that have a high degree
for non-parametric models, these issues may be          of similarity between their documents will be eas-
compounded by how coherence measures are pre-           iest to interpret and therefore label. The ease of
sented as an aggregate, e.g., The presentation of the   labeling a Tdc decreases as the documents become
top-N models. Indeed, studies reporting multiple        more dissimilar.
coherence measures have demonstrated inconsis-          Proposition 5. An interpretable topic word-set is
tencies at the model-level that are obscured during     descriptive of its topic document-collection. The
reporting (Blair et al., 2020).                         alignment of Tws to Tdc is an expected property
Proposition 2. An interpretable topic is one that       of a “good” topic (Chang et al., 2009), which hu-
can be easily labeled. How easily a topic could         man evaluation tasks have been developed to as-
be labeled has been evaluated on an ordinal scale       sess. Typically these tasks ask annotators to choose
where humans determined if they could hypothet-         the most and/or least aligned Tws to a given docu-
ically give a topic a label (Mimno et al., 2011;        ment (Morstatter and Liu, 2017; Lund et al., 2019;
Morstatter and Liu, 2017). However, humans are          Alokaili et al., 2019; Bhatia et al., 2018), identify
notoriously poor at estimating their performance,       an intruder topic (Chang et al., 2009; Morstatter
particularly when they are untrained and do not         and Liu, 2017), rate their confidence in a topic-
have feedback on their performance (Dunning et al.,     document pair (Bhatia et al., 2017), or select appro-
2003; Morstatter and Liu, 2017). Thus, a rater’s        priate documents given a category label (Aletras
perception of whether they could complete a task        et al., 2017). However, none of these methods ad-
is actually less informative than having them com-      dress the need for the topic document-collection to
plete the task.                                         be evaluated and labeled. Furthermore, they gener-
Proposition 3. An interpretable topic has high          ally use one document and/or are not comparable
agreement on labels. Agreement on a topic la-           to applied tasks.
bel is considered a feature of interpretability by
                                                        3.1   Data
Morstatter and Liu (2017), who propose “consen-
sus” as a measure of interpretability. A high level    The Auspol-18 dataset was constructed from
of agreement on topic labels, particularly in crowd-   1,830,423 tweets containing the hashtag #Auspol,
sourcing tasks, is seen as a means to infer that a     an established Twitter forum for the discussion of
Tws is interpretable. However, in applied tasks, a     Australian politics. The diminutives, slang, and
topic is described in a sense-making process result-   domain-specific content provide a realistic exam-
ing in one coherent label. Thus, the consensus task    ple of a specialized context. Four versions of the
is not necessarily a reasonable means to infer inter-  dataset were constructed from a subset of 123,629
                                                       tweets; AWH (contains the 30 most frequent hash-
                                                    3827
tags), AWM (contains the 30 most frequent men- CNPMI-ABC , which is calculated using a collection
tions of verified accounts), AWMH (contains the of 760k Australian Broadcasting Company (ABC)
30 most frequent hashtags and 30 most frequent news articles4 with 150 million words (enough to
mentions of verified accounts), and AP (contains make the CNPMI scores stable), and CNPMI-AP cal-
neither hashtags nor mentions). Pre-processing culated using the AP dataset and is used to test
included stopword removal, POS-tagging, lemma- CNPMI but with statistics drawn from the training
tization, exclusion of non-English tweets, dupli- data. We report the average scores and the standard
cate removal, removal of tokens with a frequency deviations over five random runs.
n < 10, and removal of tweets with n < 5 to-
kens, and standardization of slang, abbreviations 3.4 Qualitative Experiments
(Agrawal et al., 2018; Doogan et al., 2020) 1 . A primary concern in machine learning research
is the need to establish model performance. Fol-
3.2 Models and Parameters lowing the recent trend to analyze Tdc , we devised
To investigate interpretability in an applied setting, qualitative tests for the assessment of whether the
we compare LDA to MetaLDA (Zhao et al., 2017), Tws and Tdc were adequately aligned and whether
a recent non-parametric topic model designed to current performance measures are informative of
improve short-text topic modeling by leveraging this alignment. We also tested to see if there is a
the incorporation of the document and word meta- relationship between topic alignment and the topic
information using word embeddings as well as non- diagnostic statistics; effective number of words5 ,
parametrically learning topic proportions. Despite and topic proportion, denoted Dew and Dtp , respec-
the many extensions to LDA, the vanilla model tively.
maintains popularity among applied researchers Topic Word-sets: Four SMEs were recruited from
(Sun et al., 2016), and as the baseline model, it is a multidisciplinary pool of researchers who were
necessary to compare LDA with a model purpose- representative of the political-ideological spectrum
built for short-text applications. MetaLDA is one and who were Australian English speakers. They
reasonable representative of such models and has were shown the same topics consisting of the top-
demonstrated effectiveness on Twitter data for ap- 10 words ranked by term frequency that were gen-
plied work (Doogan et al., 2020). The extensive erated by LDA and MetaLDA on AP, AWH, and
effort of human labeling in our experiments (see AWM for K=10–60 topics6 , producing a total of
Section 3.4) precludes us from adding more models. 3,120 labels (780 for each SME) generated for the
LDA and MetaLDA are available in the MetaLDA 390 topics (130 per model-dataset combination).
package2 , which is implemented on top of Mallet Their task was to provide a descriptive label for
(McCallum, 2002). each Tws and to use ‘NA’ if they were unable to
Default parameter settings were used for both provide a label. Appendix A provides an exam-
LDA and MetaLDA. We use Glove2Vec em- ple of this task. Two measures were constructed
beddings trained on the Wikipedia corpus (Pen- from these labels. The first was the number of
nington et al., 2014) for MetaLDA. We con- raters able to label the topic, a count between 0–4
structed topic sets with the number of topics K = denoted Qnbr . The second was a simple ICR mea-
{10, 40, 20, 60, 80, 100, 150, 200}. sure, Percentage Agreement denoted Qagr , which
3.3 Coherence Measures calculated as the number of times a set of annota-
tors agree on a label, divided by the total number
Several coherence measures were evaluated. These of annotations, as a percentage.
were CUmass (Mimno et al., 2011), CV , CP (Röder
et al., 2015), CA and CNPMI (Aletras and Steven- Topic Document-collections: Two SMEs ana-
son, 2013). These were calculated for each topic lyzed the Tdc s of the 60 topics each modeled by
using the Palmetto package3 using the top ten most LDA and MetaLDA on the AP dataset, referred to
frequent words. Along with the default CNPMI , hereafter as the qualitative set. Samples of Tdc gen-
which is calculated using Wikipedia, we introduced erated by each model (K=10–60) were reviewed,
and those generated from both models 60-topic sets
1
Tweet IDs and pre-processing details are available at:
4
https://github.com/wbuntine/auspoldata http://www.abc.net.au/news/archive
2
https://github.com/ethanhezhao/MetaLDA 5
~, this is e−Entropy(~p) .
For word proportion vector p
3 6
http://aksw.org/Projects/Palmetto.html The AWMH dataset was not included.
3828were found to be of equal or higher quality than for such tasks(Aletras and Stevenson, 2013; New-
those produced by other values of K. man et al., 2010a) as it is unaffected by variability
The SMEs reviewed the top-30 tweets represen- in the range for each dataset (Lau et al., 2014b).
tative of a topic and provided a label for each tweet.
They then inductively determined a label or phrase 4 Results
describing that Tdc . They noted any key phrases,
Here we detail the results of our analysis of the five
names, or other terms that were consistent across
propositions about interpretability evaluation.
the collection. The SMEs were experienced at an-
notating such datasets and were familiar with the 4.1 Evaluation 1: Coherence Measure
online #Auspol community. The SMEs then dis- Correlations
cussed the results together and agreed on a final
label for each Tdc . As per proposition 1, coherence measures should
The SMEs were asked to rate on a scale of 1–3 be robust and highly correlated. To test this proposi-
how difficult it was to label each Tdc , where 1 was tion, we conducted a Pearson’s correlation analysis
difficult, 3 was easy, and 0 was where a label could of paired coherence measures calculated for K=10–
be assigned. This qualitative statistic is denoted 60 for each model-dataset combination. Pooling
Qdif . The researchers then scored, on a scale of the results for K and the three datasets, we calcu-
1–5, the degree of alignment between topic labels late the xr for LDA and MetaLDA.
and the labels assigned to their corresponding col- CNPMI and CP scores were strongly correlated
lections. A score of 5 indicated the labels were for all datasets. Ranging from xr =0.779–0.902
identical, and a score of 0 indicated the Tws and/or for LDA, and xr =0.770–0.940 for MetaLDA.
Tdc was incoherent. This statistic is denoted Qaln . CNPMI and CNPMI-ABC also showed a moderate-
Examples of these tasks are in Appendix A. to-strong correlation for all datasets with LDA
ranging from xr =0.719–0.769, and MetaLDA from
3.5 Statistical Tests xr =0.606–0.716. CNPMI-ABC appears more sensi-
tive to changes in K than CP . No significant trends
We measure the strength of the association between were seen between other coherence measures cal-
variables using Pearson’s r correlation coefficient culated for any dataset. These results are reported
in evaluation 1 (see section 4.1) and Spearman’s ρ in Appendix B.
correlation coefficient in evaluations 2–5 (see sec- Methods to aggregate coherence scores may
tions 4.2, 4.3, 4.4, and 4.5). Pearson’s r is used in mask any differences in the models’ behaviors as
the few papers that evaluate coherence scores over K increases. To test this, aggregate coherence mea-
the same datasets (Röder et al., 2015; Lau et al., sures, typical of the empirical evaluation of topic
2014b). The practical reason for using Pearson’s models, were calculated per value of K. These
r for our evaluation of proposition 1 was to make were the mean of all topics (Average), the mean
valid comparisons with these studies. The statisti- for all topics weighted by the topic proportion
cal justification for using Pearson’s r (rather than (WeightedAverage), and the mean of the Top-N
Spearman’s ρ) is that the datasets are continuous percent of ranked topics by coherence score (Top-
(neither is ordinal, as Spearman’s ρ requires) and Npcnt), where N = {25, 50, 80}.
believed to have a bivariate normal distribution.7
Both models showed trends in aggregated co-
Spearman’s ρ is only appropriate when the relation-
herence scores calculated on the AP dataset. As
ship between variables is monotonic, which has
shown in Figure 1, the peak for each measure varies
not been consistently demonstrated for coherence
according to different values of K and between
(Röder et al., 2015; Bovens and Hartmann, 2004).
models. For instance, aggregates of both models
Spearman’s ρ is appropriate to assess the associ-
CNPMI and CNPMI-ABC peak at 60 and 10 topics,
ation between coherence scores and human judg-
respectively. However, CV aggregate peaks are
ments in evaluations 2–5 8 . It is a preferred method
completely divergent between models, K=200 for
7
We confirmed this with a Kolmogorov-Smirnov test for MetaLDA and K=50 for LDA. Indeed, the two
normality on the coherence scores. models favored different coherence measures and
8
Although Kendall’s τ has been used for similar evalu- aggregate methods. Generally, MetaLDA exhibits
ations (Rosner et al., 2013), it is unreliable when the range
of each dataset varies significantly as in these experiments superior performance across all aggregates for
(Sanderson and Soboroff, 2007). CV and CA , while LDA is superior for CUmass . No-
3829aLDA significantly outperforms LDA in CNPMI for
smaller K on average but loses out for larger K.
Results from our qualitative analysis confirmed this
occurred because LDA had many less frequent top-
ics (e.g., when K = 60, all topics occur about 1/60
of the time), unlike MetaLDA, which mixes more
and less frequent topics.
4.2 Evaluation 2: Labeling Topic Words-sets
Proposition 2 states that if topics can be labeled
they are interpretable. Coherence as a measure of
interpretability should then be predictive of topics
that can be labeled. To evaluate this proposition,
a Spearman’s ρ correlation coefficient was used
to assess the relationship between coherence mea-
sures and the number of raters able to label the
Tws , Qnbr , for each of the 130 topics produced
per model-dataset combination. These results are
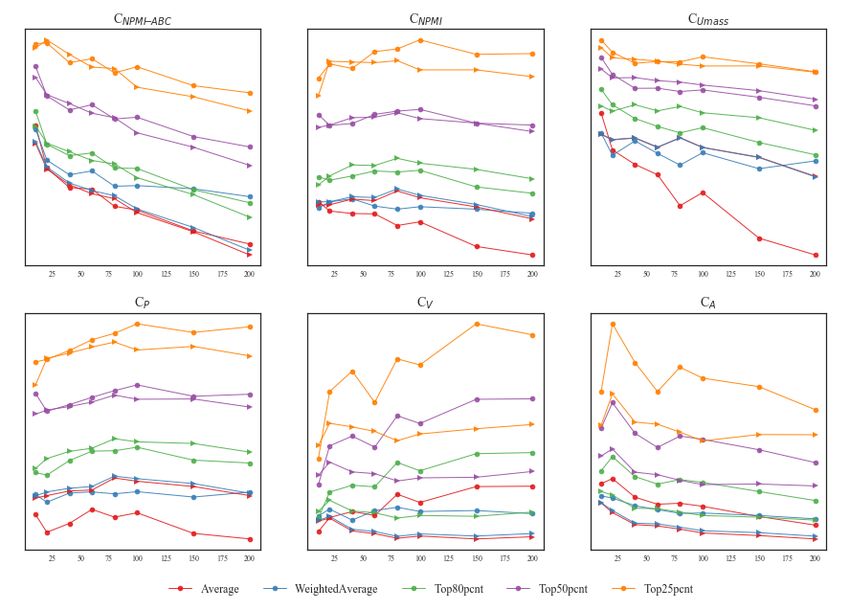
Figure 1: Comparison of LDA (triangle) and MetaLDA available in Appendix C. There was no significant
(circle) aggregated coherence scores for the AP dataset.
correlation between any coherence measure and
Scores are shown on the y-axis, and K is shown on the
x-axis. Individual points are averaged across five runs, Qnbr . Interestingly, the SMEs reported several top-
where the typical sample standard is 0.005, but up to ics they could not label despite their high coherence
0.010 for K=20. scores. For instance, the LDA modeled topic “red,
wear, flag, blue, gold, black, tape, tie, green, iron”
could not be labeled despite being the 9th /60 high-
tably, MetaLDA shows superior CNPMI , CNPMI-ABC , est ranked topic for CNPMI .
CNPMI-AP scores for Top20pcnt, Top50pcnt, and
Top80pcnt aggregations, but is inferior when the 4.3 Evaluation 3: Topic Label Agreement
full average of these scores is calculated. Other Proposition 3 states an interpretable topic is one
datasets are broadly similar and shown in Ap- where there is high agreement between annotators
pendix B. on its label. As such, coherence should align to
We also compare MetaLDA with LDA. Pool- measures of consensus or agreement. To evaluate
ing the results for K=10–200 for each of the four this proposition, we calculate the gold-standard
datasets, we get a set of differences in the scores ICR measures, Fleiss’ kappa (κ) (Fleiss, 1971)
and compute the p-value for a one-sided student and Krippendorff’s alpha (α) (Krippendorff, 2004).
t-test to determine whether LDA has higher aver- Both allow for multiple coders and produce a
age coherence scores than MetaLDA. MetaLDA chance-corrected estimate of ICR but do not fa-
yields significantly higher CNPMI scores calculated cilitate the isolation of low-agreement topics. For
using the Top20pcnt (pMetaLDA achieved higher or comparable scores p=
discovered that LDA outperformed MetaLDA. This                human evaluation methods9 .
is likely to be because the smaller topics in Met-               Due to the advancements in topic models, co-
aLDA can be effectively ignored or scrapped, while            herence measures designed for older models and
in LDA, all topics are of comparable size and are             more general datasets may be incompatible with
used by the model. Other non-parametric topic                 newer models and more specific datasets. Our ex-
models are belived to behave similarly. While                 periments show that non-parametric models, such
MetaLDA generated higher CNPMI-ABC scores than                as MetaLDA, which employs embeddings to im-
LDA for all aggregates, it was highly dependent               prove support for short-texts, behaves differently
on dataset heterogeneity and the value of K. This             to LDA for these performance and diagnostic mea-
should indicate that MetaLDA is more adaptive to              sures. This is critical because recent research has
specialized language, an effect expected in other             focused on sophisticated deep neural topic mod-
topic models supported by word embeddings.                    els (Zhao et al., 2021), which make tracing and
   The comparative performance of coherence mea-              predicting behaviors more challenging. Abstractly,
sures can vary significantly depending on the ag-             we may compare the use of coherence measures
gregate calculation method used and the way the               in topic modeling to the use of BLEU in machine
data has been prepared. This latter point has been            translation. Both lack the finesse necessary for a
well established in the literature, most notably for          complete evaluation, as is now the case with BLEU
Twitter data (Symeonidis et al., 2018), but is often          (Song et al., 2013).
overlooked when evaluating novel topic models.                   Additionally, our study demonstrated that an ex-
This is a cause for concern, given the growing re-            amination of the Tdc could provide greater insights
liance on coherence measures to select the optimal            into topic model behaviors and explained many of
model or K in applied settings (Xue et al., 2020;             the observed problems. We argue for the represen-
Lyu and Luli, 2021).                                          tation of topics as a combination of thematically
                                                              related Tdc and Tws , and the further adoption of
   Propositions 2 and 3 addressed Tws interpretabil-          empirical evaluation using specialized datasets and
ity. We have demonstrated the difference between              consideration of Tdc interpretability. To date, few
comprehending a topic and providing a topic label             papers have attempted this combination (Korenčić
that is both informative and reliable. However, co-           et al., 2018).
herence measures may not be informative of these                 However, we believe coherence measures and
qualities. Propositions 4 and 5 addressed Tdc in-             automated labeling techniques will continue to play
terpretability. We have demonstrated that the ease            a critical role in applied topic modeling. Contex-
of labeling a Tdc and the alignment between Tws               tually relevant measures like CNPMI-ABC and topic
and Tdc does not correlate with coherence mea-                diagnostics like Dew can be key indicators of inter-
sures. Additionally, we identified several areas for          pretability. Aside from the empirical evaluation
future research into the use of diagnostic statis-            of novel topic models, new automated labeling
tics in applied settings. We observed unexpected              techniques, having proven themselves useful for
behaviors in the distributions of Dew and Dtp af-             labeling Ttw , should be extended for Tdc .
ter a comparative analysis between LDA and the
non-parametric model MetaLDA, affecting the in-               Acknowledgments
terpretability of both Tws and Tdc . Correlations
between Qdif /Qaln and Dew /Dtp for MetaLDA,                  We thank Callum Waugh, Elliot Freeman and Eliza-
for example, indicate that these topic diagnostics            beth Daniels for conducting the expert annotations.
could assist in evaluating Td c interpretability.             We also thank Henry Linger for providing feed-
                                                              back on earlier drafts. The first author discloses
                                                              the following financial support for the research: an
6   Conclusion                                                Australian Government Research Training Program
                                                              (RTP) Stipend and RTP Fee-Offset Scholarship,
                                                              and an Australian Government Defence Science
We have shown that coherence measures can be un-
                                                              and Technology Group Research scholarship.
reliable for evaluating topic models for specialized
                                                           9
collections like Twitter data. We claim this is be-          Specifically, construct validity, which confirms if the op-
                                                       erational definition of a variable (interpretability) reflects the
cause the target of “interpretability” is ambiguous, true theoretical meaning of a concept (O’Leary-Kelly and
compromising the validity of both automatic and        Vokurka, 1998).
                                                    3832
Ethics and Impact C. Arnold, A. Oh, S. Chen, and W. Speier. 2016. Eval-
uating topic model interpretability from a primary
This project has been reviewed and approved by care physician perspective. Computer Methods and
the Monash University Human Research Commit- Programs in Biomedicine, 124:67–75.
tee (Project ID: 18167), subject to abidance with E. Baumer, D. Mimno, S. Guha, E. Quan, and G. Gay.
legislated data use and protection protocols. In par- 2017. Comparing grounded theory and topic mod-
ticular, the Twitter Inc. developers policy prohibits eling: Extreme divergence or unlikely convergence?
the further distribution of collected tweets and as- Journal of the Association for Information Science
and Technology, 68(6):1397–1410.
sociated metadata by the authors group, with the
exception of tweet IDs which may be distributed S. Bhatia, J. H. Lau, and T. Baldwin. 2017. An auto-
and re-hydrated. The subject matter of the tweets matic approach for document-level topic model eval-
collected is Australian Politics. We have forgone uation. In Proc. of the 21st Conf. on Computational
Natural Language Learning (CoNLL), pages 206–
the use of material included in the paper that would 215.
be offensive or problematic to marginalized groups
in the Australian political context. S. Bhatia, J. H. Lau, and T. Baldwin. 2018. Topic intru-
sion for automatic topic model evaluation. In Proc.
of the 2018 Conf. on Empirical Methods in Natural
Language Processing (EMNLP), pages 844–849.
References
A. Agrawal, W. Fu, and T. Menzies. 2018. What is S J. Blair, Y. Bi, and Maurice D Mulvenna. 2020. Ag-
wrong with topic modeling? And how to fix it using gregated topic models for increasing social media
search-based software engineering. Information and topic coherence. Applied Intelligence, 50(1):138–
Software Technology, 98:74–88. 156.
N. Aletras, T. Baldwin, J. H. Lau, and M. Stevenson. D. Blei and J. Lafferty. 2007. A correlated topic
2017. Evaluating topic representations for exploring model of science. The Annals of Applied Statistics,
document collections. Journal of the Association 1(1):17–35.
for Information Science and Technology, 68(1):154–
167. D. Blei, A. Ng, and M. Jordan. 2003. Latent Dirichlet
allocation. Journal of Machine Learning Research,
N. Aletras, J. H. Lau, T. Baldwin, and M. Stevenson. 3(Jan):993–1022.
2015. TM 2015–topic models: Post-processing and
applications workshop. In Proc. of the 24th ACM L. Bovens and S. Hartmann. 2004. Bayesian Episte-
Int. on Conf. on Information and Knowledge Man- mology. Oxford University Press.
agement (CIKM), pages 1953–1954.
J. Boyd-Graber and D. Blei. 2007. PUTOP: Turn-
N. Aletras and M. Stevenson. 2013. Evaluating topic ing predominant senses into a topic model for word
coherence using distributional semantics. In Proc. sense disambiguation. In 4th SemEval-2007, pages
of the 10th Int. Conf. on Computational Semantics 277–281.
(IWCS), pages 13–22.
J. Boyd-Graber, D. Mimno, and D. Newman. 2015.
A. Alokaili, N. Aletras, and M. Stevenson. 2019. Re- Care and feeding of topic models: Problems, diag-
ranking words to improve interpretability of auto- nostics, and improvements. In Edoardo M. Airoldi,
matically generated topics. In Proc. of the 13th Int. David Blei, Elena A. Erosheva, and Stephen E. Fien-
Conf. on Computational Semantics (IWCS), pages berg, editors, Handbook of Mixed Membership Mod-
43–54, Gothenburg, Sweden. ACL. els and Their Applications. CRC Press Boca Raton,
FL.
D. AlSumait, L.and Barbará and C. Domeniconi. 2008.
On-line LDA: Adaptive topic models for mining N. Brown. 2019. Methodological cyborg as black fem-
text streams with applications to topic detection and inist technology: constructing the social self using
tracking. In Proc. of the 8th IEEE Int. Conf. on Data computational digital autoethnography and social
Mining (ICDM)), pages 3–12. IEEE. media. Cultural Studies ↔ Critical Methodologies,
19(1):55–67.
R.-K. Ando and L. Lee. 2001. Iterative residual rescal-
ing. In Proc. of the 24th annual int. ACM SIGIR J. Chang, S. Gerrish, C. Wang, J. Boyd-Graber, and
conf. on Research and development (SIGIR), SIGIR D. Blei. 2009. Reading tea leaves: How hu-
’01, pages 154–162, New York, NY, USA. ACM. mans interpret topic models. In Proc. of the 23rd
Annu. Conf. Neural Information Processing Systems
M. Andreotta, R. Nugroho, M. Hurlstone, F. Boschetti, (NeurIPS), pages 288–296.
S. Farrell, I. Walker, and C. Paris. 2019. Analyz-
ing social media data: A mixed-methods framework W. Chen, J. Wang, Y. Zhang, H. Yan, and X. Li. 2015.
combining computational and qualitative text analy- User based aggregation for biterm topic model. In
sis. Behavior research methods, 51(4):1766–1781. Proc. of the 53rd Annu. Meeting of the Association
3833for Computational Linguistics and the 7th Int. Joint K. Krippendorff. 2004. Measuring the reliability of
Conf. on Natural Language (ACL-IJCNL), pages qualitative text analysis data. Quality and quantity,
489–494. 38:787–800.
X. Cheng, X. Yan, Y. Lan, and J. Guo. 2014. BTM: J. Landis and G. Koch. 1977. The measurement of ob-
Topic modeling over short texts. IEEE Transactions server agreement for categorical data. Biometrics,
on Knowledge and Data Engineering, 26(12):2928– pages 159–174.
2941.
J. H. Lau and T. Baldwin. 2016. The sensitivity of topic
C. Doogan, W. Buntine, H. Linger, and S. Brunt. coherence evaluation to topic cardinality. In Proc.
2020. Public perceptions and attitudes toward covid- 17th Conf. North American Chapter of the Associ-
19 nonpharmaceutical interventions across six coun- ation for Computational Linguistics: Human Lan-
tries: A topic modeling analysis of twitter data. guage Technologies (HLT-NAACL), pages 483–487.
Journal of Medical Internet Research, 22(9).
J. H. Lau, P. Cook, D. McCarthy, S. Gella, and T. Bald-
D. Dunning, K. Johnson, J. Ehrlinger, and J. Kruger. win. 2014a. Learning word sense distributions,
2003. Why people fail to recognize their own in- detecting unattested senses and identifying novel
competence. Current directions in psychological senses using topic models. In Proc. of the 52nd An-
science, 12(3):83–87. nual Meeting of the Association for Computational
Linguistics (ACL), pages 259–270.
M. Eickhoff and R. Wieneke. 2018. Understanding
topic models in context: A mixed-methods approach J. H. Lau, K. Grieser, D. Newman, and T. Baldwin.
to the meaningful analysis of large document collec- 2011. Automatic labelling of topic models. In Proc.
tions. In Proc. of the 51st Hawaii Int. Conf. on Sys- of the 49th Conf. on Human Language Technologies
tem Sciences (HICSS), pages 903–912. (HLT), pages 1536–1545, Portland, Oregon, USA.
ACL.
J. Fleiss. 1971. Measuring nominal scale agree-
ment among many raters. Psychological Bulletin, J. H. Lau, D. Newman, and T. Baldwin. 2014b. Ma-
76(5):378–382. chine reading tea leaves: Automatically evaluating
topic coherence and topic model quality. In Proc. of
T. Hecking and L. Leydesdorff. 2019. Can topic mod- the 9th Conf. European Chapter of the Association
els be used in research evaluations? reproducibility, for Computational Linguistics (EACL), pages 530–
validity, and reliability when compared with seman- 539.
tic maps. Research Evaluations, 28(3):263–272.
X. Li, C. Li, J. Chi, and J. Ouyang. 2018. Short
K. Hui. 2001. Automatic Topic Detection From News text topic modeling by exploring original documents.
Stories. Ph.D. thesis, CUHK. Knowledge and Information Systems, 56(2):443–
462.
I. Kagashe, Z. Yan, and I. Suheryani. 2017. Enhanc-
ing seasonal influenza surveillance: topic analysis Kar Wai Lim, Changyou Chen, and Wray L. Bun-
of widely used medicinal drugs using Twitter data. tine. 2013. Twitter-Network Topic Model: A full
Journal of Medical Internet Research, 19(9):e315. Bayesian treatment for social network and text mod-
eling. In Proc. of the 27th Annu. Conf. on Neural
A. Karami, A. Dahl, G. Turner-McGrievy, H. Kharrazi, Information Processing Systems (NeurIPS): Topic
and G. Shaw Jr. 2018. Characterizing diabetes, diet, Models Workshop, NeurIPS Workshop 2013, pages
exercise, and obesity comments on Twitter. Interna- 1–5.
tional Journal of Information Management, 38(1):1–
6. Z. C. Lipton. 2018. The mythos of model interpretabil-
ity. Communications of the ACM, 61(10):36–43.
A. Karami, M. Lundy, F. Webb, and Y. Dwivedi. 2020.
Twitter and research: a systematic literature review J. Lund, P. Armstrong, W. Fearn, S. Cowley, C. Byun,
through text mining. IEEE Access, 8:67698–67717. J. Boyd-Graber, and K. Seppi. 2019. Automatic
evaluation of local topic quality. In Proc. of the
E. Kim, Y. Jeong, Y. Kim, K. Kang, and M. Song. 2016. 57th Annual Meeting of the Association for Compu-
Topic-based content and sentiment analysis of ebola tational Linguistics (ACL), pages 788–796.
virus on Twitter and in the news. Journal Informa-
tion Science, 42(6):763–781. J. Lyu and G. Luli. 2021. Understanding the public dis-
cussion about the centers for disease control and pre-
A. P. Kirilenko, S. O. Stepchenkova, and X. Dai. 2021. vention during the covid-19 pandemic using twitter
Automated topic modeling of tourist reviews: Does data: Text mining analysis study. Journal of Medi-
the Anna Karenina principle apply? Tourism Man- cal Internet Research, 23(2):e25108.
agement, 83:104241.
D. Maier, A. Waldherr, P. Miltner, G. Wiedemann,
D. Korenčić, S. Ristov, and J Šnajder. 2018. Document- A. Niekler, A. Keinert, B. Pfetsch, G. Heyer, U. Re-
based topic coherence measures for news media text. ber, and T. Häussler. 2018. Applying LDA topic
Expert Systems With Applications, 114:357–373. modeling in communication research: Toward a
3834valid and reliable methodology. Communication M. Röder, A. Both, and A. Hinneburg. 2015. Explor-
Methods and Measures, 12(2–3):93–118. ing the space of topic coherence measures. In Proc.
of the 8th ACM Int. Conf. on Web Search and Data
A. McCallum. 2002. MALLET: A machine learning Mining (WSDM), pages 399–408.
for language toolkit.
F. Rosner, A. Hinneburg, M. Roder, M. Nettling, and
D. Mimno, H. Wallach, E. Talley, M. Leenders, and A. Both. 2013. Evaluating topic coherence mea-
A. McCallum. 2011. Optimizing semantic coher- sures. In Proc. 27th Annu. Conf. on Neural Infor-
ence in topic models. In Proc. of the 2011 Conf. mation Processing Systems (NeurIPS), pages 1–4.
on Empirical Methods in Natural Language Process-
ing (EMNLP), EMNLP ’11, pages 262––272, USA.
M. Sanderson and I. Soboroff. 2007. Problems with
ACL.
kendall’s tau. In Proc.of the 30th annual int. ACM
F. Morstatter and H. Liu. 2017. In search of coher- SIGIR conf. on Research and development (SIGIR),
ence and consensus: Measuring the interpretability pages 839–840.
of statistical topics. Journal of Machine Learning
Research, 18(1):6177–6208. L. Sinnenberg, A. Buttenheim, K. Padrez,
C. Mancheno, L. Ungar, and R. Merchant. 2017.
F. Morstatter, Y. Shao, A. Galstyan, and S. Karunasek- Twitter as a tool for health research: a system-
era. 2018. From alt-right to alt-rechts: Twitter anal- atic review. American Journal of Public Health,
ysis of the 2017 German federal election. In Proc. 107(1):e1–e8.
of the 2018 World Wide Web Conference (TheWeb-
Conf), pages 621–628. IW3C2. X. Song, T. Cohn, and L. Specia. 2013. BLEU decon-
structed: Designing a better MT evaluation metric.
A. Nerghes and J. S. Lee. 2019. Narratives of the International Journal of Computational Intelligence
refugee crisis: A comparative study of mainstream- and Applications, 4(2):29–44.
media and Twitter. Media and Communication,
7(2):275–288. X. Sun, X. Liu, B. Li, Y. Duan, H. Yang, and J. Hu.
2016. Exploring topic models in software engi-
D. Newman, E. Bonilla, and W. Buntine. 2011. Improv-
neering data analysis: A survey. In Proc. of the
ing topic coherence with regularized topic models.
17th IEEE/ACIS Int. Conf. on Software Engineer-
In Proc. of the 25th Annu. Conf. on Neural Informa-
ing, Artificial Intelligence, Networking and Paral-
tion Processing Systems (NeurIPS), pages 496–504.
lel/Distributed Computing (SNPD), pages 357–362.
D. Newman, J. H. Lau, K. Grieser, and T. Baldwin.
2010a. Automatic evaluation of topic coherence. In S. Symeonidis, D. Effrosynidis, and A. Arampatzis.
Proc. of the 11th Conf. North American Chapter of 2018. A comparative evaluation of pre-processing
the Association for Computational Linguistics: Hu- techniques and their interactions for twitter senti-
man Language Technologies (HLT-NAACL), pages ment analysis. Expert Systems with Applications,
100–108. ACL. 110:298–310.
D. Newman, Y. Noh, E. Talley, S. Karimi, and T. Bald- Y. Teh, M. Jordan, M. Beal, and D. Blei. 2006. Hierar-
win. 2010b. Evaluating topic models for digital li- chical Dirichlet processes. Journal of the American
braries. In Proc. of the 10th ACM/IEEE-CS Joint Statistical Association, 101(476):1566–1581.
Conf. on Digital Libraries, (JCDL), pages 215–224.
A. Törnberg and P. Törnberg. 2016. Combining CDA
D. O’Callaghan, D. Greene, J. Carthy, and P. Cunning- and topic modeling: Analyzing discursive connec-
ham. 2015. An analysis of the coherence of descrip- tions between Islamophobia and anti-feminism on
tors in topic modeling. Expert Systems With Appli- an online forum. Discourse & Society, 27(4):401–
cations, 42(13):5645–5657. 422.
S. O’Leary-Kelly and R. Vokurka. 1998. The empirical
J. Wang, L. Chen, L. Qin, and X. Wu. 2018. Astm: An
assessment of construct validity. Journal of Opera-
attentional segmentation based topic model for short
tions Management, 16(4):387–405.
texts. In Proc. of the 18th IEEE Int. Conf. on Data
J. Pennington, R. Socher, and C. Manning. 2014. Mining (ICDM)), pages 577–586.
GloVe: Global vectors for word representation. In
Proc. of the 2014 Conf. on Empirical Methods J. Xue, J. Chen, C. Chen, C. Zheng, S. Li, and
in Natural Language Processing (EMNLP), pages T. Zhu. 2020. Public discourse and sentiment dur-
1532–1543, Doha, Qatar. ACL. ing the covid 19 pandemic: Using latent dirichlet
allocation for topic modeling on twitter. PloS one,
N. Ramrakhiyani, S. Pawar, S. Hingmire, and G. Pal- 15(9):e0239441.
shikar. 2017. Measuring topic coherence through
optimal word buckets. In Proc. of the 15th Conf. C. Zhang and H. W. Lauw. 2020. Topic modeling
European Chapter of the Association for Computa- on document networks with adjacent-encoder. vol-
tional Linguistics (EACL), pages 437–442. ume 34, pages 6737–6745.
3835H. Zhao, L. Du, W. Buntine, and G. Liu. 2017. Met-
alda: A topic model that efficiently incorporates
meta information. In Proc. of the 17th IEEE Int.
Conf. on Data Mining (ICDM), pages 635–644.
H. Zhao, Dinh P., v. Huynh, y. Jin, L. Du, and W. Bun-
tine. 2021. Topic modelling meets deep neural net-
works: A survey. arXiv preprint arXiv:2103.00498.
W. Zhao, J. Jiang, J. Weng, J. He, E. Lim, H. Yan, and
X. Li. 2011. Comparing twitter and traditional me-
dia using topic models. In Proc. of the 33rd Euro-
pean Conf. on Information Retrieval (ECIR), pages
338–349, Berlin, Heidelberg. Springer Berlin Hei-
delberg.
M. Zhou and L. Carin. 2015. Negative binomial pro-
cess count and mixture modeling. IEEE Transac-
tions on Pattern Analysis and Machine Intelligence,
37(2):307–320.
Y. Zuo, J. Zhao, and K. Xu. 2016. Word network topic
model: a simple but general solution for short and
imbalanced texts. Knowledge and Information Sys-
tems, 48(2):379–398.
3836APPENDIX: Topic Model or Topic Twaddle? Re-evaluating Semantic
Interpretability Measures
Caitlin Doogan and Wray Buntine
NAACL-HLT 2021
A Examples of tasks for Qualitative Experiments
Topic word-set labeling
Figure 2: Example of topic word-set labeling task. Topic 40 from AP modeled on LDA.
3837Topic document-collection labeling
Figure 3: Example of topic document-collection labeling
3838 task. Only the top 10 tweets have been shown
for brevity.Difficulty of topic document-collection labeling
Figure 4: Example question asking SME to rate how difficult it was to label a topic document-collection.
3839Topic word-set and topic document-collection label alignment
Figure 5: Example question asking SME to rate how aligned a topic word-set label was to topic document-
collection label.
3840B Evaluation 1: Coherence Measures
Pearson’s correlation coefficients between paired coherence measures
LDA 10 20 40 60
AP ρ p ρ p ρ p ρ p
CNPMI and CNPMI-ABC 0.671 0.034 0.749 < 0.01 0.762 < 0.01 0.727 < 0.01
CNPMI and CUmass 0.661 0.037 0.752 < 0.01 0.579 < 0.01 0.447 < 0.01
CNPMI and CNPMI-AP 0.383 0.275 0.394 0.086 0.258 0.108 0.256 0.048
CNPMI and CP 0.897 < 0.01 0.912 < 0.01 0.919 < 0.01 0.878 < 0.01
CNPMI and CA 0.692 0.027 0.523 0.018 0.547 < 0.01 0.556 < 0.01
CNPMI and CV 0.127 0.726 0.117 0.624 -0.071 0.663 0.089 0.498
CNPMI-ABC and CNPMI-AP 0.538 0.109 0.541 0.014 0.343 0.030 0.375 0.003
MetaLDA 10 20 40 60
AP ρ p ρ p ρ p rp p
CNPMI and CNPMI-ABC 0.778 0.008 0.783 < 0.01 0.625 < 0.01 0.651 < 0.01
CNPMI and CUmass 0.834 0.003 0.738 < 0.01 0.715 < 0.01 0.590 < 0.01
CNPMI and CNPMI-AP 0.523 0.121 0.096 0.686 -0.084 0.606 0.005 0.972
CNPMI and CP 0.929 < 0.01 0.959 < 0.01 0.949 < 0.01 0.923 < 0.01
CNPMI and CA 0.788 0.007 0.435 0.055 0.623 < 0.01 0.505 < 0.01
CNPMI and CV -0.471 0.170 -0.078 0.742 -0.284 0.075 -0.145 0.269
CNPMI-ABC and CNPMI-AP 0.100 0.784 0.190 0.423 0.125 0.443 0.172 0.188
Table 3: Pearson’s r and p-values reported for the analysis of correlations between coherence measures
for the AP dataset
Aggregate mean for coherence measures
LDA AP AWH AWM
CNPMI and CNPMI-ABC 0.727±0.040 0.719±0.050 0.769±0.115
CNPMI and CUmass 0.601±0.129 0.395±0.406 0.419±0.088
CNPMI and CNPMI-AP 0.323±0.076 0.507±0.189 0.387±0.123
CNPMI and CP 0.902±0.018 0.779±0.101 0.855±0.043
CNPMI and CA 0.578±0.076 0.391±0.094 0.626±0.069
CNPMI and CV 0.066±0.092 -0.108±0.053 0.253±0.118
CNPMI-ABC and CNPMI-AP 0.449±0.105 0.565±0.056 0.423±0.073
MetaLDA AP AWH AWM
CNPMI and CNPMI-ABC 0.709±0.083 0.606±0.126 0.716±0.104
CNPMI and CUmass 0.719±0.100 0.539±0.086 0.272±0.249
CNPMI and CNPMI-AP 0.135±0.269 0.258±0.267 0.181±0.153
CNPMI and CP 0.940±0.017 0.770±0.149 0.884±0.037
CNPMI and CA 0.588±0.154 0.360±0.183 0.285±0.187
CNPMI and CV -0.245±0.174 -0.138±0.273 0.087±0.217
CNPMI-ABC and CNPMI-AP 0.147±0.042 0.362±0.223 0.390±0.159
Table 6: The aggregate mean Pearson’s correlation coefficient for LDA and MetaLDA across all topics.
3841LDA 10 20 40 60
AWH ρ p ρ p ρ p ρ p
CNPMI and CNPMI-ABC 0.794 0.006 0.702 0.01 0.693 < 0.01 0.688 < 0.01
CNPMI and CUmass 0.714 0.020 -0.193 0.414 0.454 0.003 0.606 < 0.01
CNPMI and CNPMI-AP 0.746 0.013 0.545 0.013 0.438 0.005 0.297 0.021
CNPMI and CP 0.628 0.052 0.816 < 0.01 0.846 < 0.01 0.826 < 0.01
CNPMI and CA 0.315 0.375 0.316 0.174 0.421 0.007 0.511 < 0.01
CNPMI and CV -0.093 0.798 -0.176 0.459 -0.112 0.490 -0.049 0.709
CNPMI-ABC and CNPMI-AP 0.586 0.075 0.619 0.004 0.567 < 0.01 0.488 < 0.01
MetaLDA 10 20 40 60
AWH ρ p ρ p ρ p rp p
CNPMI and CNPMI-ABC 0.719 0.019 0.613 0.004 0.428 0.006 0.663 < 0.01
CNPMI and CUmass 0.593 0.071 0.459 0.042 0.473 0.002 0.631 < 0.01
CNPMI and CNPMI-AP 0.450 0.192 0.476 0.034 0.204 0.208 -0.098 0.458
CNPMI and CP 0.547 0.102 0.844 < 0.01 0.855 < 0.01 0.835 < 0.01
CNPMI and CA 0.089 0.808 0.407 0.075 0.469 0.002 0.476 < 0.01
CNPMI and CV 0.034 0.925 -0.491 0.028 0.115 0.479 -0.209 0.108
CNPMI-ABC and CNPMI-AP 0.489 0.151 0.580 0.007 0.303 0.058 0.076 0.565
Table 4: Pearson’s r and p-values reported for the analysis of coherence measures correlations for the
AWH dataset
Graphs of aggregate coherence measures for LDA vs MetaLDA
Figure 6: Comparison of LDA (triangle) and MetaLDA (circle) aggregated coherence scores for the AWH
dataset. Scores are shown on the y-axis and K is shown on the x-axis.
3842LDA 10 20 40 60
AWM ρ p ρ p ρ p rp p
CNPMI and CNPMI-ABC 0.894 < 0.01 0.821 < 0.01 0.734 < 0.01 0.627 < 0.01
CNPMI and CUmass 0.512 0.131 0.450 0.047 0.303 0.058 0.410 < 0.01
CNPMI and CNPMI-AP 0.294 0.409 0.389 0.090 0.560 < 0.01 0.304 0.018
CNPMI and CP 0.898 < 0.01 0.886 < 0.01 0.816 < 0.01 0.821 < 0.01
CNPMI and CA 0.725 0.018 0.584 0.007 0.620 < 0.01 0.576 < 0.01
CNPMI and CV 0.341 0.335 0.105 0.660 0.354 0.025 0.210 0.108
CNPMI-ABC and CNPMI-AP 0.364 0.301 0.391 0.088 0.528 < 0.01 0.407 < 0.01
MetaLDA 10 20 40 60
AWM ρ p ρ p ρ p ρ p
CNPMI and CNPMI-ABC 0.866 < 0.01 0.687 0.001 0.684 < 0.01 0.625 < 0.01
CNPMI and CUmass 0.302 0.396 -0.080 0.736 0.500 0.001 0.366 < 0.01
CNPMI and CNPMI-AP 0.289 0.418 0.133 0.576 0.315 0.048 -0.015 0.912
CNPMI and CP 0.939 < 0.01 0.860 < 0.01 0.861 < 0.01 0.875 < 0.01
CNPMI and CA 0.080 0.825 0.333 0.151 0.207 0.201 0.518 < 0.01
CNPMI and CV -0.109 0.765 0.384 0.094 -0.033 0.839 0.105 0.425
CNPMI-ABC and CNPMI-AP 0.417 0.231 0.516 0.020 0.469 0.002 0.160 0.222
Table 5: Pearson’s r and p-values reported for the analysis of correlations between coherence measures
for the AWM dataset
Figure 7: Comparison of LDA (triangle) and MetaLDA (circle) aggregated coherence scores for the AWM
dataset. Scores are shown on the y-axis and K is shown on the x-axis.
3843You can also read