Anisakis pegreffii Extract Induces Airway Inflammation with Airway Remodeling in a Murine Model System
←
→
Page content transcription
If your browser does not render page correctly, please read the page content below

Hindawi
BioMed Research International
Volume 2021, Article ID 2522305, 13 pages
https://doi.org/10.1155/2021/2522305

Research Article
Anisakis pegreffii Extract Induces Airway Inflammation with
Airway Remodeling in a Murine Model System

          Jun Ho Choi , Ju Yeong Kim, Myung-hee Yi, Myungjun Kim, and Tai-Soon Yong
          Department of Environmental Medical Biology, Institute of Tropical Medicine & Arthropods of Medical Importance Resource Bank,
          Yonsei University College of Medicine, Seoul 03722, Republic of Korea

          Correspondence should be addressed to Tai-Soon Yong; tsyong212@yuhs.ac

          Received 14 June 2021; Accepted 20 August 2021; Published 18 September 2021

          Academic Editor: Kalman Imre

          Copyright © 2021 Jun Ho Choi et al. This is an open access article distributed under the Creative Commons Attribution License,
          which permits unrestricted use, distribution, and reproduction in any medium, provided the original work is properly cited.

          Exposure of the respiratory system to the Anisakis pegreffii L3 crude extract (AE) induces airway inflammation; however, the
          mechanism underlying this inflammatory response remains unknown. AE contains allergens that promote allergic
          inflammation; exposure to AE may potentially lead to asthma. In this study, we aimed to establish a murine model to assess
          the effects of AE on characteristic features of chronic asthma, including airway hypersensitivity (AHR), airway inflammation,
          and airway remodeling. Mice were sensitized for five consecutive days each week for 4 weeks. AHR, lung inflammation, and
          airway remodeling were evaluated 24 h after the last exposure. Lung inflammation and airway remodeling were assessed from
          the bronchoalveolar lavage fluid (BALF). To confirm the immune response in the lungs, changes in gene expression in the
          lung tissue were assessed with reverse transcription-quantitative PCR. The levels of IgE, IgG1, and IgG2a in blood and
          cytokine levels in the BALF, splenocyte, and lung lymph node (LLN) culture supernatant were measured with ELISA. An
          increase in AHR was prominently observed in AE-exposed mice. Epithelial proliferation and infiltration of inflammatory cells
          were observed in the BALF and lung tissue sections. Collagen deposition was detected in lung tissues. AE exposure increased
          IL-4, IL-5, and IL-13 expression in the lung, as well as the levels of antibodies specific to AE. IL-4, IL-5, and IL-13 were
          upregulated only in LLN. These findings indicate that an increase in IL-4+ CD4+ T cells in the LLN and splenocyte resulted in
          increased Th2 response to AE exposure. Exposure of the respiratory system to AE resulted in an increased allergen-induced
          Th2 inflammatory response and AHR through accumulation of inflammatory and IL-4+ CD4+ T cells and collagen deposition.
          It was confirmed that A. pegreffii plays an essential role in causing asthma in mouse models and has the potential to cause
          similar effects in humans.

1. Introduction                                                       the detection of Anisakis allergy. Workers involved in the
                                                                      manual or automated processing of crabs, shrimps, mussels,
The fish-borne zoonotic parasites Anisakis simplex and A.              fishes, and fishmeal are typically exposed to various seafood
pegreffii are known to cause anisakiasis or allergies in humans         ingredients [6]. Aerosolization of seafood and cooking fluids
[1]. The estimated frequency of such reactions is 200 cases           during processing is a potential occupational hazard that can
per year in South Korea, 2000 cases in Japan, and 20–500              cause sensitization through inhalation [6]. Indeed, allergic
cases in some European countries [2, 3]. A notable sign of            and anaphylactic reactions to Anisakis have been reported
Anisakis allergy is a reaction that occurs when live larvae           among workers in fish processing plants [7, 8]. A. pegreffii
penetrate the gastric mucosa, which is commonly associated            and A. simplex allergens are known to contribute to respira-
with hives, angioedema, abdominal pain, and irritability [4,          tory allergies and contact dermatitis [9, 10]; repeated inhala-
5]. The gastrointestinal symptoms may be minimal or absent,           tion of the aerosolized anisakid protein may trigger a
and the onset of symptoms is usually delayed between 2 and            respiratory reaction, as suggested by prior studies in humans
24 h [2]. This delay between consumption of fish and the               [6, 11]. A case of occupational hypersensitivity to Anisakis
onset of symptoms can be an important diagnostic clue for             had previously been reported in a worker in a frozen fish
2                                                                                              BioMed Research International

factory. Systemic hives, rash, and symptoms of asthma were            In this study, we established a 4-week mouse model of
observed in the worker after exposure in the workplace. All       Anisakis-induced allergic airway inflammation using daily
the symptoms disappeared immediately after workplace              intranasal treatment with the A. pegreffii extract (AE). The
exposure ceased [12]. This indicates that Anisakis is a signif-   airway remodeling markers such as collagen deposition as
icant cause of occupational asthma and hives in the fish           well as general allergic asthma markers were assessed. We
industry [12]; additionally, anaphylactic reactions due to        propose that this 4-week experimental murine model with
Anisakis have been confirmed in animal models [13]. Cases          AE exposure may be suitable for studying chronic asthma
of asthma have also been observed from exposure to Anisa-         with allergic airway remodeling.
kis [12, 14, 15].
     A major allergen (Ani s 7) has been identified in Anisakis    2. Materials and Methods
species [16, 17]. Additionally, proteolytic enzymes in the
body of whale roundworms are well known as allergens              2.1. Animals. Female BALB/c mice (n = 10; 8 weeks old)
[16]. Several factors may contribute to the increased antige-     were purchased from Orient Bio (Seongnam, South Korea).
nicity and allergenicity of Ani s 7, including the repeating      Of the 10 mice, 5 were included in the control group, and
amino acid composition of the motif, high cysteine content,       the remaining 5 were included in the experimental group.
and the ability to create allergen resistance to proteolysis by   All animal studies were approved by the Department of Lab-
certain prominent enzymes (i.e., cathepsin) in the intracellu-    oratory Animal Resources Committee of Yonsei University
lar pathway of antigen-presenting cells by specific T cells        College of Medicine (no. 2018-0316, 2020-0077). The mice
[18]. However, it has been observed that skin tests using         were housed in specific pathogen-free conditions and a
whole body extracts of parasite larvae or oral administration     12 h light/dark cycle and acclimated for a week before the
of freeze-dried parasites do not reproduce clinical symp-         start of the experiment. The health of the animals was mon-
toms. Hence, the secretions or secreted proteins produced         itored daily.
by live larvae have been suggested as possible allergens [19,
20]. Furthermore, in an A. simplex allergy study, it was dem-     2.2. Allergen Extraction. Chub mackerel (Scomber japonicus)
onstrated that cooking and freezing did not destroy allergens     were purchased from a traditional market in Seoul, South
and parasitic substances and could not protect against            Korea. A. pegreffii third-stage larvae (L3) were manually har-
hypersensitivity reactions [8, 21, 22]. Thus, these allergens     vested from the abdominal cavity. The genotypes of A.
are resistant to the external environment and can sustainably     pegreffii and anisakid larvae were confirmed with polymer-
induce allergic reactions upon exposure.                          ase chain reaction (PCR) using the protocol described by
     Asthma is a common inflammatory airway disease that           Lee et al. The primers used were ASF1 5 ′ -CAG CTT AAG
affects over 300 million people worldwide [23]. It has             GCA GAG TC-3 ′ and AS2 5 ′ -TAT CAT TTT TGA TCA
increasingly been recognized as a heterogeneous disease with      CAT AGA C-3 ′ [38].
various characteristics, particularly in chronic cases of the         A. pegreffii were washed with distilled water and then
disease [24, 25]. Airway remodeling is a prominent feature        stored at 4°C. Then, AE was prepared by washing the L3
of asthma that can occur prior to the onset of symptoms           larvae with sterile water, followed by sonication. The extract
[26–28]. When airway remodeling occurs, changes in colla-         was centrifuged for 30 min at 10,000 × g and filter-sterilized
gen deposition, degree of fibroblast/myofibroblast accumula-        through a 0.22 μm filter (Millipore, Seoul, South Korea).
tion, degree of airway smooth muscle (ASM) volume, and            Protein concentration was measured using the Bradford test
decreased distance from the epithelium to ASM are the only        (Bio-Rad, Hercules, CA, USA) according to the manufac-
morphological features that distinguish persistent asthma         turer’s instructions. The extract was kept on ice during
from mild disease. Hence, airway remodeling is an essential       the extraction process and stored at −80°C until required.
phenomenon even in animal models of asthma. Several               The AE was used for sensitization, as well as exposure chal-
mouse models of allergic airway inflammation have been             lenge and enzyme-linked immunosorbent assay (ELISA)
established to investigate various features of asthma [7,         experiments.
29–32]. Acute airway inflammation models, usually induced
within 3 weeks, are often characterized by airway hypersen-       2.3. Occurrence of Allergic Airway Inflammation. The AE
sitivity (AHR) and inflammation, but not remodeling [33,           (25 μg) was resuspended in phosphate-buffered saline
34]. Notably, in a 1-week model system using Anisakis             (PBS), and 35 μL AE solution was inoculated into the mice
crude extract allergens, the number of cells involved in          intranasally using a pipette tip (Figure 1). The control mice
the inflammatory immune response increased; however,               received 35 μL of sterile PBS. The mice were sensitized for
observations of airway remodeling, indicative of asthma,          five consecutive days each week (Monday–Friday) for 4
were not reported [35]. Airway remodeling features, such          weeks. The endpoint metrics were assessed 24 h after the last
as goblet cell proliferation, were not observed in the 2-week     AE or PBS exposure.
model as well [33]. Indeed, airway remodeling through col-
lagen deposition is usually not observed in mouse models          2.4. Assessment of Lung Function and Methacholine
until mice are exposed to allergens for more than 4 weeks         Reactivity. AHR was measured 24 h after the last treatment,
[36, 37]. Interestingly, airway remodeling has not been           using the FlexiVent system (Scireq Inc., Montreal, QC, Can-
reported in the 6- and 10-week chronic Anisakis asthma            ada) as previously described [39]. Briefly, mice were anesthe-
model systems [13].                                               tized with ketamine (36 mg/kg IP; Zoletil® 50, Virbac, South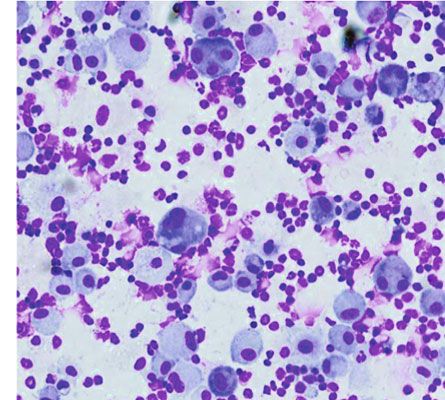
BioMed Research International                                                                                                           3

                           Sensitization (IN)                    Challenge (IN)                        AHR &
                              (AE + PBS)                          (AE + PBS)                          Sacrifice

                             0   1   2 3    4    7 8   9 10 11      14 15 16 17 18   21 22 23 24 25 26 (days)

Figure 1: Timeline for allergen exposure in a chronic 4-week Anisakis pegreffii-treated mouse model system. Mice were treated with 25 μg of
the A. pegreffii extract (AE) in 35 μL phosphate-buffered saline (PBS) or 35 μL PBS alone by an intranasal challenge for five consecutive days
in a week for a period of 4 weeks.

Korea) and xylazine (11.2 mg/kg IP; Rompun inj, Bayer,                  solution (HBSS, Thermo Fisher Scientific, Waltham, MA,
South Korea). An intratracheal 18-gauge stainless steel can-            USA), and total cell counts were determined using a hemo-
nula (LS18, Luer stub, green ×0.5 in 12 mm, nonsterile,                 cytometer. The collected BALF samples were centrifuged
Instech, Plymouth Meeting, PA, USA) was used for intuba-                for 5 min at 3,000 × g and 4°C. The whole-cell pellet was
tion to measure respiratory dynamics, along with a                      resuspended in HBSS, and BALF cell smears were prepared
ventilator-based FlexiVent® system. Pancuronium bromide                 by cell centrifugation (Shandon Cytospin 4, Thermo, Seoul,
(0.8–1.2 mg/kg IP; P1918 Sigma-Aldrich, St. Louis, MO,                  South Korea). The slides with cell smears were stained with
USA) was administered prior to the lung function tests to               Diff-Quik (Sysmex, Tokyo, Japan) and analyzed using previ-
prevent self-breathing. Mice were subjected to deep lung                ously described methods [40].
inflation, which involved slow inflation of the lung with a
pressure of 27 cm H2O maintained for 6 s, followed by one               2.6. Histological Analysis. For mouse lung tissue analysis,
time delivery of 0.1 ml of 3 cm H2O applied with a water trap           the left lung from each mouse was isolated, fixed in 10%
for positive end-expiratory pressure (PEEP). Ventilation was            formalin for 24 h, and embedded in paraffin. The lung tissue
performed at 150 breaths/min with a respiratory volume of               samples were sectioned (2–3 μm) and stained with hema-
10 mL/kg. The baseline measurement of respiratory dynamics              toxylin and eosin (H&E) and periodic acid-Schiff (PAS)
(quasi-static compliance) increased the concentration of nor-           using standard histological protocols to detect mucus-
mal nebulized PBS (used for baseline measurement) and                   containing cells [41]. Goblet cell hyperplasia was measured,
methacholine (MCh; Sigma-Aldrich) (untreated BALB/c, n                  and fibrosis was assessed, as previously described, using
 = 5). AHR was measured in antigen-sensitive and challenged             Masson’s trichrome stain [42]. Tissue sections were exam-
BALB/c (n = 5) mice under three consecutive concentrations              ined using an Olympus BX53 microscope with an Olympus
of MCh (12.5, 25, and 50 mg/mL). A 3 s broadband with 2 s               DP71 digital camera (magnification, 400x; Olympus DP71,
perturbation, 2.5 Hz single-frequency forced oscillation tech-          Nishi Shinjuku 2-Chome, Tokyo, Japan). Images were
nique maneuver (SFOT; using SnapShot-150 perturbation),                 acquired using the cellSens standard 1.12 imaging software
and 12 mutual prime frequencies between 1 and 20.5 Hz at                (Olympus, Tokyo, Japan).
5 s intervals for a total of 3 min were applied. These were eval-            The pathological change index of H&E slides was
uated using the low-frequency forced oscillation technique              assigned numerical values based on inflammatory cell infil-
maneuver (LFOT; using Quick Prime-3 perturbation).                      tration and thickness around the airway and blood vessels
     The airway constriction (respiratory resistance system             (0, normal or no cells; 1, ≤3 cell diameter thickness; 2, 4–6
(Rrs)) and airway stiffness (elastance of the respiratory                cell thickness; 3, 7–9 cell thickness; and 4, ≥10 cell thickness).
(Ers)) were calculated using the FlexiVent software by fitting           Similarly, numerical values were assigned according to the
the equation of motion of a linear single-compartment                   proportion of airways and blood vessels in each section that
model of lung mechanics to SFOT data using multiple linear              were surrounded by inflammatory cells (0, normal or no air-
regression. Respiratory system input impedance was calcu-               ways or blood vessels; 1,
4                                                                                              BioMed Research International

harvested, suspended in 1 mL of RNAlater® (Life Technolo-         containing 100 U/mL penicillin and 100 μg/mL streptomycin
gies, Burlington, ON, Canada), and stored at −20°C. Two           (LS202-02, Welgene, Gyeongsan-si, South Korea).
micrograms of total RNA was extracted from the lungs using             For CD3 stimulation experiments, the cells were treated
1 mL of RiboEx™ (301-001; Seoul, South Korea), and cDNA           with 0.5 μg/mL of the CD3e monoclonal antibody (MA5-
was synthesized using MMLV reverse transcriptase (ENZ-            17655, 145-2C11, Invitrogen, Seoul, South Korea). The plated
KIT106-0200; Ampigene® cDNA Synthesis Kit, Farming-               cells were incubated for 72 h at 37°C and 5% CO2. After incu-
dale, NY, USA) according to the manufacturer’s instruc-           bation, the culture medium was harvested and stored at
tions. Gene expression profiling was performed for the             −20°C. The levels of IL-4, IL-5, IL-6, IL-13, and IFN-γ were
following targets: IL-4, eotaxin-1 (chemokine, C-C motif          measured using ELISA (PeproTech, Cranbury, NJ, USA).
ligand 11, and Ccl11) [43], IL-5 [44], IL-13 [45], IL-17A,        The BALF supernatant and culture supernatant of splenocytes
and Cxcl1 [43]. The target genes were quantified and analyzed      and LLN were assessed using an ELISA kit (PeproTech)
using the qPCR Green Mix Hi-ROX kit (ENZ-NUC104-1000,             according to the manufacturer’s instructions. The absorbance
Ampigene®, Enzo Life Sciences, Farmingdale, NY, USA)              of the final reaction was measured at 450 nm as previously
according to the manufacturer’s instructions. The reaction        described.
was performed on a real-time PCR machine (StepOne Plus,
Applied Biosystems Inc., Seoul, South Korea) using the primer     2.9. Flow Cytometry. To assess the recruitment of IL-4+
sequences listed in Supplementary Table 1. The relative           CD4+ T cells, live cells were isolated from splenocytes and
expression of each gene was calculated as the ratio of target     LLN from allergic airway inflammatory mice that were or
gene expression to the housekeeping gene peptidylprolyl           were not sensitized to the A. pegreffii crude extract. The cell
isomerase A (Ppia) expression, using the StepOne software         preparation method was the same as that described in Sec-
(v2.3, Applied Biosystems Inc.).                                  tion 2.8. Samples were measured and analyzed on a flow cyt-
                                                                  ometer (3-laser, 10-color; SONY SA3800) using the
2.8. Measurement of Immunoglobulin (Ig) and Cytokine              appropriate mAbs. The antibodies used for cell surface stain-
Levels. After the lung function test was completed, mice were     ing included purified rat anti-mouse CD16/CD32 (553142;
euthanized with an excess of ketamine/xylazine and blood          Mouse BD Fc Block™, BD Pharmingen™), CD4 monoclonal
was collected through the abdominal vein [46]. The serum          antibody (T helper cell marker, 17-0042-82; RM4-5, APC,
levels of A. pegreffii-specific IgE were evaluated using ELISA.      eBioscience, San Diego, CA, USA), and rat IgG2a kappa iso-
Briefly, 96-well plates (Corning® 1 × 8 Stripwell™ 96-well         type control (17-4321-81; eBR2a, APC, eBioscience), while
plates, Sigma-Aldrich Co., Seoul, South Korea) were coated        intracellular staining was performed with PE-Cy™7 rat
with 0.5 μg AE in 50 μL coating buffer and incubated over-         anti-mouse IL-4 (560699; BD Pharmingen™), PE-Cy™7 rat
night at 4°C. The plates were blocked with 100 μL/well of         IgG1κ isotype control (557645; BD Pharmingen™), anti-
blocking buffer (1% BSA in PBS). A 50 μL aliquot of the serum      iNOS-PE cyanine7 (25-5920-82), and anti-arginase 1-
sample (0.05% Tween-20 and 0.1% BSA in PBS diluted to 1 : 4)      PerCP-eFluor 710 (46-3697-82; eBioscience). Additionally,
was added to each well and incubated overnight at 4°C. The        the Intracellular Fixation and Permeabilization Buffer (BD
wells were then washed with wash buffer (0.05% Tween-20            Cytofix/Cytoperm Plus Kit with BD GolgiPlug, 555028; BD
in PBS) and incubated with the appropriate antibodies             Pharmingen™) was used. The experiment was set up accord-
(50 μL) for 2 h. The antibodies included biotinylated anti-       ing to the recommendations of BD Pharmingen. During
mouse IgE (1 : 1000; 408804; BioLegend, San Diego, CA,            sample gating, cells were gated against LLN. The LLN gate
USA), biotinylated goat anti-mouse IgG1 secondary antibody        determined CD4+ cells. IL-4+ T cell expression was deter-
(1 : 10000; NBP1-69914B; Novus Biologicals, Littleton, CO,        mined from the gated population.
USA), and biotin goat anti-mouse IgG2a secondary antibody
(1 : 10000; NBP1-69915B; Novus Biologicals). The wells were       2.10. Statistical Analysis. All results are expressed as mean
then incubated with an avidin-horseradish peroxidase (HRP)         ± SEM. Statistical analysis was performed using the Graph-
conjugate (BioLegend) for 30 min, followed by incubation          Pad Prism 9.0 software (GraphPad, Inc., La Jolla, CA, USA).
with the 3,3 ′ ,5,5′ tetramethyl benzidine (TMB) substrate        The graphs were created on Excel 2016 and GraphPad Prism
(50 μL) in the dark for 5 min. The reaction was stopped with      9.0 software (GraphPad). In the AHR, Ig, and cytokine, histo-
2 N·H2SO4 (50 μL). The absorbance was assessed at 450 nm          logical score, and FACS cell number experiments, binary com-
using VersaMax (Molecular Devices, Seoul, South Korea).           parisons were performed using the unpaired t-test where
Data were normalized to each PBS exposure control.                appropriate. The AHR multivariate data were evaluated for
     The splenocytes were isolated to analyze cytokine levels     group differences using repeated analysis of variance measures
and for cell culture. The isolated splenocytes and lung lymph     and one-way or two-way ANOVA followed by Bonferroni’s
nodes (LLN) were treated with an ACK hypotonic lysis solu-        post hoc test as applicable. The remaining data were analyzed
tion (Sigma-Aldrich) for lysis of erythrocytes for 2 min at       with ANOVA followed by Bonferroni’s post hoc test. p values
room temperature (25°C). After erythrocyte lysis, the remain-     < 0.05 were considered statistically significant.
ing cells were filtered through a 100 μm mesh (Small Parts Inc.
Miramar, FL, USA) and suspended in RPMI 1640 containing           3. Results
10% (v/v) heat-inactivated FBS (HyClone, Logan, UT, USA).
The cells (5 × 10⁶ cells/mL) were then plated on 48-well plates   3.1. AE Sensitization and Challenge Cause Airway
(30024, SPL, Gyeonggi-do, South Korea) in RPMI 1640 media         Hyperresponsiveness in the Mouse Model. In order to assess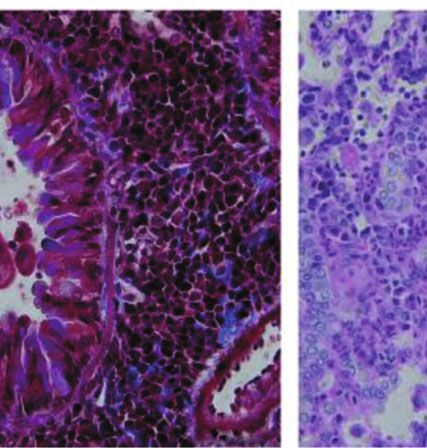
BioMed Research International                                                                                                                                                                   5

                   15                                                                                                        300

                                                                                                                                                                                        ⁎
                                                                                        ⁎⁎⁎⁎
                                                                                                                                                                          ⁎             ◭

                                                                                                          Ers (cmH2O.s/mL)
Rrs (cmH2O.s/mL)

                   10                                                                    ◭
                                                                                                                             200
                                                                                                                                                                          ◭

                    5                                                     ◭                                                  100
                                                                                                                                                            ◭

                                        ◭                                                                                                  ◭
                         ◭
                    0                                                                                                          0
                        0 mg/ml      12.5 mg/ml                      25 mg/ml          50 mg/ml                                         0 mg/ml         12.5 mg/ml    25 mg/ml       50 mg/ml

                                  Dose of methacholine (mg/ml)                                                                                        Dose of methacholine (mg/ml)
                                            (a)                                                                                                              (b)
                                                                    2.5

                                                                    2.0                                                                           ◭
                                                  Rn (cmH2O.s/mL)

                                                                    1.5
                                                                                                                                   ◭

                                                                    1.0
                                                                                                   ◭

                                                                    0.5
                                                                                   ◭

                                                                    0.0
                                                                              0 mg/ml          12.5 mg/ml                    25 mg/ml      50 mg/ml

                                                                                             Dose of methacholine (mg/ml)
                                                                                                    (c)
                                                                    60
                                                                                                                                               ⁎⁎⁎
                                                                                                                                                  ◭

                                                                                                                                   ⁎
                                                  G (cmH2O.s/mL)

                                                                    40

                                                                                                                                   ◭

                                                                    20

                                                                                                   ◭

                                                                                  ◭

                                                                     0
                                                                                0 mg/ml        12.5 mg/ml                    25 mg/ml      50 mg/ml

                                                                                             Dose of methacholine (mg/ml)
                                                                                                    (d)

                                                                                          Figure 2: Continued.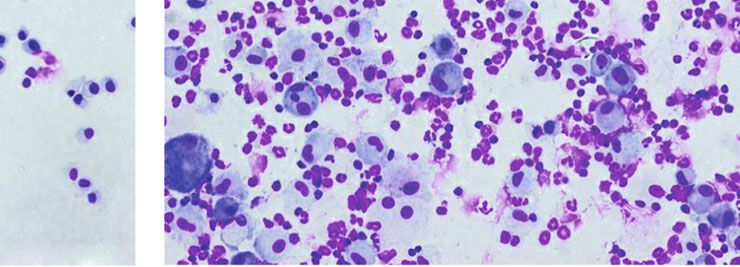
6 BioMed Research International
200
⁎⁎⁎
150
◭
H (cmH2O.s/mL)
100
◭
50 ◭
◭
0
0 mg/ml 12.5 mg/ml 25 mg/ml 50 mg/ml
Dose of methacholine (mg/ml)
◭
A.pegreffii
PBS
(e)
15 3
⁎⁎ 300 ⁎
Max (Rrs) (cmH2O.s/mL)
Max (Rn) (cmH2O.s/mL)
Max (Ers) (cmH2O.s/mL)
ns
10 200 2
5 100 1
0 0
PBS A.pegreffii 0 PBS A.pegreffii PBS A.pegreffii
80 200 ⁎
Max (G) (cmH2O.s/mL)
Max (H) (cmH2O.s/mL)
⁎⁎⁎ 150
60
40 100
20 50
0 0
PBS A.pegreffii PBS A.pegreffii
(f)
Figure 2: Improved methacholine reaction occurs in the 4-week Anisakis pegreffii crude extract model. (a–e) Pulmonary function evaluation
was performed by measuring the total respiratory resistance system (Rrs), elastance (Ers), alveolar tissue damping (G), and alveolar tissue
elastance (H) in all mice exposed to the A. pegreffii extract (AE) compared with the phosphate-buffered saline (PBS) control group. A
significant increase in methacholine was observed in H (a–e; ∗ p < 0:05; n = 5/group). (f) Except for total (or maximum) Newtonian
resistance (Rn) max, the increase in total (or maximum) airway resistance (Rrs max), total (or maximum) airway stiffness (Ers max),
total (or maximum) alveolar tissue damping (G max), and total (or maximum) alveolar tissue elastance (H max) was similar in all A.
pegreffii crude extract groups compared to the PBS control group (f; ∗ p < 0:05; n = 5/group).
airway function, mice sensitized and challenged with AE for system (Figure 3, p < 0:05, PBS vs. AE, n = 5/group). Fur-
4 weeks were compared to control mice exposed to PBS. The thermore, AE-specific IgG1 and IgG2a levels were signifi-
total Rrs, Ers, G, and H showed enhanced MCh reactivity cantly higher in the AE group than in the PBS treatment
(Figure 2; PBS at p < 0:05, n = 5/group). Interestingly, mice group.
sensitized and challenged with AE did not significantly
increase the Rn values of the central airways. 3.3. Airway Inflammation. In the BALF, total leukocyte
count demonstrated a gradual and significant increase over
3.2. Measurement of Specific Antibodies in Sera. Serum AE- time (Figure 4(a), p < 0:05, A. pegreffii vs. PBS, n = 5–
specific IgE levels were significantly elevated compared with 7/group). The 4-week AE model showed strong immune cell
those in the PBS control in the 4-week experimental model recruitment to the airways. Differential cell counts revealed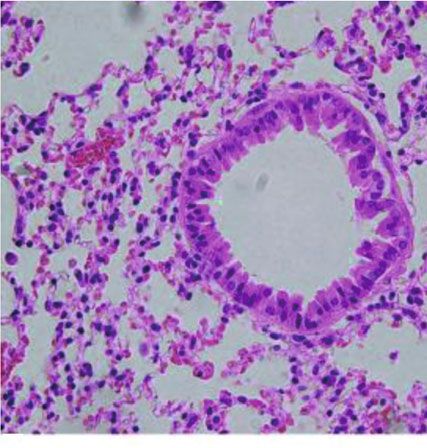
BioMed Research International 7
⁎⁎⁎⁎
0.50 1.5 1.5
⁎ ⁎⁎⁎⁎
(normalised to PBS)
(normalised to PBS)
(normalised to PBS)
0.45 1.0 1.0
0.40 0.5 0.5
A.
A.
0.35 0.0 0.0
A.
PBS A.p PBS A.p PBS A.p
Figure 3: Anisakis pegreffii extract (AE) treatment increases the expression of A. pegreffii-specific IgE, IgG1, and IgG2a. Measurement of A.
pegreffii-specific IgE (1 : 1000), IgG1 (1 : 10000), and IgG2a (1 : 10000) levels by ELISA (∗ p < 0:05; ∗∗ p < 0:01; ∗∗∗ p < 0:001; n = 5
mice/group).
PBS A. pegreffii
(a)
2000 ⁎ ⁎ ⁎ ⁎ ⁎
Different cells counting
1500
(No. x 103)
1000
500
0
s
es
ls
es
ell
ils
ag
hi
yt
ph
lc
op
ph
oc
ta
tro
sin
ro
ph
To
eu
ac
Eo
m
N
M
Ly
PBS
A. pegreffii
(b)
Figure 4: Treatment with the Anisakis pegreffii extract (AE) increases the total leukocyte count in the bronchoalveolar lavage fluid and the
production of eosinophils. (a, b) Typical micrographs and eosinophil counts in the bronchoalveolar lavage fluid (indicated in blue, pink, and
red) of mice challenged with phosphate-buffered saline (PBS) and AE, stained with Diff-Quik, are shown. Original magnification, 200x. Data
are presented as mean ± SEM (n = 5; ∗ p < 0:05; bar = 100 μm in each group).
an increase in the absolute cell counts of neutrophils, eosin- nated the total BAL leukocyte count, and the absolute cell
ophils, and lymphocytes (Figure 4(b), p < 0:05, A. pegreffii count was 4:06 × 105 monocytes/mouse and 1:33 × 105 eosi-
vs. PBS, n = 5–7/group). In the 4-week 25 μg AE model sys- nophils/mouse. Absolute BALF eosinophil count was higher
tem, an increase in eosinophils was consistent with an than that of the leukocyte subgroup, and the total fold
increase in serum A. pegreffii-specific IgE. Monocytes domi- increase was second only to that of monocytes. Compared
8                                                                                                                                                        BioMed Research International

            PBS
          A. pegreffii

                                                   H&E                                            Trichrome mason staining                                     PAS
                                                                                                           (a)
                                                                                                          Peribronchiolar
                                              10         Perivascular                                         ⁎⁎⁎⁎                           2.5         ⁎⁎⁎
                                                            ⁎⁎⁎⁎                                  8
                         Inflammation score

                                              8                                                                                              2.0
                                                                             Inflammation score

                                                                                                  6
                                                                                                                                PAS scores
                                              6                                                                                              1.5
                                                                                                  4
                                              4                                                                                              1.0

                                              2                                                   2                                          0.5

                                              0                                                   0                                          0.0
                                                     PBS      A. pegreffii                              PBS      A. pegreffii                      PBS   A. pegreffii
                                                                                                           (b)

Figure 5: Treatment with the Anisakis pegreffii extract (AE) increases inflammatory cell infiltration and mucus production. (a) Sections of
the lung were stained with hematoxylin and eosin, periodic acid-Schiff (PAS, goblet cell hyperplasia colored purple-magenta), and Masson’s
trichrome (collagen deposition colored cyan). Histological appearance of the lungs after treatment with AE (bar = 50 μm). (b) In
hematoxylin and eosin staining, some of the swollen lung sections were examined in a blinded fashion under a light microscope to
evaluate the “inflammation score” of each section, which is a product of the severity and prevalence of inflammation. The percentage of
PAS+ cells in the epithelial area was assessed in six sections per mouse. Each value was expressed as mean ± SEM (∗∗ p < 0:01; ∗∗∗ p <
0:001, n = 5 mice/group).

with that in the PBS control group, the relative increase in                                                     PAS+ cells in the epithelial region of AE-treated mice was
eosinophil count in AE mice was 13.1 times. Similarly, the                                                       more than doubled.
relative increase in neutrophils and lymphocytes in AE mice
was 9.4 and 39.5 times, respectively, compared with that in                                                      3.5. Expression of Inflammatory Mediators. Assessment of
the PBS control group.                                                                                           gene expression in the lungs using RT-qPCR revealed a pat-
                                                                                                                 tern of elevated expression of Th2-type cytokines in the AE
3.4. Airway Remodeling. After induction of airway inflam-                                                         mouse model. Expression of the inflammatory mediators
mation, inflammatory cells were observed in the peribron-                                                         IL-4, IL-5, and IL-13 was upregulated when exposed to AE
chial space. Using PAS staining, goblet cell hyperplasia and                                                     (Figures 6(a)–6(c), p < 0:05, AE vs. PBS, n = 5/group). Mice
large amounts of mucus production were detected in the air-                                                      exposed to AE demonstrated no difference in the expression
ways of AE-treated mice (Figure 5(a), PAS). Additionally,                                                        of the strong neutrophil chemoattractants Cxcl-1 and IL-17A
subepithelial collagen deposition (Figure 5(a), Masson tri-                                                      compared with the control group; however, IL-6 expression
chrome) was observed (p < 0:05, n = 5/group) in the AE-                                                          was found to increase in the AE group (not significant).
treated mice. Moreover, after AE treatment, the number of                                                        The eosinophil chemoattractant eotaxin-1 demonstrated an
inflammatory cells was significantly higher in the perivascu-                                                      increase in expression, but no significant difference was
lar and peribronchial regions of AE-treated mice than in the                                                     observed (Supplementary Figure S1, p < 0:05, AE vs. PBS,
control mice (Figure 5(b)). Additionally, the proportion of                                                      n = 5/group).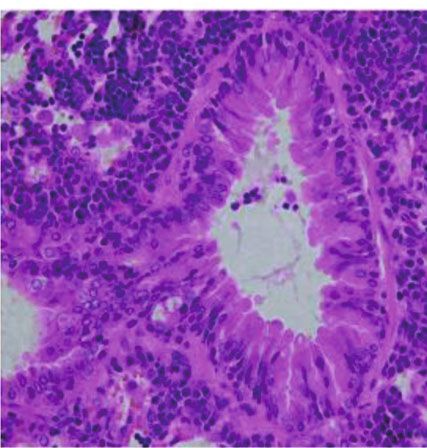
BioMed Research International                                                                                                                               9

                                     mlL-4                                             mlL-5                                            mlL-13
                        8             ⁎⁎                                  1.5           ⁎                                  1.5            ns
                        6                                                                                                  1.0
                                                                          1.0

                                                                                                           Rq
              Rq

                        4

                                                           Rq
                                                                                                                           0.5
                                                                          0.5
                        2
                                                                                                                           0.0
                        0                                                 0.0                                                    PBS          A.pegreffi
                             PBS            A.pegreffii                         PBS          A.pegreffii
                               (a)                                               (b)                                              (c)
                       200             ⁎⁎                                                ⁎                                                ⁎
                                                                          150
                                                                                                                           500
                       150
        IL-4 (pg/ml)

                                                                                                                           400

                                                           IL-5 (pg/ml)

                                                                                                           IL-13 (pg/ml)
                                                                          100
                       100                                                                                                 300
                                                                           50                                              200
                        50
                                                                                                                           100
                         0                                                  0
                             PBS             A.pegreffii                        PBS          A.pegreffii                     0
                                                                                                                                 PBS          A.pegreffii
                              (d)                                                (e)                                              (f)

Figure 6: Increased expression of Th2 cytokines in lung lymph nodes (LLN) of the 4-week Anisakis pegreffii extract (AE) model. (a–c) Based
on the reverse transcription-qPCR analysis of LLN tissue, the expression of IL-4, IL-5, and IL-13 was significantly increased in the AE-
sensitized model compared with the phosphate-buffered saline (PBS) group (d–f). IL-4, IL-5, and IL-13 (d–f) in the cell culture
supernatant of CD3-stimulated lymphocytes isolated from LLN (d–f) showed an elevated expression pattern (∗ p < 0:05; n = 5/group).

    An increased Th2 response was observed in the LLN cul-                             stages [58]. Allergens of Ani pe 1, 2, 12, and 13 have already
ture supernatant after treatment with AE. The LLN cells                                been reported for A. pegreffii [17]. Furthermore, it was
from AE-induced mice exhibited significant increase in IL-                              reported that it is possible to detect allergens sensitive to
4, IL-5, and IL-13 cytokine levels in the culture medium of                            IgE in the sera of Anisakis-infected patients. This indicates
these cells (Figures 6(d)–6(f), p < 0:05, AE vs. PBS, n = 5                            that these two species, although with slight genetic differ-
/group). Additionally, the levels of IFN-γ, a cytokine                                 ences, can cause the “Anisakis allergy” [59].
secreted by Th1, were significantly increased in samples                                    To date, there is a lack of model systems that replicate
obtained from the AE group (Supplementary Figure S1, p                                 the airway remodeling properties of asthma among animal
 < 0:05, AE vs. PBS, n = 5/group). Similar results were                                models using Anisakis. In the present study, the phenotypic
obtained in the flow cytometry analysis of LLN cells. The                               characteristics of allergic airway inflammation were com-
number of IL-4 secreting CD4+ T cells was found to be                                  pared using a protocol comprising chronic 4-week exposure
significantly increased (Figure 7 and Supplementary                                     to the AE antigen associated with the allergen. The 4-week
Figure S2, p < 0:05, AE vs. PBS, n = 5/group). Furthermore,                            AE model using daily AE exposure for 5 days a week showed
mean fluorescence intensity of the IL-4+ CD4+ cells was                                 enhanced MCh reactivity in AHR, similar to the 4-week
significantly increased in the AE-treated group compared                                house dust mite (HDM) model [43]. Airway inflammation,
with the control group (Figure 7, right panel).                                        as measured by leukocyte recruitment to the airway, was sig-
                                                                                       nificantly greater in the AE treatment group than in the con-
4. Discussion                                                                          trol group. Similar to that in the 4-week HDM model [43],
                                                                                       leukocytosis in BALF associated with the 4-week AE model
Anisakis is a marine parasite that infects humans due to the                           was primarily due to an increase in the eosinophil and neu-
consumption of marine fish. In 2011, 400 infections were                                trophil population. Our observations for the 4-week AE
reported in South Korea, since which the number of infec-                              group were similar to those from the previously reported
tions has steadily risen to 800 in 2018 [47–49]. A. simplex                            4-week HDM model [43], with a substantial increase in
has been reported to act as an allergen that causes asthma                             eosinophils accompanied by a significant increase (39.45%)
in workers handling fishes [7–9, 50]. A. pegreffii is a domi-                             in the number of BAL monocytes along with the total abso-
nant marine parasitic species, compared with other Anisakis                            lute monocyte count.
species, causing infections in the South Korean population                                 We also observed a greater extent of allergic reactions
[51, 52]. Furthermore, A. pegreffii may induce allergies as                              (e.g., HDM-specific IgE, IgG1, and IgG2a levels) in the AE
well based on the presence of A. pegreffii-tropomyosin in                                4-week model than in the control group (Figure 3). Several
the serum of patients with crustacean allergy [53]. A. pegref-                         animal allergic disease models have been developed to eluci-
fii-induced allergies have also been reported in animal                                 date the immune mechanism of anisakiasis. Specifically, IgE,
models [13, 35, 54]. A. simplex and A. pegreffii have been                               IgG1, and at times IgG2a were detected in the serum after an
reported as different species with genetic differences                                   HDM, Trichinella spiralis, and ovalbumin (OVA) infection
[55–57] but can be distinguished only at the L4 or adult                               [60–63]. Moreover, Th2 cytokines were produced in some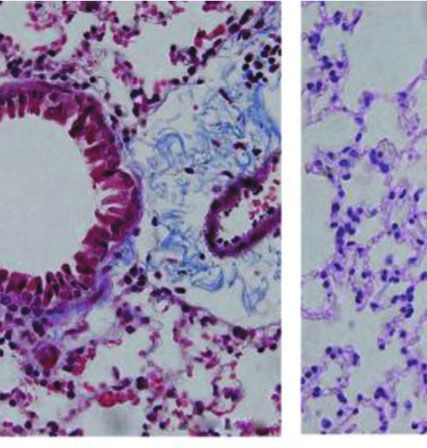
10 BioMed Research International
x1,000
WLSM WLSM WLSM
500
600
400 400
Live: 79.41%
500
FSC_W
SSC_W
FSC_H
300
200 400 300 Singlets_FSC:97.68%
300 Singlets_SSC:89.38%
100
200 200
200 400 600 200 400 600 0 50 100 150
x1,000 x1,000 x1,000
FSC_A FSC_A SSC_A
All events Live Singlets_SSC
WLSM WLSM
IL-4+:0.60% IL-4+:1.00%
CD4+IL-4+T cell:1.86% CD4+IL-4+T cell:1.22%
104 104 AE
PBS
103 103
PE-Cy7_A
⁎
PE-Cy7_A
300
Cell number (102)
102 102 200
–101 –101 100
–102 CD4+:55.59% –102 CD4+:21.45%
0
–102 –101 102 103 104 –102 –101 102 103 104 PBS AE
APC_A APC_A
Singlets_FSC Singlets_FSC
Figure 7: Expression of the IL-4+ CD4+ marker in lung lymph nodes (LLN). Expression of the IL-4 marker in the LLN of Anisakis pegreffii
extract- (AE-) sensitized and control mice was analyzed using flow cytometry. Lymphocytes from LLN were incubated with a stimulated
anti-CD3e antibody. After staining, lymphocytes were initially gated for CD4+ cells, and the percentage of IL-4+ cells was calculated
using FACS analysis. The IL-4+ CD4+ T cell number is plotted in the right panel.
cases, even if a mixed Th1/Th2 cell response was observed gene expression compared with HDM-induced asthma.
[29, 64–66]. Allergic reactions to A. simplex induce a type The neutrophil mediators Cxcl-1 and IL-17A are expressed
I hypersensitivity reaction in guinea pigs, rabbits, and at the onset of neutrophil inflammation and have been
humans, and anti-A. simplex IgE levels increase rapidly at reported to show the highest levels in a 2-week HDM expo-
the beginning of infection [67]. Furthermore, in an infection sure model [33]. In contrast, in our 4-week AE model, there
model in which A. pegreffii was administered orally after was no change or a tendency to decrease when compared
intraperitoneal infection, the concentrations of IgE, IgG1, with the PBS control group (Supplemental Figure S1). We
and IgG2a in the blood steadily increased up to 4 weeks after also observed increased expression of IL-6 and eotaxin-1
infection [66]. Thus, the results of our study are similar to in the 4-week AE model; however, eosinophil recruitment
previous findings. Continuous intranasal challenge of AE to the airways was not significant despite an increase of
for 4 weeks suggested that this method was suitable for 13.07% compared with that in the PBS control. These
inducing allergic reactions in mice (Figure 3). differences in observations may be due to differences in the
With regard to the allergic airway remodeling in the AE- number, frequency, and duration of allergen exposure in
treated mice, an increased number of PAS+ cells were observed the protocols used in the two studies, as well as the specific
4 weeks after AE sensitization/exposure (Figure 5(b)). allergens used.
Masson’s trichrome staining of the airways confirmed A hallmark of asthma is elevation in the levels of Th2-
peribronchial collagen deposition in the 4-week AE model type cytokines, such as IL-4 and IL-13 [31, 33, 67]. We
(Figure 5(a)). Our findings were similar to those of a previous observed an increasing trend in IL-4 and IL-13 mRNA
study wherein the main features of airway remodeling, expression in the 4-week model. Indeed, increased levels of
namely, epithelial thickening, smooth muscle proliferation, the IL-4 and IL-13 cytokines in the mouse A. pegreffii model
and collagen deposition, required sustained exposure to have previously been reported [7]. IL-6 is a cytokine that
HDM allergens for at least 4 weeks [43]. controls the pathogenesis of asthma and the early stages of
Our investigation of the inflammatory response demon- development of Th2 cells, a biomarker of asthma exacerba-
strated differences in the leukocyte recruitment mediator tion [68]. In our model, the expression of IL-6 increased atBioMed Research International 11
4 weeks of A. pegreffii exposure, consistent with the mainte- of the control group (B, C) (∗ p < 0:05; n = 5/group). Supple-
nance of airway remodeling. Although previous studies have mentary Figure S2: expression of the IL-4+ CD4+ marker in
demonstrated AHR of A. pegreffii-induced allergic airway splenocytes. Expression of the IL-4 marker in the spleno-
inflammation, they found that it showed airway inflammation, cytes of AE-sensitized and control mice was analyzed using
systemic allergic reaction, airway remodeling, and other phe- flow cytometry. Lymphocytes from splenocytes were incu-
notypic features in other A. pegreffii mouse models [69, 70]. bated with a stimulated anti-CD3e antibody. After staining,
These differences may be related to changes in the frequency, lymphocytes were initially gated for CD4+ cells, and the per-
dosage, and duration of allergen exposure. Our 4-week model centage of IL-4+ cells was calculated using FACS analysis.
revealed that the expression of neutrophil inflammation and The IL-4+ CD4+ T cell number is plotted in the right panel.
associated mediators, such as Cxcl-1 and IL-17A, did not trig- Supplementary Table 1: primer sequence, target gene, and
ger an initial inflammatory response compared to that in the cycling conditions for SYBR green RT-PCR. (Supplementary
PBS control group. We detected an increase in eotaxin-1 gene Materials)
expression; however, the increase was not statistically signifi-
cant. In 2 weeks, the model using A. pegreffii allergen appeared References
to similarly exhibit acute allergic airway inflammation.
Thus, the chronic allergic airway inflammation model [1] N. Arizono, M. Yamada, T. Tegoshi, and M. Yoshikawa, “Ani-
described in this study potently recapitulated airway remod- sakis simplex sensu stricto and Anisakis pegreffii: biological
eling with collagen deposition. characteristics and pathogenetic potential in human anisakia-
sis,” Foodborne Pathogens and Disease, vol. 9, no. 6, pp. 517–
4.1. Conclusion Remarks and Perspectives. We propose that 521, 2012.
our 4-week 25 μg AE model may be a suitable method for [2] I. Mladineo and J. Hrabar, “Anisakis pegreffii,” Trends in Par-
studying asthma characterized by AHR, airway inflamma- asitology, vol. 36, no. 8, pp. 717-718, 2020.
tion, and airway remodeling through collagen deposition. [3] S. Mattiucci, P. Cipriani, A. Levsen, M. Paoletti, and
A limitation of our experiment was that asthma symptoms G. Nascetti, “Chapter four-molecular epidemiology of Anisa-
were reproduced with an intranasal challenge rather than kis and anisakiasis: an ecological and evolutionary road
as droplets (asthma symptoms caused by Anisakis in map,” in Advances in Parasitology, D. Rollinson and J. R.
Stothard, Eds., pp. 93–263, Academic Press, 2018.
workers are mainly due to droplets). Another limitation is
that we did not attempt to determine a therapeutic agent [4] S. J. Choi, J. C. Lee, M. J. Kim, G. Y. Hur, S. Y. Shin, and H. S.
Park, “The clinical characteristics of Anisakis allergy in
to treat asthma accompanying the airway remodeling phe-
Korea,” Korean Journal of Internal Medicine, vol. 24, no. 2,
nomenon induced in mice. Future experiments should pp. 160–163, 2009.
explore these avenues further and reveal the correlation with
[5] T. Arai, N. Akao, T. Seki et al., “Molecular genotyping of Ani-
intestinal bacteria when Anisakis-induced asthma develops. sakis larvae in Middle Eastern Japan and endoscopic evidence
for preferential penetration of normal over atrophic mucosa,”
Data Availability PLoS One, vol. 9, no. 2, article e89188, 2014.
[6] M. F. Jeebhay, T. G. Robins, S. B. Lehrer, and A. L. Lopata,
The authors can provide the data analyzed in this study
“Occupational seafood allergy: a review,” Occupational and
upon reasonable request. Environmental Medicine, vol. 58, no. 9, pp. 553–562, 2001.
[7] N. Nieuwenhuizen, A. L. Lopata, M. F. Jeebhay, D. R. Herbert,
Conflicts of Interest T. G. Robins, and F. Brombacher, “Exposure to the fish para-
site Anisakis causes allergic airway hyperreactivity and derma-
The authors declare no conflict of interest.
titis,” Journal of Allergy and Clinical Immunology, vol. 117,
no. 5, pp. 1098–1105, 2006.
Acknowledgments [8] A. Armentia, M. Lombardero, A. Callejo et al., “Occupational
asthma by _Anisakis simplex_,” Journal of Allergy and Clinical
This study was carried out in part in the Flow Cytometry Core
Immunology, vol. 102, no. 5, pp. 831–834, 1998.
Facility in the Yonsei University College of Medicine. We
would like to thank Editage (http://www.editage.co.kr/) for [9] N. E. Nieuwenhuizen and A. L. Lopata, “Allergic reactions to
Anisakis found in fish,” Current Allergy and Asthma Reports,
English language editing. This study was supported by the
vol. 14, no. 8, p. 455, 2014.
National Research Foundation of Korea (NRF) grant funded
[10] F. J. Baird, R. B. Gasser, A. Jabbar, and A. L. Lopata, “Food-
by the Korean Government (NRF-2019R1A2B5B01069843)
borne anisakiasis and allergy,” Molecular and Cellular Probes,
and a grant from the Korea Association of Health Promotion vol. 28, no. 4, pp. 167–174, 2014.
(2021-KAHP-P03).
[11] F. Kirstein, W. G. Horsnell, N. Nieuwenhuizen, B. Ryffel, A. L.
Lopata, and F. Brombacher, “Anisakis pegreffii-induced air-
Supplementary Materials way hyperresponsiveness is mediated by gamma interferon
in the absence of interleukin-4 receptor alpha responsiveness,”
Supplementary Figure S1: expression of eotaxin-1, IL-6, and Infection and Immunity, vol. 78, no. 9, pp. 4077–4086, 2010.
IFN-γ is upregulated with AE exposure. Expression of [12] E. Scala, M. Giani, L. Pirrotta et al., “Occupational generalised
eotaxin-1, IL-6, and IFN-γ (A, D, E, F) was upregulated in urticaria and allergic airborne asthma due to anisakis simplex,”
the AE model compared with the PBS control group. How- European Journal of Dermatology: EJD, vol. 11, no. 3, pp. 249-
ever, Cxcl1 and IL-17a expression did not differ from that 250, 2001.12 BioMed Research International
[13] M. L. Baeza, L. Conejero, Y. Higaki et al., “Anisakis simplex [30] A. T. Reddy, S. P. Lakshmi, and R. C. Reddy, “Murine model of
allergy: a murine model of anaphylaxis induced by parasitic allergen induced asthma,” Journal of visualized experiments:
proteins displays a mixed Th1/Th2 pattern,” Clinical and JoVE, vol. 63, 2012.
Experimental Immunology, vol. 142, no. 3, pp. 433–440, 2005. [31] S. Hall and D. K. Agrawal, “Key mediators in the immuno-
[14] A. A. Mourad and S. L. Bahna, “Fish-allergic patients may be pathogenesis of allergic asthma,” International Immunophar-
able to eat fish,” Expert Review of Clinical Immunology, macology, vol. 23, no. 1, pp. 316–329, 2014.
vol. 11, no. 3, pp. 419–430, 2015. [32] S. G. Royce, K. P. Patel, and C. S. Samuel, “Characterization of
[15] O. Barbuzza, F. Guarneri, G. Galtieri, S. Gangemi, and a novel model incorporating airway epithelial damage and
M. Vaccaro, “Protein contact dermatitis and allergic asthma related fibrosis to the pathogenesis of asthma,” Laboratory
caused by Anisakis simplex,” Contact Dermatitis, vol. 60, Investigation, vol. 94, no. 12, pp. 1326–1339, 2014.
no. 4, pp. 239-240, 2009. [33] H. Piyadasa, A. Altieri, S. Basu, J. Schwartz, A. J. Halayko, and
[16] E. Rodríguez, A. M. Anadón, E. García-Bodas et al., “Novel N. Mookherjee, “Biosignature for airway inflammation in a
sequences and epitopes of diagnostic value derived from the house dust mite-challenged murine model of allergic asthma,”
Anisakis simplex Ani s 7 major allergen,” Allergy, vol. 63, Biology Open, vol. 5, no. 2, pp. 112–121, 2016.
no. 2, pp. 219–225, 2008. [34] A. T. Nials and S. Uddin, “Mouse models of allergic asthma:
[17] J. Y. Kim, M. H. Yi, and T. S. Yong, “Allergen-like molecules acute and chronic allergen challenge,” Disease Models & Mech-
from parasites,” Current Protein & Peptide Science, vol. 21, anisms, vol. 1, no. 4-5, pp. 213–220, 2008.
no. 2, pp. 186–202, 2020. [35] L. Haryadi, E. Suprayitno, A. Aulanni'am, and A. M. Hariati,
[18] S. Mouritsen, M. Meldal, J. Ruud-Hansen, and O. Werdelin, “Immune response evaluation in Balb/c mice after crude
“T-helper-cell determinants in protein antigens are preferen- extract of Anisakis typica sensitization,” Veterinary World,
tially located in cysteine-rich antigen segments resistant to vol. 12, no. 10, pp. 1529–1534, 2019.
proteolytic cleavage by cathepsin B, L, and D,” Scandinavian [36] D. S. Southam, R. Ellis, J. Wattie, and M. D. Inman, “Compo-
Journal of Immunology, vol. 34, no. 4, pp. 421–431, 1991. nents of airway hyperresponsiveness and their associations
[19] M. L. Baeza, A. Rodriguez, V. Matheu et al., “Characterization with inflammation and remodeling in mice,” Journal of Allergy
of allergens secreted by Anisakis simplex parasite: clinical rel- and Clinical Immunology, vol. 119, no. 4, pp. 848–854, 2007.
evance in comparison with somatic allergens,” Clinical and [37] H. Vroman, I. M. Bergen, B. W. Li et al., “Development of
Experimental Allergy, vol. 34, no. 2, pp. 296–302, 2004. eosinophilic inflammation is independent of B-T cell interac-
[20] J. Sastre, M. Lluch-Bernal, S. Quirce et al., “A double-blind, tion in a chronic house dust mite-driven asthma model,” Clin-
placebo-controlled oral challenge study with lyophilized larvae ical and Experimental Allergy, vol. 47, no. 4, pp. 551–564, 2017.
and antigen of the fish parasite, Anisakis simplex,” Allergy, [38] W. J. Lee, D. J. Seo, H. Oh, S. B. Jeon, D. Jung, and C. Choi,
vol. 55, no. 6, pp. 560–564, 2000. “Simultaneous detection and prevalence of allergens in Anisa-
[21] L. Audicana, M. Audicana, L. F. de Corres, and M. Kennedy, kis species isolated from marine fishes,” Journal of Food Pro-
Cooking and Freezing May Not Protect against Allergenic Reac- tection, vol. 79, no. 5, pp. 789–794, 2016.
tions to Ingested Anisakis Simplex Antigens in Humans, British [39] K. H. Shalaby, L. G. Gold, T. F. Schuessler, J. G. Martin, and
Medical Journal Publishing Group, 1997.
A. Robichaud, “Combined forced oscillation and forced expi-
[22] M. A. T. Audicana, I. J. Ansotegui, L. F. de Corres, and M. W. ration measurements in mice for the assessment of airway
Kennedy, “Anisakis simplex: dangerous—dead and alive?,” hyperresponsiveness,” Respiratory Research, vol. 11, no. 1,
Trends in Parasitology, vol. 18, no. 1, pp. 20–25, 2002. p. 82, 2010.
[23] X. Li, “Hot topic: precision medicine for asthma-has the time [40] N. Malikides, K. J. Hughes, D. R. Hodgson, and J. L. Hodgson,
come?,” Current Allergy and Asthma Reports, vol. 19, no. 10, “Comparison of tracheal aspirates and bronchoalveolar lavage
p. 45, 2019. in racehorses. 2. Evaluation of the diagnostic significance of
[24] S. E. Wenzel, “Asthma phenotypes: the evolution from clinical neutrophil percentage,” Australian Veterinary Journal,
to molecular approaches,” Nature Medicine, vol. 18, no. 5, vol. 81, no. 11, pp. 685–687, 2003.
pp. 716–725, 2012. [41] M. Verma, S. Liu, L. Michalec, A. Sripada, M. M. Gorska, and
[25] S. Wenzel, “Severe asthma: from characteristics to phenotypes R. Alam, “Experimental asthma persists in IL-33 receptor
to endotypes,” Clinical and Experimental Allergy, vol. 42, no. 5, knockout mice because of the emergence of thymic stromal
pp. 650–658, 2012. lymphopoietin-driven IL-9(+) and IL-13(+) type 2 innate lym-
[26] N. G. Jendzjowsky and M. M. Kelly, “The role of airway myo- phoid cell subpopulations,” Journal of Allergy and Clinical
fibroblasts in asthma,” Chest, vol. 156, no. 6, pp. 1254–1267, Immunology, vol. 142, no. 3, pp. 793–803, 2018.
2019. [42] H. J. Park, H. Han, E. Y. Oh et al., “Empagliflozin and dulaglu-
[27] S. G. Royce and M. L. Tang, “The effects of current therapies tide are effective against obesity-induced airway hyperrespon-
on airway remodeling in asthma and new possibilities for siveness and fibrosis in a murine model,” Scientific Reports,
treatment and prevention,” Current Molecular Pharmacology, vol. 9, no. 1, 2019.
vol. 2, no. 2, pp. 169–181, 2009. [43] L. N. Woo, W. Y. Guo, X. Wang et al., “A 4-week model of
[28] J. V. Fahy, D. B. Corry, and H. A. Boushey, “Airway inflamma- house dust mite (HDM) induced allergic airways inflamma-
tion and remodeling in asthma,” Current Opinion in Pulmo- tion with airway remodeling,” Scientific Reports, vol. 8, no. 1,
nary Medicine, vol. 6, no. 1, pp. 15–20, 2000. 2018.
[29] R. Iglesias, J. Leiro, F. M. Ubeira, M. T. Santamarina, and M. L. [44] B. Flahou, K. Van Deun, F. Pasmans et al., “The local immune
Sanmartin, “Anisakis simplex: antigen recognition and anti- response of mice after Helicobacter suis infection: strain differ-
body production in experimentally infected mice,” Parasite ences and distinction with Helicobacter pylori,” Veterinary
Immunology, vol. 15, no. 5, pp. 243–250, 1993. Research, vol. 43, no. 1, pp. 1–10, 2012.BioMed Research International 13
[45] S. Kang, J. S. Yoon, J. Y. Lee, H.-J. Kim, K. Park, and S. E. Kim, the diagnosis of allergic anisakiasis,” Parasite Immunology,
“Long-term local PDGF delivery using porous microspheres vol. 39, no. 7, 2017.
modified with heparin for tendon healing of rotator cuff tendi- [60] Y. T. Wang, H. C. Liu, H. C. Chen et al., “Oral immunotherapy
nitis in a rabbit model,” Carbohydrate Polymers, vol. 209, with the ingestion of house dust mite extract in a murine
pp. 372–381, 2019. model of allergic asthma,” Allergy, Asthma and Clinical Immu-
[46] J. R. Frohlich, C. N. Alarcon, C. R. Toarmino, A. K. Sunseri, nology, vol. 14, no. 1, 2018.
and T. M. Hockman, “Comparison of serial blood collection [61] C. Doras, F. Petak, S. Bayat et al., “Lung responses in murine
by facial vein and retrobulbar methods in C57BL/6 mice,” models of experimental asthma: value of house dust mite over
Journal of the American Association for Laboratory Animal ovalbumin sensitization,” Respiratory Physiology & Neurobiol-
Science, vol. 57, no. 4, pp. 382–391, 2018. ogy, vol. 247, pp. 43–51, 2018.
[47] J. Y. Kim, M. H. Yi, and T. S. Yong, “Parasitic infections and [62] S. A. Kang, M.-K. Park, M. K. Cho et al., “Parasitic nematode-
medical expenses according to Health Insurance Review induced CD4+Foxp3+T cells can ameliorate allergic airway
Assessment claims data in South Korea, 2011-2018,” PLoS inflammation,” PLoS Neglected Tropical Diseases, vol. 8,
One, vol. 14, no. 11, article e0225508, 2019. no. 12, article e3410, 2014.
[48] E. H. Shin, S. M. Guk, H. J. Kim, S. H. Lee, and J. Y. Chai, [63] C. M. Trujillo-Vargas, K. D. Mayer, T. Bickert et al., “Vaccina-
“Trends in parasitic diseases in the Republic of Korea,” Trends tions with T-helper type 1 directing adjuvants have different
in Parasitology, vol. 24, no. 3, pp. 143–150, 2008. suppressive effects on the development of allergen-induced
[49] J. G. Chi, R. H. Sung, and S. Y. Cho, “Tissue parasitic diseases T-helper type 2 responses,” Clinical and Experimental Allergy,
in Korea,” Journal of Korean Medical Science, vol. 3, no. 2, vol. 35, no. 8, pp. 1003–1013, 2005.
pp. 51–62, 1988. [64] T. H. Cho, H. Y. Park, S. Cho et al., “The time course of biolog-
[50] F. Purello-D’Ambrosio, E. Pastorello, S. Gangemi et al., “Inci- ical and immunochemical allergy states induced by anisakis
dence of sensitivity to _Anisakis simplex_ in a risk population simplex larvae in rats,” Clinical and Experimental Immunol-
of fishermen/fishmongers,” Annals of Allergy, Asthma & ogy, vol. 143, no. 2, pp. 203–208, 2006.
Immunology, vol. 84, no. 4, pp. 439–444, 2000. [65] S. W. Cho and H. N. Lee, “Immune reactions and allergy in
[51] H. Lim, B. K. Jung, J. Cho, T. Yooyen, E. H. Shin, and J. Y. experimental anisakiasis,” Korean Journal of Parasitology,
Chai, “Molecular diagnosis of cause of anisakiasis in humans, vol. 44, no. 4, pp. 271–283, 2006.
South Korea,” Emerging Infectious Diseases, vol. 21, no. 2, [66] A. Ludovisi, G. di Felice, N. Carballeda-Sangiao et al., “Aller-
pp. 342–344, 2015. genic activity of Pseudoterranova decipiens (Nematoda: Ani-
[52] H. Song, B. K. Jung, J. Cho, T. Chang, S. Huh, and J. Y. Chai, sakidae) in BALB/c mice,” Parasites & Vectors, vol. 10, no. 1,
“Molecular identification of Anisakis larvae extracted by gas- p. 290, 2017.
trointestinal endoscopy from health check-up patients in [67] M. T. Audicana and M. W. Kennedy, “Anisakis simplex: from
Korea,” Korean Journal of Parasitology, vol. 57, no. 2, obscure infectious worm to inducer of immune hypersensitiv-
pp. 207–211, 2019. ity,” Clinical Microbiology Reviews, vol. 21, no. 2, pp. 360–379,
[53] A. Asnoussi, I. E. Aibinu, R. B. Gasser, A. L. Lopata, and P. M. 2008.
Smooker, “Molecular and immunological characterisation of
[68] A. Doganci, K. Sauer, R. Karwot, and S. Finotto, “Pathological
tropomyosin from Anisakis pegreffii,” Parasitology Research,
role of IL-6 in the experimental allergic bronchial asthma in
vol. 116, no. 12, pp. 3291–3301, 2017.
mice,” Clinical Reviews in Allergy & Immunology, vol. 28,
[54] M. K. Cho, S. C. Ahn, D. H. Kim, and H. S. Yu, “Parasite no. 3, pp. 257–270, 2005.
excretory-secretory proteins elicit TRIF dependent CXCL1
[69] M. K. Cho, M. K. Park, S. A. Kang et al., “Allergenicity of two
and IL-6 mediated allergic inflammation,” Parasite Immunol-
_Anisakis simplex_ allergens evaluated _in vivo_ using an
ogy, vol. 32, no. 5, pp. 354–360, 2010.
experimental mouse model,” Experimental Parasitology,
[55] E. Abollo, L. Paggi, S. Pascual, and S. D'Amelio, “Occurrence of vol. 146, pp. 71–77, 2014.
recombinant genotypes of Anisakis simplex s.s. and Anisakis
[70] H. K. Park, M. K. Cho, M. K. Park et al., “A 24 kDa excretory-
pegreffii (Nematoda: Anisakidae) in an area of sympatry,” Infec-
secretory protein of Anisakis simplex larvae could elicit aller-
tion, Genetics and Evolution, vol. 3, no. 3, pp. 175–181, 2003.
gic airway inflammation in mice,” Korean Journal of Parasitol-
[56] A. Umehara, Y. Kawakami, T. Matsui, J. Araki, and A. Uchida, ogy, vol. 49, no. 4, pp. 373–380, 2011.
“Molecular identification of Anisakis simplex sensu stricto and
Anisakis pegreffii (Nematoda: Anisakidae) from fish and ceta-
cean in Japanese waters,” Parasitology International, vol. 55,
no. 4, pp. 267–271, 2006.
[57] G. Z. Pekmezci, E. E. Onuk, C. S. Bolukbas et al., “Molecular
identification of Anisakis species (Nematoda: Anisakidae)
from marine fishes collected in Turkish waters,” Veterinary
Parasitology, vol. 201, no. 1-2, pp. 82–94, 2014.
[58] K. M. Quiazon, T. Yoshinaga, K. Ogawa, and R. Yukami,
“Morphological differences between larvae and in vitro-cul-
tured adults of Anisakis simplex (sensu stricto) and Anisakis
pegreffii (Nematoda: Anisakidae),” Parasitology International,
vol. 57, no. 4, pp. 483–489, 2008.
[59] S. Mattiucci, A. Colantoni, B. Crisafi et al., “IgE sensitization
toAnisakis pegreffiiin Italy: comparison of two methods forYou can also read