Tourism Situation Analysis - as at July 2019 - Gawler Council
←
→
Page content transcription
If your browser does not render page correctly, please read the page content below
Tourism Situation Analysis
          as at July 2019
Tourism eSchool
Paige Rowett + Rebecca White
PO Box 104
Black Forest SA 5035
+61 408 085262
tourismeschool.com

This Plan has been prepared by Tourism eSchool between December 2018 – July 2019.

© Copyright, Tourism eSchool, 2019

This work is copyright. Apart from any uses permitted under Copyright Act 1963, no part may be reproduced without
written permission of Tourism eSchool

Disclaimer

The information contained in this report is intended only to inform and it is expected that all recommendations should
be analysed, and appropriate due diligence undertaken prior to making any investment decisions.

In the course of our preparation of the document, recommendations have been made on the basis of assumptions,
methodology and information provided by many sources through the consultation process (See Acknowledgements).

Whilst every effort was made to report on the most accurate data and information available, Tourism eSchool accept
no responsibility or liability for any changes in operation/destination circumstance, errors, omissions, or resultant
consequences including any loss or damage arising from reliance on the information contained in this report.

TOWN OF GAWLER    |   TOURISM SITUATION ANALYSIS, JULY 2019                                                        PAGE 1
Statement of Acknowledgement
Council acknowledge the land of the Gawler Township is the traditional lands for the Kaurna people and that we respect
their spiritual relationship with their country.

We also acknowledge the Kaurna people as the custodians of the greater Adelaide region and that their cultural and
heritage beliefs are still as important to the living Kaurna people today.

TOWN OF GAWLER    |   TOURISM SITUATION ANALYSIS, JULY 2019                                                     PAGE 2
Contents
About this Document .................................................................................................................................... 1
     Where to start… ......................................................................................................................................................... 1
Executive Summary ....................................................................................................................................... 2
1.          SETTING THE SCENE ........................................................................................................................... 3
2.          VISITOR ECONOMY INSIGHTS ........................................................................................................ 12
3.          MARKET SEGMENTATION ............................................................................................................... 29
4.          STAKEHOLDERS ................................................................................................................................. 43
5.          TOURISM ASSETS............................................................................................................................... 52
6.          TOURISM ACCESS............................................................................................................................... 67
7.          TOURISM INFRASTRUCTURE ......................................................................................................... 74
8.          TOURISM RESOURCES ...................................................................................................................... 76
9.          BRANDING ........................................................................................................................................... 77
10.         MARKETING ........................................................................................................................................ 79
11.         VISITOR SERVICING .......................................................................................................................... 80
12.         SWOT ANALYSIS................................................................................................................................. 86
13.         ACKNOWLEDGEMENTS .................................................................................................................... 93
14.         REFERENCES ....................................................................................................................................... 94

TOWN OF GAWLER              |    TOURISM SITUATION ANALYSIS, JULY 2019                                                                                                  PAGE 3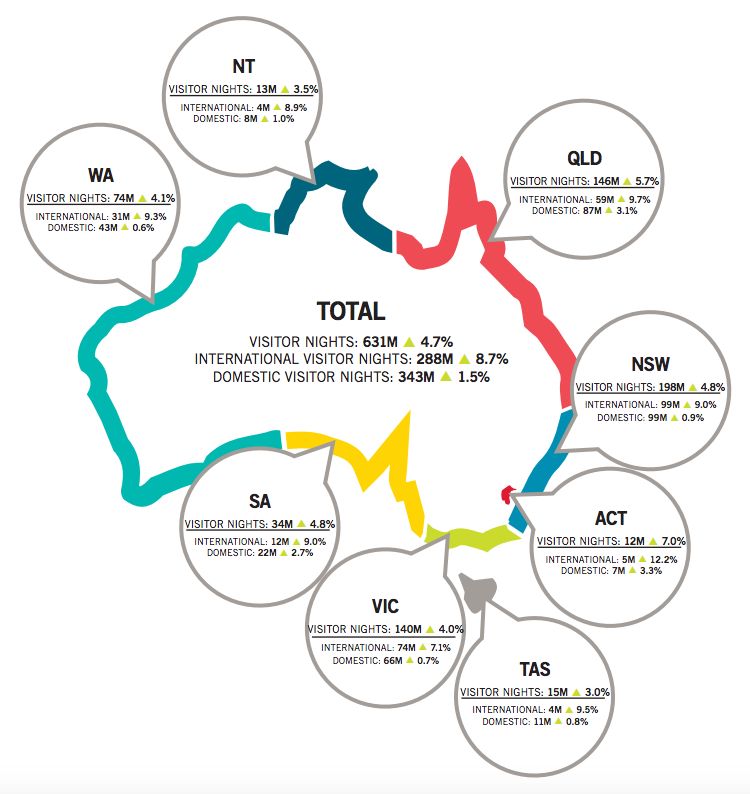
Index of Figures Glossary
Figure 1 - Barossa Tourism Region Map (SATC) ............................................................................ 8 ABS – Australian Bureau of Statistics
Figure 2 - Town of Gawler Municipality Map .............................................................................. 10 ATDW – Australian Tourism Data
Figure 3 - Barossa Region Tourism Expenditure 2010-2015........................................................ 13 Warehouse
BVIC – Barossa Visitor Information Centre
Figure 4 - Tourism Businesses in the Barossa Tourism Region, FY2010-FY2015 ......................... 14
DPTEI – Department of Planning,
Figure 5 - Barossa Tourism Region Visitation Data Dec 2015 - Dec 2017 .................................... 15
Transport and Infrastructure
Figure 6 - TOG VIC, Total Visitors Serviced (in person + phone) .................................................. 17 BT – Barossa Trail (formerly Jack Bobridge
Figure 7 - TOG VIC, Total Domestic Visitors vs Total International YE2015-YE2018 .................... 18 Track)
Figure 8 - TOG VIC, All Market Comparison, YE2015-YE2018...................................................... 18 KVIC – Kapunda Visitor Information Centre
Figure 9 - TOG VIC, Interstate Visitor Profile YE2015-YE2018 ..................................................... 19 LGA – Local Government Association
Figure 10 - TOG VIC, International Visitor Profile YE2015-YE2018 .............................................. 19
LRC – Light Regional Council
GBH – Gawler Bike Hub
Figure 11 - Consumer Confidence Index, 2009-2019 .................................................................. 22
GHT – Gawler History Team
Figure 12 - Australian Interest Rate Index, 2009-2019................................................................ 23
GRP – Gawler Rivers Path (Tapa Pariara)
Figure 13 - AUD / US Exchange Rate History, 2009-2019 ............................................................ 24 NHTSAG – National History Trust of SA -
Figure 14 - South Australian Tourism Growth 2017-2018 ........................................................... 27 Gawler Branch
Figure 15 - South Australian Tourism Growth 2018-2019 ........................................................... 28 RDA BGLAP – Regional Development
Figure 16 - South Australian Regional Dispersal Forecast 2016-2017 -> 2026-2027 ................... 28 Australia Barossa, Gawler, Light + Adelaide
Plains
Figure 17 - Differences in Visitor Behaviour by Origin September 2018 ..................................... 32
RTO – Regional Tourism Organisation
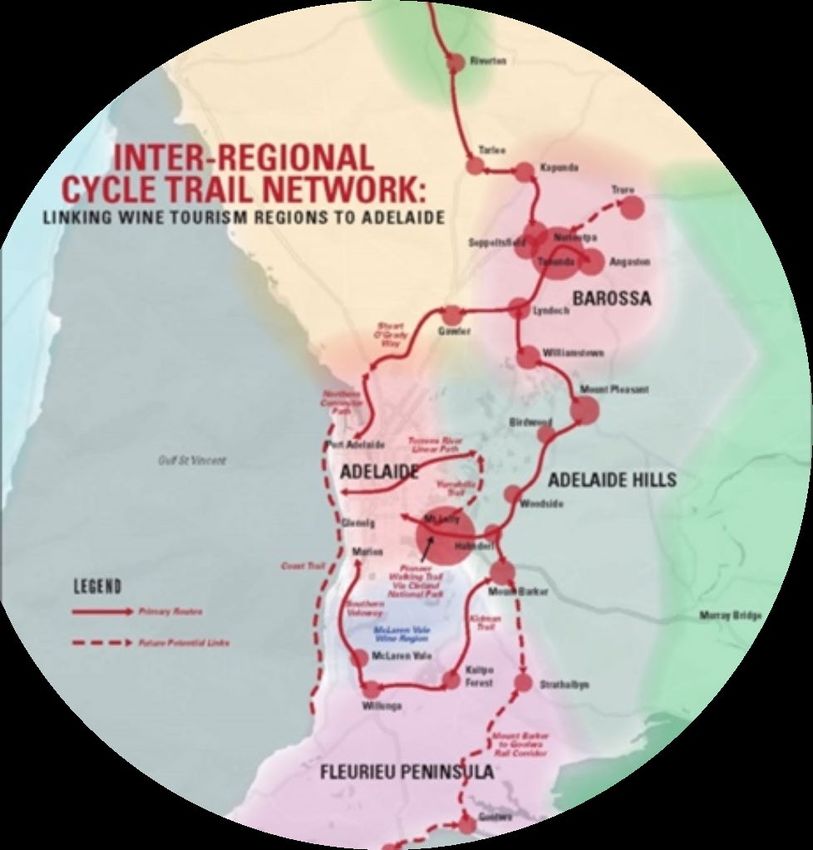
Figure 18 - Adelaide Wine Capitals Cycle Trail Network Map ..................................................... 71
SOB – Stuart O’Grady Bikeway
Index of Tables SATC – South Australian Tourism
Commission
TA – Tourism Australia
Table 1 - Digital Visitor Sentiment for Key Tourism Experiences in TOG ..................................... 20
TBC – The Barossa Council
Table 2 - Experience Theme Strength Summary ......................................................................... 53 TBI – Tourism Barossa Incorporated
Table 3 - Experience Themes + Product Alignment..................................................................... 54 TiCSA – Tourism Industry Councils SAC
Table 4 - Accommodation Product in Town of Gawler ............................................................... 56 TOG – Town of Gawler
Table 5 - Sport + Community Event Venues ................................................................................ 58 TOG VIC – Town of Gawler Visitor
Information Centre
Table 6 - Visitor Economy Opportunities for TOG ....................................................................... 90
TDU – Tour Down Under
TRA – Tourism Research Australia
VFR – Visiting Friends and Relatives
VIC – Visitor Information Centre
(Accredited)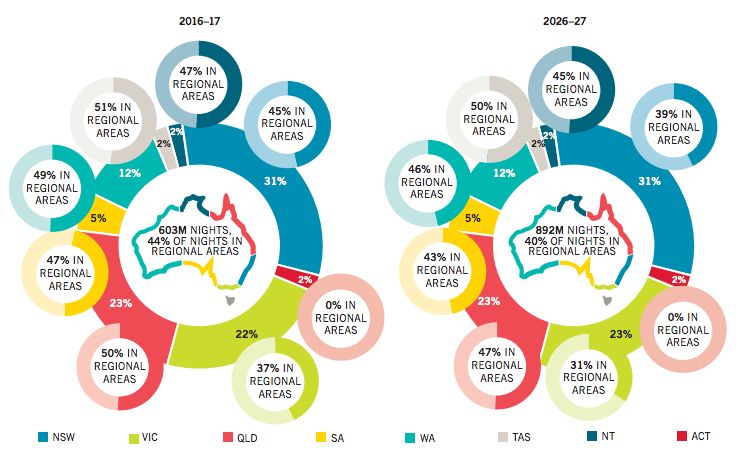
About this Document
Town of Gawler (TOG) has a Tourism vision:

To be recognised as South Australia’s oldest and most significant country town that offers rich and engaging heritage,
cultural and active experiences through its people, places, landscapes and events.

To achieve this Tourism vision, the TOG uncovered the town’s potential for the visitor economy through a thorough
consultation with all industry stakeholders to develop a comprehensive Tourism Situation Analysis, July 2019. From
this Analysis, a Tourism Plan 2019-2024 has been developed which outlines the actions council will implement to
achieve the vision.

Where to start…
Tourism Situation Analysis, July 2019 – YOU ARE HERE!
This document offers an in-depth analysis of the Visitor Economy for the TOG as at July 2019. This is a must-read for
those who are interested in gaining a deep understanding of the state of play for the tourism sector for the Town.

Tourism Plan 2019-2024
This document sets the priorities to boost the visitor economy in TOG over the next 5 years. It includes the Actions to
be implemented and KPIs to be measured to achieve the opportunities that were identified in the Tourism Situation
Analysis, July 2019.

Tourism Plan Snapshot 2019-2024
This document offers a bird’s eye view of the Tourism Plan 2019-2024

     Tourism Situation                           Tourism Plan                    Tourism Plan Snapshot
     Analysis, July 2019                          2019-2024                            2019-2024

TOWN OF GAWLER    |   TOURISM SITUATION ANALYSIS, JULY 2019                                                         PAGE 1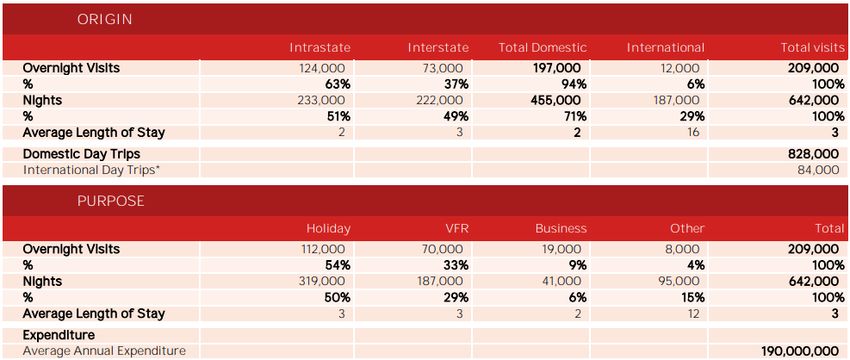
Executive Summary
Town of Gawler (TOG, the Town) recognise the increased importance of the visitor economy within their planning
frameworks, and as such contracted Tourism eSchool, a tourism consultancy based in South Australia, to develop a
Tourism Plan for the Town with the aim of articulating a vision for the growth of the visitor economy.

TOG already play a significant and diverse role in developing its visitor economy. In addition to owning and managing
the Accredited Visitor Information Centre (TOG VIC) in the main street of Gawler, they have recently invested
significantly in the restoration and reinvigoration of the Gawler Civic Centre, which has been earmarked as a cultural
hub for locals and visitors alike.

The Town also has a number of significant and unique drawcards, particularly Heritage, History, Arts and Culture
experiences, which highlight the historical significance of the Town and South Australia. This is complemented by some
key Outdoor and Adventure experiences, whereby TOG also already invests in critical cycle tourism infrastructure,
including a number of national standard shared paths, river and reserve trails, and a well-positioned and managed bike
hub. TOG also manage important community infrastructure and core amenities that are enjoyed in the town by visitors,
whether it is through placemaking assets, accessibility, natural and cultural environment, or the provision of visitor
services.

Currently there is no single data source which captures a complete picture of the true visitation to the Town, which is a
challenge when it comes to measuring the return on investment in the sector. However, micro-metrics are available
through the TOG VIC and some digital marketing platforms to gauge visitor engagement of the Town as a tourism
destination. Wider metrics for the Barossa tourism region are also available, and are helpful in providing insights as it
relates to visitor data and behaviour.

Whilst the original scope of this project was to develop a Cycle Tourism Strategy, it was identified throughout the
consultation process that in order to grow the ‘Cycle Tourism’ niche, the Town needed to focus on growing the whole
visitor economy, of which cycle tourism would then be able to be successfully activated.

The first step was to develop this Tourism Situation Analysis, which involved consultation with all levels of industry, to
ensure all available information was considered to draw realistic conclusions for TOG. Consultation included one on one
meetings with various stakeholders (all levels of industry and government), community workshop, and an online survey
which targeted the community and industry (see Section 13 Acknowledgements).

Through this consultation, Tourism eSchool identified all the key internal and external stakeholders’ roles and
responsibilities, analysed the current visitor data insights, tourism market segments, product, access, infrastructure,
marketing, branding, resourcing and visitor servicing within the Town, and from this, have formulated the Town’s
strengths, weaknesses, threats as it relates to growing the visitor economy.

From this analysis, major opportunities have been identified for effective and sustainable visitor economy growth which
were considered in the development of the Tourism Plan 2019-2024 (separate document).

TOWN OF GAWLER    |   TOURISM SITUATION ANALYSIS, JULY 2019                                                           PAGE 2

1. SETTING THE SCENE

1.1 The Visitor Economy

The concept of the visitor economy is increasingly being adopted by the global tourism industry. The visitor economy is
broader than the traditional view of the ‘tourism sector’, which focuses on the leisure market of visitors that travel for a
variety of reasons. The visitor economy includes all visitors that travel outside their usual home to take part in activities
including leisure, business, events, employment, education or to visit friends and relatives.

These visitors, which include international, interstate, intrastate and day trip visitors, provide benefits to the economy
through the direct contributions of their tourism activities, as well as the indirect contributions via the value chain, such
as the impacts of capital investment and Government expenditure. The visitor economy encompasses the contribution
tourism makes to employment, investment, infrastructure development, exports, provision of temporary labour and
social vibrancy.

When it comes to calculating the return on marketing investment of investment in the Visitor Economy, it can be
challenging to calculate a direct return on investment as there are often multiple stakeholders investing in a project and
often results that are difficult to quantify. However, as a guide for organisations investing in a Visitor Economy, the
2015 Productivity Commission Report 1 found that for every $1 invested in a Visitor Economy, the return on investment
was $15, while Tourism Accommodation Australia 2 found the return as high as $22 for every $1 invested.

Results from the Australian Regional Tourism Network (ARTN) Local Government spend on Tourism Report 2017 3,
noted that South Australian Councils, on average, spent $17 on visitor economy related investment per resident. The
report also highlighted the following sentiment from respondents:

      •     90% respondents agreed that tourism offers economic development opportunities;
      •     78% respondents agreed that tourism is one of the most important local industries;
      •     72% respondents agreed that economic benefits far outweigh the costs of council investments in tourism; and
      •     52% respondents agreed that tourism should be a higher priority in council.

1
 https://www.pc.gov.au/research/completed/international-tourism
2
 https://www.tourismaccommodation.com.au/wp-content/uploads/2012/08/RETURN-ON-MARKETING-INVESTMENT-FOR-AUSTRALIAN-TOURISM-vrp2-16_7_14.pdf
3
 ARTN Local Government Spend on Tourism report January 2017 (https://regionaltourism.com.au/tecset/wp-content/uploads/2018/07/ARTN-Local-Government-Spend-on-Tourism-
Report.pdf)

TOWN OF GAWLER           |    TOURISM SITUATION ANALYSIS, JULY 2019                                                                                             PAGE 3
1.2 Global Tourism Trends

There are several key global tourism trends that destinations need to address to grow a sustainable visitor economy.
These trends should be used as a lens to help prioritise resourcing of investment in Tourism.

The following trends are covered in detail in Trekk Soft’s “Travel Trends Report 2019” 4, Trekk Soft’s “9 Travel Trends to
Drive Tourism in 2018” 5 and the World Travel and Tourism Council’s “Travel and Tourism: Global Economic Impact and
Issues 2017” 6.

Experiences are at the heart of why people travel

Visitor travel for authentic experiences and when they have a positive experience, there is a high chance they will
spread the word and advocate for a tourism product or region who delivers on their promise both on and offline.
Therefore, maintaining a high level of visitor experience in a destination (across both local government and private
tourism experiences) is a key consideration when looking to grow their visitor economy.

Some of the top experiences for 2019 will be:

      •     A request for unique experiences - Tour operators are now receiving requests for unique experiences from
            travellers who want to do something that is a once-in-a-lifetime. This is becoming more common amongst
            Millennials who want to explore the world and share their stories with others.
      •     Ecological tours are in demand - Ecological tours are the most popular tours offered by many tour & activity
            operators who responded to 2018 TrekkSoft Tourism Survey. These are usually rare experiences that educate
            and share inside information on the area, and how to protect it for the future. Tours that use proceeds to fund
            ecological projects such as forest or animal habitat restoration are chosen above alternatives without a cause.
      •     More Adventure - Adrenaline pumping activities continue to grow with two new generations who are keen to
            push their limits. Adventure destinations such as Area 47 in Austria, Queenstown New Zealand, and Interlaken
            Switzerland are booked for the variety of action-packed activities on offer.
      •     Multi-day Tours and Activities - There is a shift with multi-day tours and activities being booked further in
            advance and being a preferred option for travellers. Convenience is a key selling point as travellers no longer
            need to spend time planning various activities.
      •     Local Experiences - Travellers are choosing to become more immersed in the local culture when visiting a
            destination. They want to do what the locals do and eat where locals eat. Airbnb Experiences are offering a
            solution where travellers can book a local experience with destination natives.
      •     History + Culture - Walking tours are still one of the leading experiences for anyone visiting a new location.
            They are a great opportunity to find your bearing, meet other travellers and have all their questions answered
            by a destination expert.

4
  Travel Trends Report 2019 > https://www.trekksoft.com/en/academy/ebooks/travel-trends-report-2019
5
  9 Travel Trends to Drive Tourism in 2018 > https://www.trekksoft.com/en/blog/9-travel-trends-that-will-drive-the-tourism-industry-in-2018
6
  Travel + Tourism: Global Economic Impact + Issues 2017 > https://www.wttc.org/-/media/files/reports/economic-impact-research/2017-documents/global-economic-impact-and-
issues-2017.pdf

TOWN OF GAWLER            |    TOURISM SITUATION ANALYSIS, JULY 2019                                                                                                  PAGE 4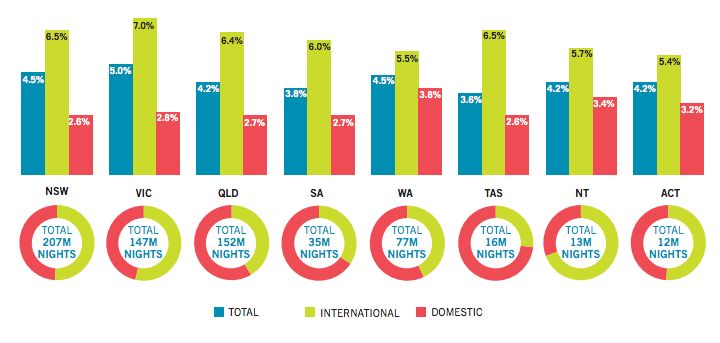
Mobile bookings will be the new default

The majority of travellers have smartphones (there is a 102% mobile penetration rate in the Asia Pacific Region 7), and
consumers are increasingly comfortable planning and booking experiences via their mobile devices. Therefore, any
marketing and visitor servicing undertake by destinations must have a strong focus on mobile.

Invest in new Technologies with care

While new technologies, such as augmented and virtual reality, connected digital devices and apps, become
mainstream, and can offer exciting new ways to engage visitors, tourism brands need to ensure they invest in them
with care. They first need to be clear on the type of visitor experience they want to deliver, before then exploring the
best type of technology to support that experience. They should not just invest in the technology because is cool and
new.

Online reviews are the most trusted form of advertising for a destination

What visitors say about a tourism experience to their family and friends via online reviews or via word of mouth are the
#1 and #2 most trusted forms of advertising 8. Therefore, any destination marketing needs to focus on ensuring their
region’s visitor experience is high, which will then encourage positive advocacy of their destination by visitors and
locals.

All other investments in marketing should also be considered in this context, with a reduction in investment in less
trusted advertising, and increase in investment in experience development and capacity building with individuals to
deliver the on-ground visitor experience in a region.

Generational differences are blurring

Baby boomers are looking for more adventure, Gen X’s and Millennial are highly travelled (as are their kids) while 30 –
50 year olds are looking for relaxation. People travel for different aspirations and interests, regardless of their age and
gender. Therefore, tourism brands must focus on attracting customers with similar aspiration and interests, and not just
define customers by where they live or their ages. They can also focus on relevant experience development and
marketing messages that appeal to the different lifestyle and interests of travellers.

Chinese travellers mature

As Chinese outbound visitors continue to grow globally, destinations will see more repeat visitors and growth in
independent travellers who explore a country more widely from the traditional gateway destinations in their countries.
Tourism brands who want to grow their Chinese visitor numbers need to ensure they are delivery unique and authentic
experiences, that provide these visitors with a unique story to tell about their travels and meet specific cultural needs of
these travellers. Work also needs to be done to ensure businesses in regions understand and leverage the mobile
payment options preferred by Chinese guests to better capture their expenditure during their visits.

7
    Hootsuite Digital in 2018, Essential Insights into Internet, Social Media, Mobile and eCommerce use around the world. > https://hootsuite.com/pages/digital-in-2018
8
    2015 Nielsons Trust in Advertising Report – Australia > http://www.nielsen.com/au/en/insights/news/2015/its-a-trust-thing.html

TOWN OF GAWLER                |    TOURISM SITUATION ANALYSIS, JULY 2019                                                                                                  PAGE 5
Sustainability is about more than protecting the environment; it's about the local communities. As people become more aware of issues of over-tourism in locations around the world (such as New Zealand, Venice, Iceland and Barcelona), they will look to travel to more out of the way tourism destinations that satisfy their travel aspirations. Tourism destinations need to ensure they focus on ensuring the sustainability of their local communities and landscapes (which is the reason people travel in the first place), and focus attracting more of the right visitors. Not profitless volume visitors, but those who stay the longest, spend the most and advocate for what the region offers. 1.3 National Tourism Priorities The visitor economy is now recognised at all levels of government in Australia as an intrinsic, sustainable and driving part of economic development. It creates long term improvements in the liveability of cities, towns and rural life and significantly improves the prosperity of Australian communities. Tourism has been identified in Australia’s ‘next wave of prosperity’ as one of the top five sectors of economic growth and has the potential to become Australia’s fastest growing industry. 9 Tourism Australia (TA) is committed to an ambitious 2020 target of increasing the value of the visitor economy to the nation from $70billion to $115-140billion, driven by growth in inbound travel (particularly from Asia) and supported by continued growth in the domestic market. 10 TA are on track to achieve their goal of more than A$115 billion in overnight spend by 2020. At 30 March 2018, overnight visitor expenditure reached $107.4 billion, up 6 per cent on the previous year. Recent forecasts indicate that overnight visitor spend will reach $131 billion by 2020. 11 According to Tourism Research Australia, the Australian tourism industry is forecast to grow to $151 billion in overnight spend and 15 million international visitors by 2026-27. 12 9 Deloittes, Positioning for Prosperity? Catching the next wave. Building the Lucky Country #3, 2014, p3 10 Tourism 2020 Overview > http://www.tourism.australia.com/documents/Tourism_2020_overview.pdf 11 Tourism Australia – 2020 Performance Update > http://www.tourism.australia.com/en/about/our-organisation/our-performance-and-reporting/tourism-2020.html 12 Tourism Research Australia, Tourism Forecasts 2017, p1 TOWN OF GAWLER | TOURISM SITUATION ANALYSIS, JULY 2019 PAGE 6
1.4 State Tourism Priorities
In South Australia, tourism continues as a key driver of the state’s economy. The South Australian Tourism Commission
(SATC) is currently working toward their 2020 strategy, which is focussed on achieving the South Australian tourism
industry’s full potential of $8.0b of visitor expenditure and an additional 10,000 jobs by 2020 13.

As at the year ending December 2018 14 the state has seen a rise in expenditure of 3% to a record $6.8 billion. In
2016/2017, the Tourism industry has supported 36,000 jobs directly, which has increased by 15% since the targets were
set in 2012/13, and continues toward the progress of the goal towards an additional 10,000 jobs by 2020 15

With regard to visitation, the state has experienced the following growth (December 2018 quarter) 16:

      •     Visits to South Australia grew 4% to a record high $7.1million
      •     Nights in South Australia reached 34 million, flat for the year
      •     International expenditure has risen 4% to $1.15billion
      •     Interstate expenditure rose 12% to a record high $2.2billion
      •     Intrastate expenditure in South Australia also rose, up 2% to a record high $1.9billion
      •     Interstate visitation grew strongly, up 11% reaching a record high of 2.6 million; and
      •     Domestic expenditure growth of 4% was driven by expenditure in regional South Australia, up 6% to 2.7billion.

Regional tourism plays a key role in the South Australian visitor economy, with 40% of the State’s total visitor
expenditure being spent in the 11 tourism regions. In May 2018, the South Australian Regional Visitor Strategy was
launched highlighting key strengths, future potential priority areas for each of the regions, which are all focused on
achieving the state’s 2020 target. 17 The implementation will be led by the Regional Visitor Strategy Steering Committee
and has the potential to grow the regional visitor expenditure from $2.6 billion to $3.55 billion by 2020.

In early 2019, the SATC developed a new draft South Australian Tourism Plan 2030 in consultation with industry, which
outlines an ambitious target of $12.8b and 16,000 jobs by 2030. 18

The Draft Plan 2030 suggests that while the Visitor Economy for South Australia in 2030 may look vastly different to
today, much of the core proposition for travel will likely remain the same. Travellers will still be seeking out high quality
immersive or relaxing experiences with friendly customer service that represents good value for their tourism dollar.
Core draw-cards for South Australia are likely to remain the state’s established strengths across key areas such as food
and wine, nature-based tourism and cultural experiences.

13
   South Australian Tourism Commission 2020 Strategy >https://tourism.sa.gov.au/documents/CORP/documentMedia.ashx?A={F839DCB0-ACEC-43D6-A16F-E0A0EA409A08}&B=False
14
   SATC 2020 Progress Report > https://tourism.sa.gov.au/documents/CORP/documentMedia.ashx?A={50E81AE7-F9B1-4C26-AC29-64799BCB6F06}&B=False
15
   State Tourism Satellite Account 2016-2017 > https://tourism.sa.gov.au/documents/CORP/documentMedia.ashx?A={BEAF1F20-C78C-4262-9D1C-438A084656AF}&B=False
16
   SATC 2020 Progress Report - https://tourism.sa.gov.au/documents/CORP/documentMedia.ashx?A={50E81AE7-F9B1-4C26-AC29-64799BCB6F06}&B=False
17
   SA Regional Visitor Strategy - http://tourism.sa.gov.au/research-and-statistics/strategies/south-australian-regional-visitor-strategy
18
   SATC Draft Tourism Plan 2030 > https://tourism.sa.gov.au/research-and-statistics/strategies/tourism-plan-2030)

TOWN OF GAWLER           |   TOURISM SITUATION ANALYSIS, JULY 2019                                                                                           PAGE 7
1.5 Barossa Tourism Region
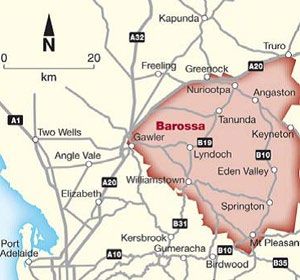
Town of Gawler (TOG) is one of three councils (along with the Barossa Council and Light Regional Council) falling into
the designated Barossa tourism boundaries as dictated by the SATC (Figure 2).
As noted above, South Australia is targeting the stretch goal of $8.0b total expenditure by December 2020, and of that
total, $273million has been earmarked for the Barossa region. 19 The Barossa region has achieved 70% of its 2020 target
reaching $190million at December 2017 20.
An annual average for the region between 2015-2017 from the SATC Barossa Regional Profile 21 highlighted the
following visitor statistics for the region:
● 209,000 visitors who spend 3 nights per trip (642,000 nights)
● Majority of visitors to the region are from Australia (94%) with a small portion from international markets (6%).
● 63% of domestic visitors are from South Australia, with 37% from Interstate.
● The majority of visitors (87%) of visitors Leisure visitors (Holiday + VFR).
● On average 828,000 day trips are taken to the Barossa each year, with an extra 84,000 international day trips.
In 2016-17, the tourism industry directly employed approximately 900 people 22.
Figure 1 - Barossa Tourism Region Map (SATC)
19
Barossa Regional Profile December 2014-2016 > http://tourism.sa.gov.au/documents/CORP/documentMedia.ashx?A={6C5174B0-DB1F-4A05-AF21-A951A4EF84B2}&B=False
20
Barossa Regional Profile December 2014-2016 > http://tourism.sa.gov.au/documents/CORP/documentMedia.ashx?A={6C5174B0-DB1F-4A05-AF21-A951A4EF84B2}&B=False
21
Barossa Regional Profile 2015-2017> https://tourism.sa.gov.au/documents/CORP/documentMedia.ashx?A={6C5174B0-DB1F-4A05-AF21-A951A4EF84B2}&B=False
22
Barossa Regional Profile 2015-2017> https://tourism.sa.gov.au/documents/CORP/documentMedia.ashx?A={6C5174B0-DB1F-4A05-AF21-A951A4EF84B2}&B=False
TOWN OF GAWLER | TOURISM SITUATION ANALYSIS, JULY 2019 PAGE 81.6 Town of Gawler 1.6.1 Project Background Town of Gawler recognise the increased importance of the visitor economy within their planning frameworks, and as such initially contracted Tourism eSchool, a tourism consultancy based in South Australia, to develop a Cycle Tourism strategy for the Town with the aim of articulating a vision for the growth of the cycle tourism in Gawler. The development of this Tourism Situation Analysis included a thorough consultative process (see Acknowledgements) with community, industry stakeholders, TOG staff, and state government stakeholders. This document also references relevant national, state, regional and local plans strategies, making it a robust, evidence-based analysis, which offers a clear direction to enhance the visitor economy. Whilst the original scope of this project was to develop a Cycle Tourism Strategy for the Town, it was identified throughout the consultation process that in order to grow the ‘Cycle Tourism’ niche, the Town needed to focus on growing the whole visitor economy, of which cycle tourism would then be able to be successfully activated. 1.6.2 Town of Gawler’s Priorities Councils support their communities in a variety of ways and now make a significant contribution to the economic and social well-being of residents. The days of ‘Roads, Rates and Rubbish’ are well and truly in the past. South Australia is currently facing economic challenges and many regions are competing for residents, business and visitors to maintain viable, healthy communities. With the transition to a serviced-based economy, tourism and events will play a greater role in regional development by attracting new money, supporting jobs and by contributing to the attractiveness of Councils as places to ‘live, work and play’. TOG is the northernmost Local Government Area of Metropolitan Adelaide and has a population of approximately 23,034 (2016 census). The Council area shares boundaries with the City of Playford to the South and the Light and Barossa regional Councils to the North. The peri-urban landscape of the township acts as an interface between metropolitan and regional Adelaide. Covering over 41km2, there are a number of differing urban forms and land use characteristics within the Council Area. The South-Western precinct is predominantly rural with large blocks of land for ‘rural living’ and agricultural purposes. The Northern component of the Council Area is largely residential and is concentrated around the Town Centre. Residential precincts directly surrounding the Town Centre are well established and feature a number of state and local heritage items. TOWN OF GAWLER | TOURISM SITUATION ANALYSIS, JULY 2019 PAGE 9
Figure 2 - Town of Gawler Municipality Map

TOG plays a significant and diverse role in developing its visitor economy. The base infrastructure and core amenities
that are enjoyed in the Town by visitors are largely the product of the work of TOG, whether it is through placemaking
assets, accessibility, natural and cultural environment, or the provision of visitor services.

A vibrant visitor economy also unlocks the opportunity for population growth, as there are also strong overlaps
between a place being highly liveable and great to visit. So, when visitors enjoy and fall in love with a location, they
could decide to move and live locally, which can be a sustainable way to increase the capacity of the Council to deliver
on community desires and expectations.

The 2017-2027 Gawler Community Plan highlights numerous objectives that will support the development of the visitor
economy. Specific mention of the visitor economy was highlighted under “GOAL 2: Managed and Sustainable Growth”
with the following supporting objectives:

          2.5 Local economic activity to create local job opportunities and generate increased local wealth

          2.5.3 Investigate opportunities for tourism and continue to support investment in tourist accommodation.

It’s clear from the Community Plan’s objectives that TOG is committed to creating a Town that is conducive to
supporting the visitor economy, as well as meeting the needs of residents. Tourism is a burgeoning economic driver for
the Town, offering a great deal of potential as a destination in itself, and as a base for those wanting to explore the
Clare Valley and Barossa Tourism regions.

TOWN OF GAWLER       |   TOURISM SITUATION ANALYSIS, JULY 2019                                                       PAGE 10
Whilst there is no specific visitation data for TOG, during 2017/18 the TOG Visitor Centre (TOG VIC) serviced 17,306 visitors to the Town, mainly from Interstate (Victoria, New South Wales and Canberra) with a very small proportion from International markets. TOG is one of four local government municipalities that fall under the Regional Development Australia Barossa, Gawler, Light + Adelaide Plains (RDA BGLAP) boundaries. RDA BGLAP highlights the visitor economy as a growth industry, and supports the sector through various projects, such as cycle tourism strategy development and capacity building, of which will support TOG in growing their visitor economy. TOWN OF GAWLER | TOURISM SITUATION ANALYSIS, JULY 2019 PAGE 11
2. VISITOR ECONOMY INSIGHTS

2.1 Data Sources
In obtaining relevant insights to inform the state of play for the TOG visitor economy, the various data sources and key
metrics have been analysed.

The following data sources have been analysed:

South Australian Tourism Commission (SATC) Barossa Regional Profile, Year Ending December
2017

The SATC develop regional profiles for all regions across South Australia to offer the most accurate information as it
relates to expenditure, number of tourism businesses, international and domestic overnight visitation, and day trip
visitation. This data comes direct from the National Visitor Survey (NVS) and the International Visitor Survey (IVS).
Data source available online > https://tourism.sa.gov.au/research-and-statistics/regions/regional-tourism-profiles

TOG Visitor Information Centre Visitor Statistics

Staff at TOG VIC enter statistics electronically through the till (which they culminate into month and year databases),
detailing all visitors through the door, including their place of origin and length of stay. Raw data is available upon
request.

Visitor Sentiment

Desktop research has been undertaken for key tourism experiences within the TOG to gain insight and gauge visitor
perception of the destination.

TOWN OF GAWLER    |   TOURISM SITUATION ANALYSIS, JULY 2019                                                          PAGE 12
2.2 SATC Barossa Regional Profile

2.2.1 Tourism Expenditure
The SATC have reported that the Barossa Tourism Region achieved 70% of its 2020 target ($273million) reaching
$190million at December 2017 23.

Leading up to the December 2017 result, expenditure for the Barossa tourism region has seen steady growth, with a
peak in last year in the timeseries, which aligns with increased marketing investment from SATC for the ‘Barossa - Be
Consumed’ campaign over that period.

Figure 3 - Barossa Region Tourism Expenditure 2010-2015 24

                                                       BAROSA TOURISM REGION
                                                            EXPENDITURE
                  200                                                                                                                           187

                  180        166                                                                                         169
                                                    163
                  160                                                                             148
                                                                           141
                  140

                  120
       $MILLION

                  100

                  80

                  60

                  40

                  20

                   0
                           YE'10                  YE'11                  YE'12                  YE'13                  YE'14                  YE'15

The ‘Economic Profile of the Barossa Regional Development Australia Region 2016’ Report, also highlights that
expenditure by tourists ($51m) contributed approximately 15 per cent of the total value of exports from the RDA BGLAP
region in 2014/15, which also comprised about 1 per cent of the SA total expenditure by tourists in 2014/15 ($5.3b). 25

23
     Barossa Regional Profile December 2017> https://tourism.sa.gov.au/research-and-statistics/regions/regional-tourism-profiles
24
     Tourism Research Australia Barossa Regional Profile, 2013-2014 Tourism Supply Raw Data > https://www.tra.gov.au/tra/2016/Tourism_Region_Profiles/Region_profiles/index.html#
25
     Economic Profile of the Barossa Regional Development Australia Region 2016 (available from RDA Barossa)

TOWN OF GAWLER               |     TOURISM SITUATION ANALYSIS, JULY 2019                                                                                                   PAGE 13
2.2.2 Tourism Jobs + Businesses
In 2016-17, the tourism industry directly employed approximately 900 people, with 500 indirect jobs and a total
employment impact of 1,300 people. 26
In 2013/2014, the Tourism Industry in the Barossa Region supported 363 businesses. 27
Figure 4 - Tourism Businesses in the Barossa Tourism Region, FY2010-FY2015
BAROSSA TOURISM REGION
TOURISM BUSINESSES
395 392 392
390
385
380
375
375
# BUSINESSES
370
365 362 363
360
355
350
345
YE'10 YE'11 YE'12 YE'13 YE'14
26
SATC Barossa Regional Profile December 2017
27
Tourism Research Australia Barossa Regional Profile, 2013-2014 Tourism Supply Raw Data
TOWN OF GAWLER | TOURISM SITUATION ANALYSIS, JULY 2019 PAGE 142.2.3 Visitor Statistics
Annual Average Visitor Summary December 2015 - December 2017
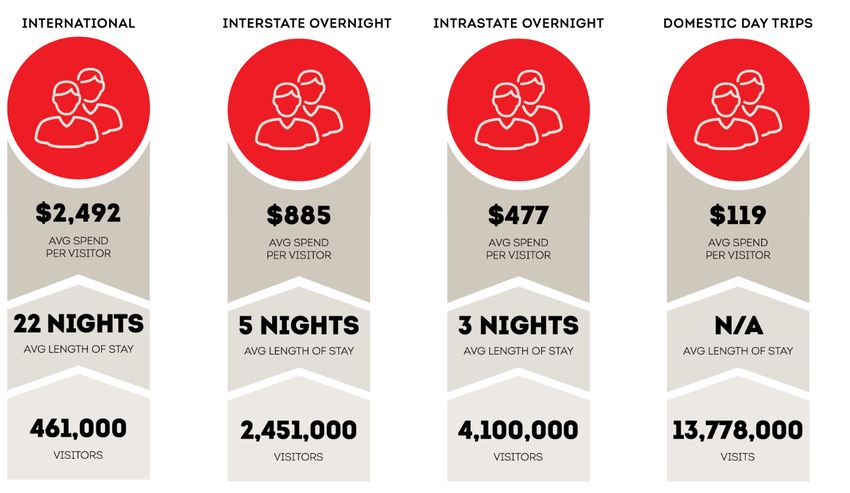
Data highlights:
• 94% of the Barossa visitors are Domestic visitors and 6% are International visitors.
• Domestically, 63% are from within the state compared to 37% from Interstate.
• 87% of visitors to the Barossa are Leisure visitors (Holiday + VFR).
• On average 828,000 day trips are taken to the Barossa each year, with an extra 84,000 international day trips.
Figure 5 - Barossa Tourism Region Visitation Data Dec 2015 - Dec 2017
Sources. Unless otherwise stated, all data in this report is from the International Visitor and National Visitor Surveys (IVS and NVS) Conducted by
Tourism Research Australia. These Sources are based on sample surveys and as with all sample surveys, are subject to sampling errors. Caution is
required in interpreting some estimates, in particular, regional estimates can be affected by small sample sizes and can be subject to a high level of
sampling error. Regional data should accordingly be used with a high level of caution and treated as being for indicative purposes only. Data refers to
visitors 15 years and over. Unless otherwise stated, all data refers to the Annual Average results for the 3 years from December 2015 to December
2017.
Notes and Abbreviations. Totals may not add to 100% due to rounding. VFR: Visiting Friends and Relatives. np: Not Published due to small sample
size. ALOS: Average Length of Stay ABS: Survey of Tourism Accommodation. Hotels, Motels, Guest houses and Serviced Apartments with 15 or more
rooms.
TOWN OF GAWLER | TOURISM SITUATION ANALYSIS, JULY 2019 PAGE 152.2.4 Barossa Region Tourism ‘Appeal’ Insights
Below are the results from Consumer Surveys conducted by SATC and Tourism Australia 28 and is available in the Barossa
Regional Profile
Interstate
• Wine resonates with interstate visitors.
• Activities found attractive, e.g. festival / bike ride / hot air balloon.
• Perception of the destination as 'high end' for some.
Intrastate
• A well-known destination and lots more hidden secrets among those who know e.g. farmers markets, rose
garden, Angaston.
• Activities such as hot air balloon also appeal and have the potential to trigger a visit. International • Highly
appealing winery region.
• Visiting Jacobs Creek is the top experience.
• Vintage festival and Whispering Wall also very popular.
Regional Visitor Strategy Priorities
• The main priority for driving future growth to the Barossa is to increase overnight visitation from interstate and
overseas markets. While the region receives four day-trip visitors for every overnight visitor, overnight visitors
deliver over two thirds of total spend.
• Accommodation improvements and developments will be crucial to the region.
• The Barossa needs to leverage established global marketing platforms such as Ultimate Winery Experiences
and Great Wine Capitals of the World for promoting the region.
NOTE. Appeal data is from the consumer surveying conducted for the SATC by BDA Marketing Planning. Sample of 800 interstate travellers and 400
interstate travellers, followed by eight focus groups in Adelaide, Sydney and Melbourne. Comments relating to International appeal are sourced from
the Consumer Demand Project run by Tourism Australia in 11 priority markets, with a sample of 1,600 per market.
28
SATC Barossa Regional Profile 2016-2018
TOWN OF GAWLER | TOURISM SITUATION ANALYSIS, JULY 2019 PAGE 162.3 TOG VIC Visitor Statistics
Staff at TOG VIC record electronically through the till visitation statistics (which they culminate into month and year
databases), detailing all visitors through the door, including their place of origin and length of stay.
Important Note. This data is not reflective of all visitors to the Town, just those who enter the VIC or who
are serviced on the phone. Therefore, data should be used as an indicator of tourism visitation only.
2.3.1 Visitor Data Highlights 29
• Total number of visitors serviced (in person and on phone) has declined from YE’15- YE’18, with the biggest
change between YE’16 and YE’17
• Majority of visitation is from the domestic market, in particular the Interstate Market
• Over the timeseries, the majority of interstate visitors are from VIC (31.3%) and NSW/ACT (27.2%)
• Over the timeseries, the majority of International visitors are from Europe (31.6%) and Other Asia (23.3%)
Figure 6 - TOG VIC, Total Visitors Serviced (in person + phone)
GAWLER VISITOR CENTRE
TOTAL VISITORS SERVICED (IN PERSON + PHONE)
20000
19447 19371
19500
19000
# VISITORS SERVICED
18500
18000
17306
17500
16925
17000
16500
16000
15500
YE'15 YE'16 YE'17 YE'18
29
Visitor Data received from TOG VIC Senior Coordinator, March 2019
TOWN OF GAWLER | TOURISM SITUATION ANALYSIS, JULY 2019 PAGE 17Figure 7 - TOG VIC, Total Domestic Visitors vs Total International YE2015-YE2018
TOTAL DOMESTIC VS TOTAL INTERNATIONAL
Domestic International
16000 14790
13284 13607
14000 12730
# TOTAL NUMBER OF VISITORS
12000
10000
8000
6000
3363
4000
2606 2269
2215
2000
0
YE'15 YE'16 YE'17 YE'18
Figure 8 - TOG VIC, All Market Comparison, YE2015-YE2018
ALL MARKET COMPARISON
Gawler Intrastate (excl. Gawler) Interstate International
6000
5409
5229
5000
4492
# TOTAL NUMBER OF VISITORS
4456
4000
3699 3771
3363 3233 3244 3359
3000 3106 3126
2720 2606
2215 2269
2000
1000
0
YE'15 YE'16 YE'17 YE'18
TOWN OF GAWLER | TOURISM SITUATION ANALYSIS, JULY 2019 PAGE 18Figure 9 - TOG VIC, Interstate Visitor Profile YE2015-YE2018
INTERSTATE VISITOR PROFILE
TOTAL VISITORS YE/15 - YE'18
31.3
27.2
% TOTAL INTERSTATE VISITORS
21.6
13.6
4.6
1.8
VIC NSW/ACT QLD WA TAS NT
Figure 10 - TOG VIC, International Visitor Profile YE2015-YE2018
INTERNATIONAL VISITOR PROFILE
TOTAL VISITORS YE'15 - YE'18
31.6
% TOTAL INTERNATIONAL VISITORS
23.3
14.7
12.2
10.3
5.7
2.3
UK EUROPE USA/CANADA NZ JAPAN OTHER ASIA OTHER
COUNTRIES
TOWN OF GAWLER | TOURISM SITUATION ANALYSIS, JULY 2019 PAGE 192.4 Visitor Sentiment
Desktop research on TripAdvisor, Google and Instagram can provide insights into visitor sentiment. The insights below
are purely qualitative, and they lack quantitative measurement of Sentiment and likelihood of future advocacy.
Overall, sentiment for the Council owned assets are very high (mostly 4 star), and comments regarding the assets are
very positive, with only a few negative comments. However, there is great opportunity to increase online reviews and
advocacy for the Towns Council owned, Community and Private Tourism Experiences.
Table 1 - Digital Visitor Sentiment for Key Tourism Experiences in TOG
TripAdvisor Google Instagram
Product Category
Star Star # Hashtag
Product / Experience (Activity / # Reviews # Reviews #Hashtag
Rating Rating Uses
Attraction)
Gawler Visitor
Attraction 27 4.5 44 4.5 #gawlervisitorinformationcentre 2
Information Centre
The Civic Centre (note -
no online listings for the
Attraction 8 4
Heritage Collection or the
Heritage Gallery)
Niina Marni Cafe Restaurant 1 4 1 4
Pioneer Park Park / Attraction 10 4.5 51 3.9 #pioneerparkgawler 1
Barossa Trail (formerly #jackbobridgetrail #jackbobridgetrack
Activity 5 2 70
Jack Bobridge Track #jackbobridgebikepath
#stuarTOGradybiketrack
Stuart O'Grady bikeway Activity 3 4.5 4.4 22 34
#stuarTOGradybikeway
Gawler Main Street
Activity 1 5
Walking Tour
Gawler Train Station Attraction 2 4 20 4.2
TOWN OF GAWLER | TOURISM SITUATION ANALYSIS, JULY 2019 PAGE 20St George's Anglican
Attraction 3 4.5 3 3.7
Church
Gawler Lions Station #gawlerfarmersmarket #gawlermarkets
Event 2 3.5 35 4 223
Market #gawlermarket
Deadman's Pass Reserve Attraction 136 4.4 #deadmanspassgawler 16
Gawler Self-Drive Tour Activity 2 4.5
Apex Park Attraction 101 4.4 #apexparkgawler 1
Light Square Park 1 3
Clonlea Park Park 132 4.5 #clonleapark 154
Gawler Caravan Park Accommodation 37 4.5 105 4.1 #gawlercaravanpark 3
Paridla Taikondi Park Park 16 4.5
Clonlea Reserve Dog Park Park 18 4.8
Gawler Skate Park Park 16 4.2
Gawler National Trust
Attraction 2 2.5
Museum
Gawler Community
Attraction 2 4.5 #gawlercommunitygallery 5
Gallery
TOWN OF GAWLER | TOURISM SITUATION ANALYSIS, JULY 2019 PAGE 212.5 Macroeconomic Environment
There are many macro environmental factors impacting local, national and global visitor economies. Although the
influence on these variables are outside the control of the TOG, destinations can, to some extent, adapt to changing
circumstances. Below are several elements in the macro environment that affect the number of visitors and visitor
nights to the TOG region.
2.5.1 Consumer Confidence
Consumer confidence indicators measure the degree of optimism or pessimism that consumers feel about the overall
state of the domestic economy and their personal financial situation. When the level of consumer sentiment is high (for
example, greater than 100) consumers are more likely to increase their spending on discretionary (or non-essential)
items including travel. Should the level of consumer sentiment be low, consumers tend to be more inclined to cut back
on discretionary spending and increase their savings.
For the most part high consumer sentiment (greater than 100) should result in more domestic visitation to the TOG,
and therefore, currently (2019) the region could expect an increase in visitation. However, given travel is a discretionary
spend, the TOG will be exposed to swings in consumer sentiment.
Figure 11 - Consumer Confidence Index, 2009-2019 30
30
Trading Economics, Consumer Confidence Index, 2008-2018 > https://tradingeconomics.com/australia/consumer-confidence
TOWN OF GAWLER | TOURISM SITUATION ANALYSIS, JULY 2019 PAGE 222.5.2 Interest Rates
The domestic interest rate level is a key macroeconomic variable which impacts domestic visitor numbers. Rising
interest rates increase the cost of Australian loans and mortgages which then detracts from discretionary spending on
luxury items such as travel.
However, not all Australia's own homes and have mortgages. As well as having an impact on mortgage interest rates,
the cash rate (the domestic interest rate level) also impacts on domestic savings interest rates, which can have positive
implications for domestic tourism.
The consistently low (record breaking) interest rates (as highlighted below) has certainly encouraged Australians to
spend on discretionary items like travel, however, it may have caused the decline in day trip visitors as potential visitors
seek international travel instead of domestic.
Figure 12 - Australian Interest Rate Index, 2009-2019 31
31
Trading Economics, Australian Interest Rate Index, 2008-2018 > https://tradingeconomics.com/australia/interest-rate
TOWN OF GAWLER | TOURISM SITUATION ANALYSIS, JULY 2019 PAGE 232.5.3 Exchange Rates
The Australian dollar has had something of a turbulent recent history. Fluctuating frequently, in January 2016 it reached
a low of 0.69 against the USD. Since then it has been slowly rising (with persistent peaks and troughs), until, in July and
September 2017, it was valued at above 0.80 to the USD 32
If the value of the AU dollar continues to rise, Australia will become less attractive to international tourists, who will
find Australia a far more expensive destination to visit than it was previously. Likewise, domestic tourism may also
shrink, with Australians who would normally holiday at home deciding they can afford to go elsewhere.
Figure 13 - AUD / US Exchange Rate History, 2009-2019 33
32
Trading Economics, Australian Interest Rate Index, 2008-2018 > https://tradingeconomics.com/australia/currency
33
Trading Economics, Australian Interest Rate Index, 2008-2018 > https://tradingeconomics.com/australia/currency
TOWN OF GAWLER | TOURISM SITUATION ANALYSIS, JULY 2019 PAGE 242.5.4 Travel Forecasts
Australia’s tourism sector remains a shining light for the nation’s economy, with strong growth in both international and
domestic visitor numbers. The strong national growth is a huge opportunity for TOG, and offers the town the
foundation to continue to build momentum for tourism.
Global
International conditions continue to improve with the global economy forecast to grow by 3.5% in 2017 and 3.6% in
2018.
The outlook for advanced economies is improving as well, with forecast growth of 2.0% for both 2017 and 2018, slightly
above growth for 2016. This growth is underpinned by increasing consumer confidence and an upturn of business
investment in major advanced economies such as the US, Japan, the UK and Canada.
Emerging economies are expected to grow unevenly overcoming years. Resource and energy-exporting economies such
as Russia and Brazil are projected to experience low growth after contracting in 2016. Asian economies, however,
including China, India and Indonesia, are performing relatively well with annual rates of growth in excess of 5.0% over
the forecast period. In net terms, emerging economies are forecast to grow by 4.5% in 2017 and 4.8% in 2018. The
overall picture of the world economy remains positive. 34
National
International Travel
• International visitor numbers to Australia are expected to increase 13.1%, from 8.6 million in 2016–17 to 9.2
million in 2017–18 and 9.7 million in 2018–19. Asia will continue to outperform other overseas markets over
this period, brought about by increasing prosperity and the continuing transition of millions of people into
consumer oriented, middle-class populations. 35
• Traditional markets (UK, USA, NZ) will still see moderate growth but not as strong and consistent as the Asian
markets. 36
• The growth Australia is experiencing is the fastest in a generation and is seeing it outpace both global
performance and travel across the Asia Pacific. In fact, international visitation to Australia is growing at nearly
three times the rate of global travel. 37
34
TRA Travel Forecasts 2017 > https://www.tra.gov.au/ArticleDocuments/257/Tourism%20Forecasts.pdf.aspx?Embed=Y
35
TRA Travel Forecasts 2017 > https://www.tra.gov.au/ArticleDocuments/257/Tourism%20Forecasts.pdf.aspx?Embed=Y
36
TRA Travel Forecasts 2017 > https://www.tra.gov.au/ArticleDocuments/257/Tourism%20Forecasts.pdf.aspx?Embed=Y
37
Deloitte Access Economics’ latest Tourism and Hotel Market Outlook report
TOWN OF GAWLER | TOURISM SITUATION ANALYSIS, JULY 2019 PAGE 25Domestic Travel
• In 2017-2018, Australian economic growth is expected to remain at below its historical average, and where
discretionary expenditure may be reined in by slower growth in capital city house prices (particularly in Sydney
and Melbourne) and by sluggish wage growth. 38
• However, as economic growth picks up through 2018–19, and the Australian dollar remains near its long-term
average, there will be a commensurate increase in domestic tourism activity. 39
South Australia - State
South Australia has been identified as one of the top 4 States in Australia forecast to see the most growth in 2017-2018,
with total visitor nights increasing 4.8% over the year to 34 million nights; the result of a 2.7% increase in domestic
nights and a 9.0% increase in international nights 40.
Overnight visitation to South Australian regions from both the domestic and inbound markets are due to increase from
June 2018-2030, at 5-year annual average growth rates of 2.2% for domestic market, and 5.2% for the inbound
market. 41
https://www.hotelmanagement.com.au/2017/02/23/deloitte-report-tourism-sector-remains-shining-light-australian-economy/
38
TRA Travel Forecasts 2017 > https://www.tra.gov.au/ArticleDocuments/257/Tourism%20Forecasts.pdf.aspx?Embed=Y
39
TRA Travel Forecasts 2017 > https://www.tra.gov.au/ArticleDocuments/257/Tourism%20Forecasts.pdf.aspx?Embed=Y
40
TRA Travel Forecasts 2017 > https://www.tra.gov.au/ArticleDocuments/257/Tourism%20Forecasts.pdf.aspx?Embed=Y
41
TRA Travel Forecasts 2017 > https://www.tra.gov.au/ArticleDocuments/257/Tourism%20Forecasts.pdf.aspx?Embed=Y
TOWN OF GAWLER | TOURISM SITUATION ANALYSIS, JULY 2019 PAGE 26Figure 14 - South Australian Tourism Growth 2017-2018
However, state growth will slow down over 2018-2019 to 3.8% (down 1%) due to a decrease in international visitation
(down 3%), while the domestic market remains steady at 2.7% growth. 42
42
TRA Travel Forecasts 2017 > https://www.tra.gov.au/ArticleDocuments/257/Tourism%20Forecasts.pdf.aspx?Embed=Y
TOWN OF GAWLER | TOURISM SITUATION ANALYSIS, JULY 2019 PAGE 27You can also read