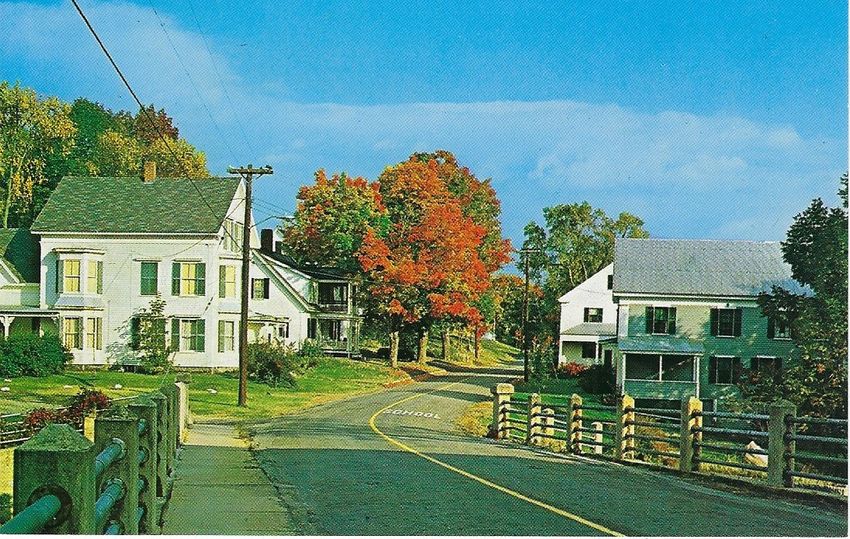
Town of Freedom Master Plan Update March 7, 2020 - Photo: Welcome Sign Elm Street-Rick Davidson
←
→
Page content transcription
If your browser does not render page correctly, please read the page content below
Town of Freedom
          Master Plan Update
            March 7, 2020

Photo: Welcome Sign Elm Street—Rick Davidson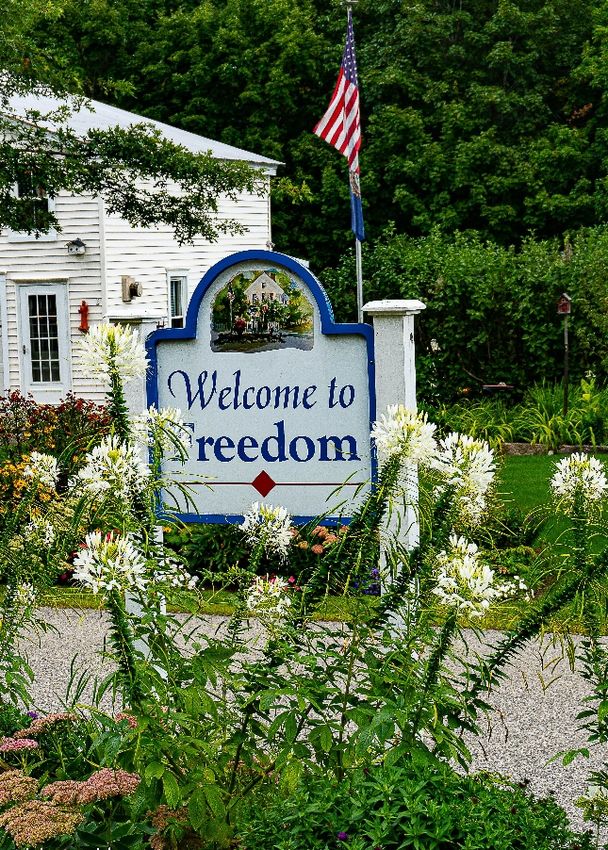
Table of Contents
Vision Statement                                                    1

Chapter 1: Demographics                                             5

Chapter 2: Housing                                                  8

Chapter 3: Natural Resources                                       12

Chapter 4: Land Use                                                19

Chapter 5: Historical Resources                                    23

Chapter 6: Transportation                                          27

Chapter 7: Facilities                                              30

Appendices:
  • APPENDIX A: Detailed Demographic Data for Chapter 1            46
  • APPENDIX B: Housing Needs in New Hampshire                     53
  • APPENDIX C: Detailed Housing Data for Chapter 2                59
  • APPENDIX D: Detailed Natural Resources Data for Chapter 3      56
  • APPENDIX E: Detailed Land Use Data for Chapter 4               63
  • APPENDIX F: Detailed Historical Resources Data for Chapter 5   70
  • APPENDIX G: Detailed Transportation Data for Chapter 6         72
  • APPENDIX H: Detailed Facilities Data for Chapter 7             78

Vision Statement

Freedom’s first Master Plan was adopted in 1987 and updated in 1992 and 2007.
The goals of the original plan still apply today.

Where are we today?
                                                                      Freedom Demographics:

                                                                      Freedom          has      two
                                                                      populations: about 1,500
                                                                      year-round residents plus a
                                                                      seasonal population of youth
                                                                      campers, RV owners, and
                                                                      second homeowners. At the
                                                                      peak      of   the   summer,
                                                                      population can swell to
                                                                      10,000! While the year-round
                                                                      residents      are     spread
                                                                      throughout the town, with
                                                                      some concentration in “the
                                                                      village,”    the     seasonal
                                                                      population tends to live
                                                                      around the town’s lakes and
                                                                      rivers.

                                                                      On a Saturday evening, the
                                                                      village is often without traffic.
                                                                      However, summer residents
                                                                      and tourists bring plenty of
                                                                      traffic to the lake areas in the
                                                                      summer.

                                                                      Population growth slowed to
                                                                      14% in the decade 2000 to
                                                                      2010, after two decades of
                                                                      30%+ growth. The NH State
                                                                      Office of Strategic Initiatives
                                                                      projects growth of 9% to
                                                                      2040.

Photo: Signs at Elm and Old Portland Roads—Rick Davidson

Freedom’s population is aging. As of 2010, Freedom’s median age was 53.0, compared with the US
at 37.2 and New Hampshire at 41.1. The support for senior housing and services reflects this reality.

The increase in both year-round and seasonal residents has translated into an increase in the
number of housing units. Since 2006, the town issued an average of 15 building permits for new
homes per year. (This indicates a slowing rate of issuance compared to an average of 20 building
permits per year for new homes between 2000 and 2005.)

                                                                                                     1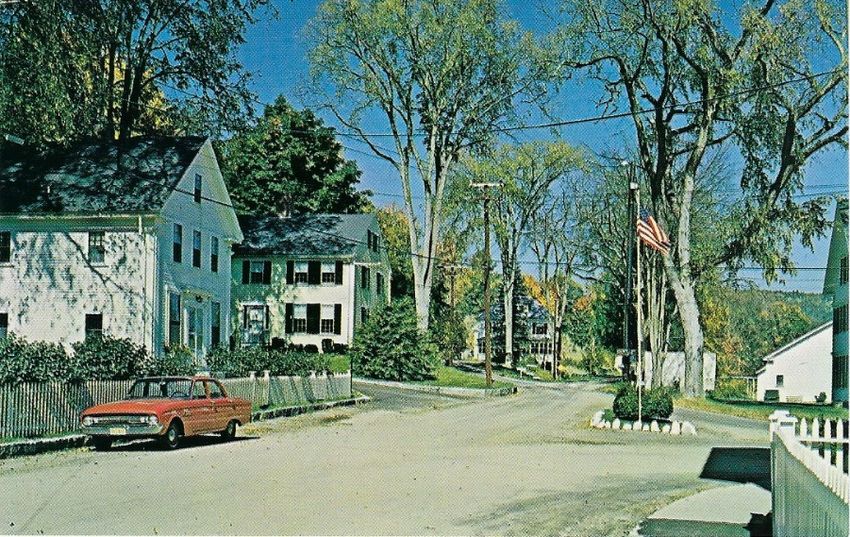
What the Community Said
The current planning cycle began with a Community Survey in 2014 that provided the views of
1,003 people. The survey results are an important input to this plan.
• Respondents said pristine lakes and rivers and maintaining Freedom’s rural character/small
   town feel were very important to Freedom’s character and future. In fact, over 50% of
   respondents said these two were the single most important feature to them. Over 90% of
   respondents said they wanted future zoning ordinances to protect Freedom’s natural
   resources.
• Preserving the quiet residential village and using zoning regulations to do so was rated as
   highly important by three fourths of respondents. For the first time, Freedom’s Master Plan will
   contain a Heritage Resources chapter.
• More than half of respondents said three other features were extremely or very important: the
   town providing services to allow seniors to stay in Freedom, development should be directed
   back from the road, and having a mix of ages and families in town.
• Respondents were most supportive (rating of 4 or 5 on a 5-point scale) of single-family homes
   and assisted living apartment developments for seniors as residential development. Few
   people (4%) supported buildings with 2-4 units.
• Respondents were cautious about supporting more commercial activity in town. Few
   respondents supported more commercial activity in Freedom village.
• Home businesses and contractors running businesses at home garnered more support than
   small commercial businesses did.

Where do we want to go?

The planning board polled the members of the community (residents and seasonal property
owners) on their views and preferences for Freedom “in the future.”

On the question of naming three things that are “most important to Freedom’s character.” The top 3
are shown on the chart below. The bars show the % of respondents who said the feature was one
of three most important. The second column shows the number of respondents who “feel is most
important to protect.”

Vision-Chart 1
                                                                                          % Most
                                                                                         Important
                                                                                           59%
                                                                                           14%
                                                                                           9%
                                                                                           8%
                                                                                           1%
                                                                                           4%
                                                                                           2%
                                                                                           1%
                                                                                           1%

The survey also asked about the importance of a range of features “to your vision of Freedom over
the next 10 years?”

                                                                                                     2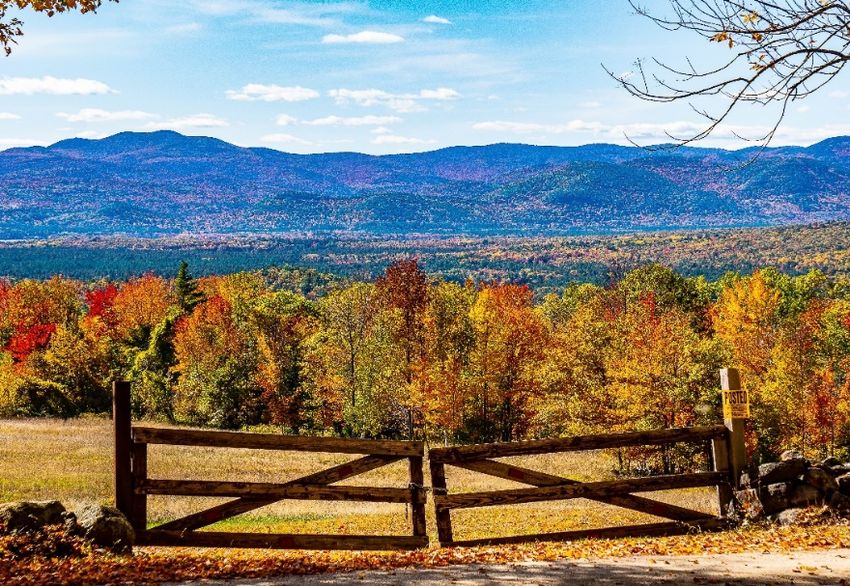
Vision-Chart 2
 % saying it is extremely and very important                                                                                      % most
                                                                                                                                 important
            Freedom retains its rural character and small town feel                                                      92%       53%
    Freedom Village remains the same quiet residential village it is
                               today
                                                                                                                   75%             11%
   The town provides services to allow seniors to stay in Freedom                                            67%                   5%
 Development takes place back from the road and with open space
                    around clustered homes
                                                                                                           65%                     2%
                           Freedom has a mix of ages and families                                      59%                         9%

  More jobs are within the town or commuting distance of Freedom                               48%                                 4%
                           Freedom has its own elementary school                              46%                                  2%
      Freedom has more housing priced within the reach of young
                        families and seniors
                                                                                              45%                                  5%
Seasonal homes remain the majority of housing units (now at 53%)                        36%                                        3%
        Freedom Village has more retail and/or commercial activity                24%                                              5%
                     Freedom is primarily a retirement community            14%                                                    2%
                                                                       0%   20%         40%          60%           80%    100%

Respondents also weighed in on what zoning changes they support in the future.

Vision-Chart 3

Based on these findings, the Planning Board has proposed the following vision for what Freedom
will be like in 2025:
• Is a rural, peaceful place which has maintained its scenic beauty and its rural character.
     − Has protected and preserved open space, wetlands, forests, fields, agricultural resources,
         scenic vistas, and historic resources for the benefit of present and future generations.
     − Has used current or amended regulations to protect the environment or abutting property
         from the negative effects of economic development.
• Has protected the quality of its water resources (lakes, rivers, and the aquifer) using effective
     watershed and shoreline management principles.
     − Has strengthened regulations and ordinances to control storm water run-off, soil erosion
         and sewage disposal that can degrade the natural habitat.
• Is a caring community with a mix of ages and families and the housing resources needed to
     attract and retain them.
     − Has retained the traditional character of the town center, has provided a sense of place,
         and has enhanced the community’s identity.
     − Has helped seniors stay in Freedom
     − Has provided quality educational opportunities for its residents.
     − Has the range of housing options to achieve this goal.
• Has approved ordinances that support this master plan.

                                                                                                                                        3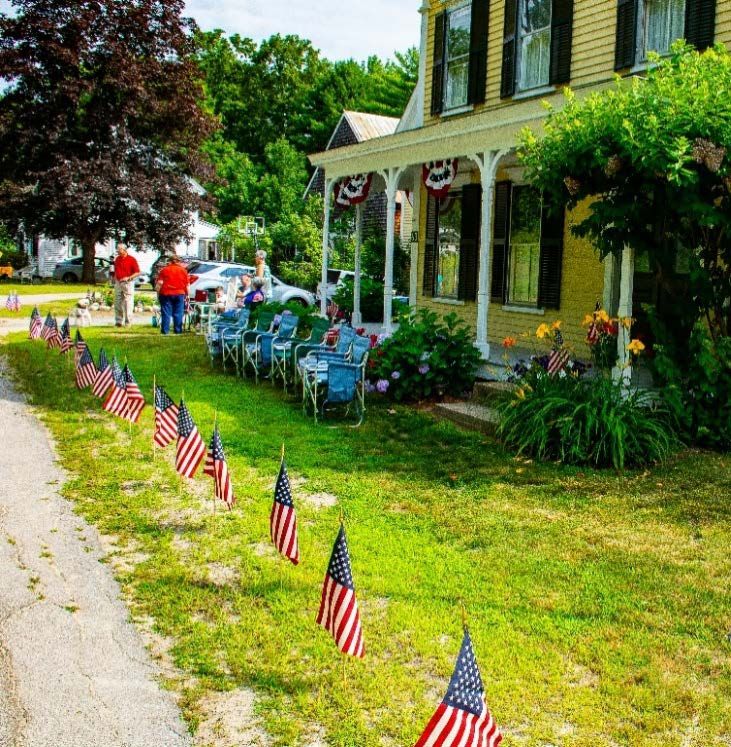
The board will use these statements to evaluate any recommendations proposed in the Master
Plan.

In addition, the board proposes the future vision for other aspects of the town—not directly related
to land use:
     • Has maintained a low crime rate.
     • Has maintained the rights of all citizens to their individual peace and tranquility.
     • Has accommodated the services and infrastructure needs of residents without placing an
        undue tax burden on taxpayers.
     • Has kept its property tax stable.
     • Has planned and implemented a safe, attractive, and efficient road transportation network.
     • Has an up-to-date Emergency Management Plan.
     • Has supported energy conservation and the use of alternative energy.

How do we get there?

       The following chapters in this Master Plan contain the guiding principles and
       recommendations necessary to achieve this Vision for the Town of Freedom.

Photo: Burnham Road overlooking Ossipee Lake—Rick Davidson

                                                                                                       4
CHAPTER 1: DEMOGRAPHICS
                                                                 Understanding population
                                                                 characteristics and trends is one of the
                                                                 most fundamental aspects of a Master
                                                                 Planning effort. The demand for
                                                                 housing, land use, and municipal
                                                                 services all depends on the number of
                                                                 people in town. In addition to the
                                                                 number of people, understanding the
                                                                 characteristics of the population, such
                                                                 as age distribution, education and
                                                                 income levels, is useful. For example, a
                                                                 town with an older population may
                                                                 require more specialized services for
                                                                 the elderly while a community with
                                                                 many young families will need more
                                                                 school capacity.

                                                                 Here are data on trends regarding
                                                                 population, age, household size and
                                                                 income, and educational attainment.
                                                                 (See Appendix A, pages 46-52 for
                                                                 detailed data.)
    Photo: Old Home Week Parade onlookers on Elm Street—Rick Davidson

•    Freedom’s population has more than quadrupled since 1950. Over the last ten years,
     Freedom’s growth rate has been 14%--right at the average growth rate of NH communities with
     populations of 1,000 to 2,499. Natural growth (net of births and deaths) has been negative
     over the last decade. Population growth has been the result of net in-migration. (See Chart A-1
     and Tables A-1 to A-4)
•    Freedom’s population is getting older. In 2010, Freedom had the highest percent of population
     65 years and older. In 2000, Freedom’s median age was 48.6 years. By 2010, Freedom’s
     median age was 53.1—second only to Eaton’s at 55. (See Tables A-5 and A-6 and Chart A-2)
•    Freedom’s population density (number of people per square mile) has grown by 59% between
     2000 and 2010. (See Table A-7)
•    Population projections developed by the NH Office of Strategic Initiatives indicate that
     Freedom’s population will continue to grow, but more slowly than in the past. Freedom is
     forecast to grow by 8.5% by 2025 and 11% by 2040. (See Table A-8)
•    Additional historic census data show that Freedom’s population:
     o Is well educated—almost one third of Freedom’s population has a college and/or an
         advanced degree. (See Chart 3)
     o Median household income has risen by 12% between 2000 and 2010, which is slower than
         surrounding towns. As a result, Freedom has dropped below all but Ossipee in median
         household income. Median family income in Freedom has dropped $985 between 2000
         and 2010, leaving Freedom with the lowest median family income of surrounding towns, the
         county, and the state. (See Tables A-9 and A-10)
     o Has a low poverty rate—In 2010, Freedom’s rate was 6.7%, above the rate in Effingham
         and Madison, but lower than the others. Tamworth and Ossipee had poverty rates of 10%
         or more. (See Table A-11)

                                                                                                        5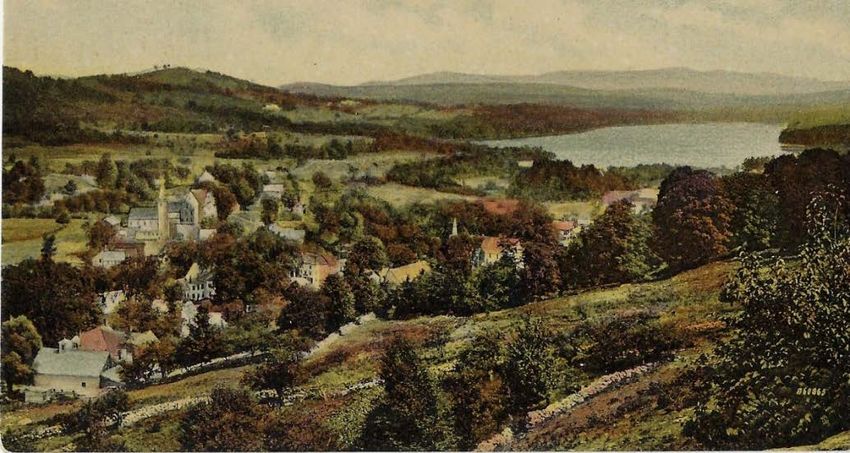
Community Survey respondents weighed in on what was important to their future vision of Freedom.
Different groups (year-round residents vs. seasonal, different ages, location of their home) show
some differences. (See Chart A-3):
    • Senior services received the highest ratings on the demographic questions: Two-thirds of all
        who responded to the survey rated “seniors staying in their homes” as very or extremely
        important compared to 75% of retired people and 80% of Freedom residents over age 75.
    • More than half, 60% of all respondents said “having a mix of ages and families” is very or
        extremely important. Year-round residents said this was important—75% of those under 55
        years old and 79% of those 66-74 years old rated this very or extremely important.
    • Only about half of respondents said that “Freedom has its own elementary school” was very
        or extremely important.
    • Respondents were not enthusiastic that Freedom would be “primarily a retirement
        community.” 14% of all respondents and 17% of year-round respondents said this was very
        or extremely important. Seasonal respondents weighed in at 12% while 23% of older year-
        round respondents rated this very or extremely important.

The aging of the population and the loss of and failure to attract families with children is changing
our community. The Community Survey also asked respondents if they supported spending more
tax dollars on seniors and youth.
• While respondents saw helping keep seniors in their homes as important to the future (65+%),
    there was less support for spending “more tax dollars on senior services” and support varied by
    age:
        o All respondents: 46%
        o Year-round: 50% versus Seasonal:43%
        o Year-round
secondary students is close to $4 million in 2019-2020.

The shortage of residents of working age may lead to shortages of staff to fill town staff jobs
and for the volunteer fire department.

The school has studied the question of how to attract more families with children to Freedom
but has not adopted programs to do so. The school board and administration see this as a
housing issue. The planning board will pursue housing ordinance changes to help meet this
goal. (See Chapter 2 Housing)

                                                                                                  7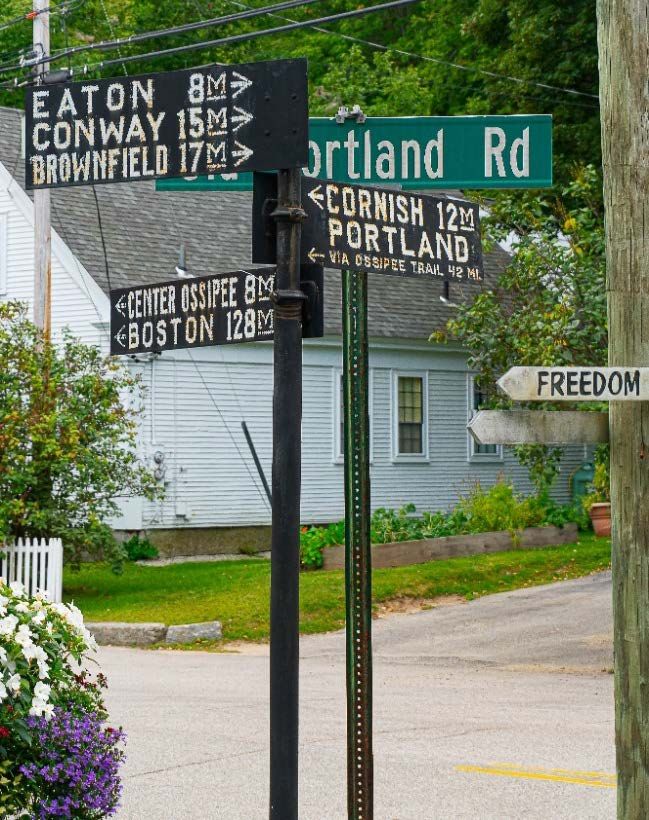
CHAPTER 2: HOUSING

Postcard: Old Portland Road—Freedom Historical Society collection

Housing is a vital component of every town; it is an integral part of the town’s tax base and can
have an impact on school enrollments and the demand for essential town services. While growth is
linked to new housing, in many Lakes Region towns, the conversion of seasonal housing units to
year-round residences is an important growth trend as long-term seasonal residents retire to
second homes that have been converted to year-round residences.

New Hampshire is facing challenges in the future to provide housing for its residents. In 2014, the
NH Center of Public Policy Studies completed a comprehensive study of NH housing. The study
identified trends that signal future problems: declining home ownership and less new construction,
seniors and young workers want more affordable, smaller homes/housing compared to available
housing stock, and seniors are an ever-larger share of homeowners. See Appendix B (page 53)
for more detail on these findings and for the web links to the three major sections of the report.

The number of housing units in Freedom has increased significantly since 1980. The percentage of
housing units increased 118% between 1980 and 2010. (Population increased 107% in the same
period—see Chapter 1: Demographics, page 5).

Most of Freedom’s growth has been year-round, single family units driven by a one lot/one house
zoning philosophy. In the 2006 Master Plan, housing growth was forecast to increase 60% by
2025. The forecast for Carroll County growth today is much slower—17% by 2025.
Freedom’s homeowners and renters face challenges in paying for housing in Freedom. Renters’
lower incomes mean that they cannot afford the fair market rent in the area. While homeowners
have higher incomes, escalating property values present affordability problems for these
households as well.

                                                                                                  8
Freedom Community Survey
Community Survey respondents were asked their views on what kind of community they want to
live in and what housing options they want available.
• Respondents placed very high value on rural character and natural resources (Vision Chart 1
and Chart 2)
• They also support development back from the road in clusters to protect these values. The
survey showed support for housing for seniors and families and little interest in multi-family
housing. (See Chart C-1)
• Respondents also expressed support for senior housing and for helping seniors stay in their
homes. About half of year-round respondents expressed strong support for affordable housing
in Freedom. (See Chart C-1)
Given the above trends and views, this chapter examines the housing trends in Freedom as
compared to adjacent communities, Carroll County, and the state. The historical data are based on
the US Census. Data included in the presentation are the number of housing units, the type of
housing units, projected number of housing units, median value of housing, and an analysis of the
affordability of housing in Freedom.
Housing Units
Data on housing trends come from the US Census, which provides data for Freedom as well as
surrounding towns (Eaton, Effingham, Madison, Ossipee, Tamworth), Carroll County and the state
of NH. Data also come from the town’s records of building permits. See Appendix C (pages 54-
58) for the detailed data behind the trends listed here:
• Freedom’s housing unit growth rates varied significantly by decade—67% growth in the 1980s,
dropping to only 4% growth in the 1990s when the economy was bad, and rebounding
somewhat, to 12%, after the 2008 recession in the mid-2000s. (See Table C-1)
• Freedom’s growth rates do not track with local communities, Carroll County, and the state. The
growth was much higher in the 1980s, much lower in the 1990s and on the lower end in the
2000s. (See Table C-1)
• More than half of Freedom’s housing units are seasonal—the highest percent of the
surrounding towns, Carroll County, and particularly NH at 10%. The tipping point was in the
1980s when the percent of seasonal homes increased from 37% to 65% in 1990. That number
dropped to 55% by 2000 and to 52% in 2010. This latter drop may reflect seasonal homes
converted to full time homes as people retire. (Charts C-2 and C-3)
• Reflecting Freedom’s “one house/one lot” zoning philosophy, single family homes were 92% of
Freedom’s housing units in 2000 and 83% in 2010. The development of The Bluffs may
account for some of that difference. Madison (95%), Eaton (92%), and Effingham (86%) had
higher shares of single-family homes. Statewide, only 68% of housing units are single family
homes. (Charts C-4 and C-5)
• Building permits illustrate increases and upgrades to the housing stock. Since 2006, Freedom
has averaged 15 new homes per year and over 130 permits for improving existing homes. (See
Table C-2)
Housing Affordability
The availability of housing is not enough, housing must also be affordable for families and seniors.
New Hampshire and many local communities struggle with the need for affordable housing—that is,
rentals or homes for purchase that the average household in a community can afford and still pay
other bills. Without affordable housing, it is difficult for businesses and municipalities to attract and
keep employees, particularly younger families.
9An “affordable” rent or mortgage is generally defined as taking no more than 30 percent of a
household’s annual gross income.
Rental Affordability
The Department of Housing and Urban Development (HUD) provides information on rental
affordability based on median incomes and the fair market price of a two-bedroom unit in the area
(Carroll County) provides a useful indication of affordable housing. (Table C-3)
• The average family in Freedom can afford to pay the Fair Market Rent (FMR)
• However, the availability of rental housing at these rates—or at all—make finding housing
difficult.
Home Ownership Affordability
While rent at the fair market rate is one indication of housing affordability, the cost of
home ownership is also an issue. While rents are usually analyzed to understand housing
affordability for moderate and low-income households and families, the cost of owner-
occupied homes and the cost of mortgages can also have some of the same negative
impacts on the local economy, housing affordability and the availability of employees for
local and regional employers.
Trends in home ownership affordability (Chart C-6)
• Between 1990 and 2010, the median value of owner-occupied homes in Freedom
increased 102%.
• Madison is the only surrounding town with higher median property values than
Freedom at $266,000—an increase of 135% over twenty years.
• The state and Carroll County also have median values around the $250,000 mark with
values doubling in the last twenty years.
The US Census also gathers data on those spending more than 30% of their monthly income on
housing costs for both households with a mortgage and those with no mortgage. (Table C-4)
• Freedom has the next to lowest percent of households paying more than 30% of their
income on monthly housing costs at 21%. The bad news is that one in five home owning
households pay 30% or more of their income on monthly housing costs.
• In contrast, one in three households in Ossipee and Tamworth spend more than 30% of
their income on monthly housing costs.
Developer’s Perspective on Affordability
From a developer’s perspective, affordability is driven by land costs, which are determined by
zoning density requirements, and access to water and sewer infrastructure. Freedom Village
Water Precinct provides water to 67 residences, various town facilities, the church, Masonic Hall
and the Village Store building in the Village. Freedom has no public sewer system. Every building
needs to provide for its own septic system.
Freedom has extensive zoning regulations that determine density, and therefore, a builder’s land
costs. Article 9 of the ZO covers cluster development, elderly housing, elderly group homes,
accessory dwelling units, workforce housing, multi-family housing, and manufactured housing.
(Table C-5)
• Each zoning district has different requirements that determine density—from 1 acre in Village
Residential to 5 acres in Rural Residential.
10• Specific articles that address cluster developments, elderly housing, workforce housing,
accessory dwelling units also affect permitted density.
Recommendations
Freedom’s housing challenges are not unique. The entire state of NH has the same problem: the
lack of affordable housing for both younger people (singles and families) and seniors. Many young
people have college debts and/or are struggling with low paying jobs that offer few benefits.
Families with children face additional expenses—for day care, health care, and other needs. In a
low pay work environment, parents are often torn between working and paying for daycare.
Many seniors are on fixed incomes. Seniors, many of whose homes are larger than they need, are
looking to downsize. Even when their homes are right-sized, they may not be age-friendly—that is,
all on one floor, wheelchair accessible, low maintenance requirements. Ironically, younger people
and seniors are often competing for the same housing.
The Community Survey supports helping seniors stay in their homes and/or and having a mix of
families and ages in in Freedom. The Planning Board supports both goals. To support wider and
more affordable housing choices in town, the board sees the need for changes in housing-related
zoning rules. Some of the possible changes that could promote this objective are:
• Change regulations to make it more attractive for developers to build in Freedom
• Increase the use of cluster developments,
o Provide a density bonus in cluster subdivisions in the general residential
o Reduce the one-acre requirement per home to create a smaller cluster to add savings
on roads with the subdivision and perhaps other infrastructure.
• Increase the availability of assisted living apartments for seniors. Look for developers who
might want to develop in Freedom. Allowed density is already quite high.
• Allow detached accessory dwelling units
• Allow duplexes and multi-family dwellings in more districts.
Postcard: Looking down on Freedom Village from Andrews Hill—Freedom Historical Society collection
11CHAPTER 3- NATURAL RESOURCES
Photo: Ossipee Lake sunset—Les Babb
Freedom’s rural character is primarily defined by its many lakes and ponds, open space, wildlife
habitat, and forests. The primary focus of this chapter is to identify the natural resources in
Freedom, New Hampshire, recognize the role they play in giving our town its character and value,
and recommend strategies that will best maintain this character. Revisions to this section of the
Master Plan reflect changes that occurred over the past decade and include responses from the
2016 Freedom Community Survey.
All community’s resources are interconnected: any change to one can have a significant impact on
the others. As the population changes, demands on natural resources will increase. This chapter
identifies risks to natural resources and makes recommendations that strike a balance between
development and resource protection within Freedom that will guide future sustainable
development within the community.
The preservation and conservation of natural resources was the predominant concern of the
Freedom Community Survey. Most respondents, whether full-time residents or part-time seasonal
residents, overwhelmingly and consistently selected water and land as the most valued resources,
with water the primary concern. Other related concerns identified in the Survey included: the
protection of natural resources and the continued management of variable milfoil infestations in our
lakes and rivers.
• 80% of the respondents said pristine lakes and rivers was one of three things that
contributed most to Freedom’s character
• 59% of the respondents said pristine lakes and rivers are the single most important
contributor to Freedom’s character to protect over the next 10 years—the next closest
was protecting the quiet residential village at 14%.
• 93% of the respondents supported the use of future zoning regulations to
protect natural resources
• 62% of respondents support spending more tax dollars to fight milfoil in lakes and
rivers (by far the largest support from a list 10 town-wide projects)
The planning board will keep these views in mind as it formulates future ordinance changes.
12Map of Freedom
Freedom contains 34.5 square miles of land area and 3.4 square miles of inland water area and is
bordered by the Ossipee River to the south, Maine on the east, Ossipee Lake and West Branch
River on the west and by Madison and Eaton on the north.
Freedom is rich in natural resources: land, water, wildlife habitat, and biological diversity. See page
85 for a detailed Natural Resources map that shows these various features.
Land
Topography and Soils
The eastern part of Freedom is characterized by a hilly topography and steep slopes and is home
to several hills whose elevation exceeds 1,000 feet, including Blazo, Prospect, Cragged Mountain,
and Durgin Hill. Two smaller and moderately steep hills and trails, Mary’s Mountain and the
Scarboro Ridge Trail, provide spectacular views of the lakes.
Development of hilly topography presents unique challenges. Development is often restricted on
steep slopes (greater than 15-25%) because of adverse effects on ground water due to increased
soil erosion, storm water run-off, sewage disposal, sedimentation. It also degrades the natural
habitat and views of the hillsides. (See more detail on steep slopes in Appendix D, pages 59-65).
The areas around the lakes and ponds and most of the land in general residential are flat and are
predominantly sandy soils. Historically, most development has taken place in these areas. (See
Chart D-1 for Freedom soil types.)
13The US Department of Agriculture, through the National Resources Conservation Service, also
categorizes soils. Farmland is characterized as either prime farmland, farmland of statewide
importance or farmland of local importance. Freedom’s farmland accounts for 57% of the land.
Half of the farmland is considered of local importance. These lands are not prime farmland but
have significance for the local production of food, feed, forage, and limited livestock (pigs and
chickens). Freedom is home to several small farms that produce vegetables, hay and other crops.
As in the rest of the state, the number of working farms is small. The Master Plan should recognize
niche farming as well as the ability to grow food locally. In promoting agriculture, land use regulations
should also protect the rural nature of Freedom with safe practices that do not contaminate the land or
groundwater.
Conservation Land
Conservation lands in Freedom provide scenic and open space resources, water resources, and
wildlife habitat. These lands also support good air quality and mitigate climate impact. Freedom
currently has 4,926.1 acres or 22.3% of the land in conservation. Town-owned land is 10% and
easement land (easements held by private organizations) is 12.3%. Three large tracts of land in
conservation comprise 84% of the total: Freedom Town Forest (2,602 acres—town-owned), the
Ossipee Pine Barren Preserve (1,249 acres—easement), the Harmon Preserve and Burch Forest
(283 acres—easement). The balance is in smaller parcels. (See Tables D-1 and D-2)
The private organizations that partner with Freedom to protect land by holding conservation
easements are The Nature Conservancy, Society for the Protection of NH Forests, Green
Mountain Conservation Group, and Upper Saco Valley Land Trust. (See Table D-3 for contact
information).
Other groups that work to protect Freedom’s water resources are NH Department of Environmental
Services (water quality protection grants) and Green Mountain Conservation Group (water testing
and grant management).
Water
The Ossipee aquifer stretches across much of the western side of town and is a primary source of
well water for the town. Freedom is fortunate to have a multitude of excellent water resources to
meet existing and future needs for drinking water as well as recreational enjoyment. In addition to
residents’ use of water for recreation, tourism is a major source of revenue as are the property
taxes that come from second homeowners.
Freedom’s water resources include many lakes and ponds, wetlands and a significant aquifer.
Freedom has 2,185 acres of surface water and sits over the Ossipee Aquifer, New Hampshire’s
largest stratified drift aquifer. According to the U. S. Department of the Interior geological survey,
9.3 square miles or 26% of the area in Freedom sits atop the stratified-drift aquifer.
Groundwater/Aquifer
Clean, safe groundwater is critical to Freedom. Village residents have community water from
the Freedom Village Water Precinct, while other residents rely on personal wells. All residents
have a vested interest in protecting groundwater and the stratified drift aquifer, which recharges
quickly to provide water to wells and springs. While quick recharge is an advantage in capturing
water, it also means that pollutants could just as quickly contaminate the aquifer.
In 2011, the town voted to adopt a groundwater protection ordinance that regulates commercial
14practices in the Groundwater Protection District. (See Chart D-3 for the map and definitions.) This
ordinance prohibits the development or operation of uses that could contaminate the aquifer (e.g.,
hazardous waste disposal facility, solid waste landfill, gasoline stations) while allowing other uses
that might cause contamination by conditional use permit. The ordinance allows the town to
enforce the use of best management practices in this district.
Currently the state does not regulate the residential use of potential contaminants since they are
typically used in small quantities. However, many homes in the primary recharge areas have
petroleum products, a major contaminant. The cumulative effect of spills of gas tanks all around
the lake could have an impact on water quality. Education is the key to address residential threats.
Surface Water
Surface water in local lakes and ponds is the most obvious water resource, providing many
recreational activities to both residents and visitors. Their water quality is not only essential to the
ecosystem, but also to the economy of Freedom. Two of the most serious threats to surface water
in Freedom are storm water run-off and invasive plants such as milfoil.
The Ossipee Watershed rivers and streams have been monitored by Green Mountain
Conservation Group (GMCG) since 2002. GMCG has also completed two phases of a Watershed
Management Plan: Phase 1 covered the lower bays and Danforth Ponds and Phase 2 covered
Ossipee Lake. The impetus for developing a watershed management plan was the decrease in
the health of Ossipee Lake because of more plant growth and less oxygen in the water—measured
by an increase in phosphate levels from 6.0 parts per billion (ppb) to 7.5 ppb.
The plan identifies some key items:
• Major sources of the phosphorus that enters the lake system. The largest portion, 87%, is the
watershed load—phosphorus that comes off the land in the watershed. (See Chart D-4.)
• Phosphorus loading by sub-watershed that shows direct runoff from shorefront areas. Is shows
the intensely developed Lower Bays’ direct runoff is 1.03 kilograms per hectare per year
compared to .029 kilograms per hectare for the wooded Danforth Pond sub-watershed. These
data show where development may have a negative impact on water quality. (See Chart D-5)
The Watershed Management Plan made the following recommendations to protect water quality
and reverse the degradation trend:
1. Enforce Septic Regulations
2. Address Best Management Practices (BMP’s)
3. Create Aquifer Protection Committee (implemented)
4. Monitoring (ongoing)
Variable milfoil infestations continue to be a problem in the Ossipee Lake system. As of 1 January
1998, propagation and transportation of exotic aquatic weeds was prohibited. Despite that, the
town has been fighting milfoil since the early 2000s. Infestations have been treated in upper,
middle, and lower Danforth Ponds, Broad Bay (near Ossipee Lake Marina), and Berry Bay (on the
Effingham town line), using diving, hand removal, and 2,4-D treatments. Since 2006, the town has
spent over $88,000 on milfoil removal, funded from taxes and private donations. (See Table D-4)
An important factor in containing and preventing future infestations is educating boaters and lakefront
homeowners about this threat. The New Hampshire Lake Association’s Lake Host Program helps
prevent the introduction and spread of exotic aquatic plants (such as variable milfoil) in Ossipee
Lake. From 2013-2018, these Lake Hosts have inspected more than 3,750 boats at the Pine River
15boat launch and provided information to many more boaters about the lake’s milfoil infestations.
These inspections found 5 cases of invasive species (See chart D-6).
Wetlands
Freedom has 1,689 acres of wetlands—areas delineated as poorly or very poorly
drained soils, which include swamps, marshes, fens, and bogs. A fen is a low and
marshy area and is one of the main types of wetlands. Other types of wetlands include
grassy marches, forested swamps, and peaty bogs.
Photo: Cattail—Paul Elie
Wetlands provide protection against shoreline and bank erosion and mitigate
flooding during heavy precipitation by absorbing excess water, thus preventing downstream
property damage. Wetland vegetation traps sediments and excess nutrients such as nitrogen and
phosphorus from storm water run-off, excess or improper lawn, garden and farm fertilization.
Disturbance or destruction of wetlands, and upland areas surrounding wetlands, should be
minimized. The state of New Hampshire has just published new Wetlands rules—the planning
board will review the final rules and make any needed changes to the existing wetlands ordinance.
Flood Hazard Areas
Floodplains are home to a diversity of wildlife and contribute many free ecological services to our
community. They help filter pollutants to prevent them from entering streams, improve water
quality, control erosion, and act as buffer zones along riverbanks and protect against catastrophic
flooding. Floodplains also provide corridors for wildlife. Freedom has a floodplain ordinance that
conforms to FEMA requirements and participates in the National Flood Insurance Program (NFIP),
which limits development in 100-year floodplains to transient or well anchored structures.
Freedom’s 100-year flood level is 414 feet above sea level.
Freedom has several Zone A flood areas; which FEMA considers having a 1% of annual flooding.
These areas are subject to development restrictions. (See aqua shaded areas on Chart D-7.)
Biology
Unusual Plants
The Ossipee Pine Barrens in Freedom is New Hampshire’s last intact example of pitch
pine/scrub oak woodland, a globally rare forest
type, one of the state’s most endangered
species. In New Hampshire, hairy hudsonia
(pictured) is only found in sand dunes near the
coast, sandy lake beach strands, and the
Ossipee Lake Natural Area. Other rare
species include slender leaved goldenrod,
golden heather, blunt-leaved milkweed, and
fine coastal plain grass-leaved goldenrod. The
Ossipee Pine barrens serve as a natural habitat
for pitch pines. Plants found in the Ossipee
Pine Barrens include scrub oak, black
huckleberry, low-sweet blueberry, sweet fern,
and woodland sedge.
Photo: Hairy Hudsonia plant—Paul Elie
16Wildlife Habitat
Wetlands provide habitat for nearly 140 of the 400 plus wildlife species in New Hampshire. Many
fish species use wetlands and adjacent upland areas for critical feeding, spawning and brood
rearing habitat. Freedom contains significant areas of habitat due to its varying topography,
areas of undeveloped land, and its many lakes and ponds.
The forests house a diversity of uncommon wildlife, including
nearly two dozen threatened and endangered species, l ike
whip-or-wills, common nighthawk, Eastern towhee, and the
saw-whet owl (pictured). The saw-whet owl is the smallest
we have in the northeast, being a chunky eight-inches long.
Saw- whets are notorious for their uncommon tameness
and can be closely approached, and even occasionally
caught by hand. These northern forests are also home to
bobcat, raccoon, skunk, porcupine, snowshoe hare, fox,
coyote, weasel, hawks, turkey, deer and grouse.
Photo: Saw Whet Owl—Paul Elie
Development puts pressure on both plants and wildlife habitat. When planning for housing and
other development, an important goal is protecting plant and wildlife habitat and corridors. See page
86 for the Wildlife Map.
Other Concerns
Energy
Freedom supports the state’s goal to incorporate alternative energy sources into the energy mix.
In 2018, Freedom voters passed an ordinance allowing wind energy. In March 2019, the voters
approved a solar energy ordinance that will ensure that ground mounted installations will have
screening to protect Freedom’s rural character. The planning board will continue to pursue
alternative energy options.
Light
The use of low level indirect and shielded lighting and limited streetlights help maintain a
balance of development with preservation of the rural character. The board will explore zoning
regulations that will protect the dark skies in Freedom to protect rural character.
Recommendations
Facing a future with increased pressure from development, Freedom needs to protect and conserve
its natural resources. Freedom seeks to strike a balance of achieving sustainability while meeting
the needs for development and protecting the rural character of the community. The lakes, ponds,
hills, rivers, land corridors, forests, and dark skies combine to characterize Freedom as the rural
community its citizens requested in the 2016 Community Survey.
Things the Planning Board can do to protect natural resources:
• Add stormwater management provisions to zoning ordinance to enable enforcement outside of
site plan and subdivision regulations.
• Educate Freedom board members and citizens:
o Orient all Freedom Board members and elected officials about basic conservation
strategies and priorities
17o Promote Best Management Practices (BMPs) for residential and business projects (storm
water run-off, hazardous materials, etc.)
o Educate shorefront residents on septic system do’s and don’ts
o Educate local winter plowing contractors on the proper use of salt
• Preserve rural atmosphere and landscape with regulations that protect open space, wetlands,
forests, fields, agricultural resources, scenic vistas, and tranquility for citizens
• Educate citizens that updating current use status of land used for farming to Farm
Use, would give the benefits of current use to any land that provides $2,500 in
agricultural or horticultural products, regardless of size.
Photo: Eastern edge of ring-dike from Ossipee Lake, Freedom, NH—Paul Elie
18CHAPTER 4: LAND USE
Understanding and managing land
use and development are among
the most important concerns of
community planning. The Land Use
Chapter is critical because it starts
with understanding how the land is
currently used and recommends
areas of future development or
other land uses to support the
town’s vision, goals, and objectives.
Freedom’s location along the Maine
border, and south of the Mt.
Washington Valley, has attracted
new residents and visitors since the
early twentieth century. Freedom’s lakes, rivers, ponds, and mountains will continue to attract both
year-round and seasonal residents. The challenge for Freedom is to balance community
preferences to protect its rural character and individuals’ rights to use their property.
The community survey asked several questions about land use.
• As shown on Vision Chart 1 (page 2), 80% of respondents
mentioned “pristine lakes and rivers” as one of three features that
“contribute most to Freedom’s character.” 59% said this was the
single most important contribution to Freedom’s character.
• Vision Chart 2 (page 3) shows 92% of respondents said that
“protecting Freedom’s rural character” was extremely and very
important. 53% said rural character is the single most important
to their vision of Freedom. This is a clear message about land
use policy.
• Three-fourths (75%) of respondents said it was extremely and
very important that “Freedom Village remains the quiet
residential village it is today.” Older respondents said this was
even more important.
Photo: Little Ossipee River (Huntress
Bridge)—Joel Rhymer
Respondents weighed in on the level of development in different town districts and more than half
of respondents “felt the current level of housing development” is “just right.”(See Chart E-1)
• 66% said development in the village is “just right.”
• Over 20% of respondents said that current level of housing development right on the water is
too much, with only 54% saying it is “just right.”
• 15% of respondents said there is not enough housing development in the rural residential
district.
When asked “to what extent do you want future zoning regulations to support the following,”
respondents supported the following to a great extent (4 and 5 on a five-point scale), three items
topped 50% (See Chart E-2):
• Protect natural resources—93%
19• Preserve/protect historic buildings and sites—73%
• Allow low impact home businesses—67%
Commercial activity is an important land use. (See Chart E-3)
• 58% of respondents supported more home businesses and 48% supported contractors who
work outside the home (e.g., building contractors, landscapers)
• Support for health clinic and small light commercial businesses dropped to 40% of respondents
• Only 21% supported more light manufacturing
When asked “what level of tax support they wanted to see used for various purposes,” (See Chart
E-4)
• One third of respondents said tax spending is “fine as is” on two land use questions—placing
land in conservation and preserving historic buildings/sites.
• In contrast, fighting milfoil in lakes and rivers topped the list with 74% wanting to spend more
Current Land Use
Freedom’s land is in a variety of uses:
• Residential—mostly single-family homes
• Commercial—businesses, primarily along Routes 25 and 153 and privately-owned camps
• Tax exempt—Town, county, and state properties, churches, non-profits, and Camp Huckins
(owned by Carroll County YMCA)
• Current use—plots of land greater than 10 acres with no development, which receive a
significant tax discount
• Utilities—land owned by electric utilities
Residential is further divided:
• Residential (only)—village, land along main roads and in the hills
• Residential with deeded water access—Ossipee Lake Village, Mountview, Sole-Air
• Residential on the waterfront—properties on the lakes and rivers in the shorefront overlay
See Current Land Use Map on page 87.
In Appendix E, Charts E-5, E-6, E-7 and E-8 show the current land use map and patterns of
current land use—the percentage of lots, of acres, and of value. Here are some of the highlights of
the analysis:
• The assessed value of various land uses shows how important the waterfront and water access
properties are to the tax base. At 12% of land (acres), they provide 68% of all taxes—a good
reason to protect Freedom’s water quality .
• Residential-no water access is 23% of assessed value—and 47% of acres. This reflects $5.5
million in current use credit.
• Reflecting the special tax treatment, both land in conservation and in current use are 38% of
land in town (acres) but generate less than 1% of assessed value.
The patterns of development—as seen in the number of lots—shows most residential use located
around the lakes, ponds and rivers in the southern part of Freedom. Notably, camping and
residential development are around Ossipee Lake and Bays, Danforth Ponds, Loon Lake, and
Ossipee River.
20Zoning
Freedom first adopted zoning in 1987. While the zoning has been amended over the years, the
zoning ordinance reflects a desire to manage commercial development and direct it to certain
areas to protect natural resources and provide for open space. The current ordinance includes the
four zones: village residential, general residential, rural residential, residential/light commercial,
plus a shorefront overlay district that extends from the high-water mark to 300 feet inland. Each
district has specific acreage and road frontage requirements and permitted, and special exception
uses. (See Table E-1, page 69—District Descriptions)
Continuing the analysis of percent of land (acres) and value, patterns arise (See Chart E-9):
• Village, General Residential, and Residential/Light Commercial are about the same percent of
acreage and value.
• Shorefront properties have more value than acreage, reflecting the high valuations of
shorefront properties.
• Rural Residential (RR) has much more acreage than value—reflecting the lower valuations of
these properties and the impact of current use—25% of acres in RR are in current use.
Development Trends
As discussed in the Housing chapter, development has primarily been new home construction and
redoing existing homes. Subdivision activity has been slow. No subdivisions occurred in the
seven years from 2007 to 2013. Between 2014 and 2017, six subdivisions resulted in 16 new lots.
In addition, an elderly housing development was approved that created 18 units for single family
homes on a single lot. The lack of town sewer and a small-town water precinct make
developments more complex and expensive.
Land Use Issues
The most logical recommendation for future land use would be to limit the development in very
sensitive areas, particularly around the lake in order to protect that water quality that drives two-
thirds of Freedom’s tax base. However, Freedom’s historical development patterns led to
subdivisions before zoning was adopted in 1987 that created many small lots, particularly around
the lake. When the town adopted zoning in 1987, these small lots were “grandfathered” and can
be developed even if they do not meet current zoning acreage and road frontage requirements.
As part of the Watershed Management Plan that is geared to protecting water quality, FB
Environmental completed a “build out” analysis to use in projecting future growth and future
phosphorus loading in the watershed. The build out analysis included several steps:
1. Documented the existing buildings in town—specifically, lots with residences, which Freedom’s
“one house/one lot” policy means are already developed. (See Chart E-10)
2. Identified areas that could not be developed, e.g.; steep slopes, conservation land, floodplains,
wetlands, and hydric soils. (See Chart E-11)
3. Identified “buildable land,” lots that could be subdivided, with or without requiring a road—
creating new lots with residences (See Chart E-12)
4. Assumed 10-, 20-, and 30-year rates for future growth (ranging from 1.34% to 2.45%)
5. Calculated the increase in phosphorus in the lake and forecast the impact on water quality.
This is a model, not a firm prediction. Because the goal of the model is to find the total potential
phosphorus loading that could affect water quality, it assumes that all buildable land will be
developed. While it may assume that not all buildable land will be developed, the planning board
can use the Build Out analysis to inform its recommendations for future land use and water quality
protection measures.
21The build out analysis helps define “buildable land” and
provides some insights (See Charts E-11 and E-12).
• Some future development is more likely because of the
ease and cost of construction. For the purpose of
determining future land use, this plan will deal with likely
development.
• The rural residential district has the most “buildable land.”
Development in this area would require major
subdivisions with roads built to town specifications. This
expense is likely to constrain some development.
• Development in the general residential and shorefront
general residential is less expensive due to several
factors:
o Land is less steep and generally less rocky
o Much land in the shorefront district is sandy and easy
to excavate.
o Parcels are smaller and not all will require a road when subdividing
Therefore, these are the areas where development is more likely in the future.
Recommendations
Freedom’s future land use vision is in part based on the limitations of the land and the abundance
of natural resources located on and below the surface of the town. Since the closing of the mills,
there’s been no significant industry and little commercial activity to bring people to Freedom. Many
residents travel to work and return to a quiet, residential community or telecommute to jobs in cities
from their homes in Freedom. The boom of the 1980s is over, but Freedom still attracts people for
tourism and for second home ownership. Much of the growth of full-time residents come from
second homeowners who telecommute and/or retire in Freedom.
The key challenge facing Freedom is to use best management practices and careful and creative
regulations to manage the future of the village center, the growth of rural residential areas, and the
protection of sensitive lands in the shorefront district. Future land use will reflect the desired
developments in Freedom.
• Village residential district has little development opportunities. Consider detached accessory
dwelling units to allow more housing options.
• Offer more housing options in the general residential district to provide a broader range of
housing types and prices.
• Carefully monitor development in sensitive shorefront districts to ensure best management
practices, manage stormwater runoff into the lake, and upgrade septic systems to the extent
allowed by state law.
• Support development in the rural residential district with cluster developments. Ensure roads
are built to town specifications
22CHAPTER 5: HISTORICAL RESOURCES
Freedom has retained much of its historic character
and buildings because the main road passes by the
village. As in any old town, structures and sites
enable us to see a town’s history. They connect us
to the past, but they are fragile and can disappear
because of a single decision or action.
Freedom property owners and residents, in
responding to survey questions in 1986 when the
Master Plan was being written, and again in 2016,
when it was updated, expressed the wish that the
town maintain its rural character, and showed a
“reluctance to see change that might compromise
the aspects of town life and environmental quality
that they value.”
The mission of the Heritage Commission, formed in
2009, is to preserve and protect the Town’s historical
and cultural resources, the “built environment,” in
keeping with the stated vision of the town.
The following chapter will contain a brief history of
Freedom, a list of some of the known historical
resources in the town, what the community has done
to promote preservation and document historical
events, some challenges to preservation,
preservation goals and recommendations.
HISTORY
The present town of Freedom is in part of the Mason Grant of 1629.
• In 1632, it is said that Darby Field walked through this area on his way to Mount Washington.
• In 1749, a portion of the grant was conveyed to John Leavitt and others and was called
Leavitt’s Town.
• The first settlement is dated 1768 and the first area to be settled was called Shaw Town. By
the beginning of the American Revolution, the population was 83. Leavitt Town was
incorporated as Effingham in 1778. The remaining portion of the Ossipee Gore, which was an
unincorporated area, was annexed in 1820.
• In 1831 the part of the town north of the Ossipee River was incorporated as North Effingham,
and the following year as the Town of Freedom. The division was because those living north of
the Ossipee River had to cross a toll bridge to do business in the part of the town where the
government resided, making the river a logical boundary.
• Around 1812, five families named Harmon, Foss, Milliken, Meserve, and McDaniel came by ox-
drawn sled and settled the area around Scarboro Road. Later settlers were farmers named
Andrews, Towle, Smart, Drake and Moulton, names found in the phone book today or on street
signs or landmarks. They raised sheep and cattle, hunted, fished, logged, and trapped.
• Despite the difficulty in wresting a living from the rocky soil, the population slowly grew, and the
people prospered. In its heyday Freedom was a thriving community with a mill that turned out
bobbins, ship wedges, rakes, chairs, barrel staves and shingles. Small mills on Cold Brook that
23ran through the center of town ground wheat and corn. Oats, corn, rye, buckwheat, maple
products, honey, eggs, wood, beans and apples were shipped to Portland several times a year,
by ox cart.
• Freedom had a machine shop, a blacksmith shop, a tin smith, a millinery shop, several
groceries, and a bank. The Ossipee Valley 10 Cents Savings Bank opened in 1868, took in
deposits of $16,937.75 in its first year, and lasted for 35 years.
• Freedom had four tanneries, a sawmill, and factories which produced bedsteads, carriages,
edge tools, and harnesses. Stephen Danforth, whose pants shop still stands, was a pioneer
salesman, and his shop produced 30,000 pairs of “pantaloon,” or jeans, a year.
• In the ensuing years, religious, social, and civic groups formed, grew, and evolved. Many, such
as the First Christian Church, the Old Home Week Committee and the Community Club,
continue to thrive to this day.
• However, the character of the town changed after the Civil War when there was a general
migration westward. Surviving veterans had seen greener pastures during their service and
moved away. Some, wounded and maimed, returned but could not farm the exhausted soil,
and so communities, like Shaw Town, essentially disappeared.
• The population which had reached 917 in 1860 was only 315 in 1950. At this writing in 2017,
the year-round population is around 1,487.
(See Table F-1 for sources)
An important change occurred when, in 1939, Selectman Charlie Towle, among other leaders in
the area, successfully proposed that Route 25 be moved south of the village in Effingham. This
bypass route hurt Freedom businesses and drew fewer travelers and tourists, but it also quieted
traffic and helped protect the historic architecture of the village.
Today, agriculture in Freedom is long gone as the major part of the economy, but a few local
farmers are producing poultry, eggs, pork and beef products, which have proved popular and
successful. Maple syrup is also locally produced. Several businesses operate in the commercial
area along the updated Route 25 bypass, which was rerouted again in 1985 to avoid a residential
part of Effingham. Other business or commerce is conducted by self-employed people out of their
homes, and many people offer maintenance and building trade services.
During the early part of the 20th century, Freedom became a destination for summer boarders who
arrived by train to Center Ossipee. They stayed in guest houses at first, and then began to buy
their own homes, at first staying the summer, and then retiring to live in Freedom year-round. For
example, the Freedom Club of Boston was organized in 1900 to maintain the connection to
Freedom of those residents who had moved away, but who returned each summer. When these
residents moved back permanently when they retired, they changed the name in the 1970s to the
Freedom Club of New Hampshire, and yet again in 2010 to the Freedom Beach Club.
Freedom has an older, largely retired demographic, as have many New Hampshire communities.
The school population has been declining; with 76 students enrolled in 2016-17. The population of
retired people is increasing, and they are energetic and interested retirees, many of whom
participate and assume leadership roles in the community.
Since the fall of 2008, the sale of houses, particularly the big old houses in the village, has slowed
considerably, but at this writing (2018) there is a sellers’ market and houses are moving again.
Year-round and seasonal residents exhibit a growing awareness of the importance of preserving
and protecting the heritage of Freedom. Many citizens treasure the unique historical quality of our
village, the peacefulness of the “suburbs,” and the unspoiled environment of the lakes and
mountains and want to maintain the town’s historical character for those who follow.
24You can also read