Transcriptome-wide association study reveals increased neuronal FLT3 expression is associated with Tourette's syndrome - Nature
←
→
Page content transcription
If your browser does not render page correctly, please read the page content below
ARTICLE
                  https://doi.org/10.1038/s42003-022-03231-0                OPEN

                  Transcriptome-wide association study reveals
                  increased neuronal FLT3 expression is associated
                  with Tourette’s syndrome
                  Calwing Liao1,2,5, Veikko Vuokila2,5, Hélène Catoire2, Fulya Akçimen 1,2, Jay P. Ross                                 1,2,

                  Cynthia V. Bourassa2, Patrick A. Dion2,3, Inge A. Meijer4 & Guy A. Rouleau 1,2,3 ✉

                  Tourette’s Syndrome (TS) is a neurodevelopmental disorder that is characterized by motor
                  and phonic tics. A recent TS genome-wide association study (GWAS) identified a genome-
1234567890():,;

                  wide significant locus. However, determining the biological mechanism of GWAS signals
                  remains difficult. To characterize effects of expression quantitative trait loci (eQTLs) in TS
                  and understand biological underpinnings of the disease. Here, we conduct a TS
                  transcriptome-wide association study (TWAS) consisting of 4819 cases and 9488 controls.
                  We demonstrate that increased expression of FLT3 in the dorsolateral prefrontal cortex
                  (DLPFC) is associated with TS. We further show that there is global dysregulation of FLT3
                  across several brain regions and probabilistic causal fine-mapping of the TWAS signal
                  prioritizes FLT3 with a posterior inclusion probability of 0.849. After, we proxy the expression
                  with 100 lymphoblastoid cell lines, and demonstrate that TS cells has a 1.72 increased fold
                  change compared to controls. A phenome-wide association study also points toward FLT3
                  having links with immune-related pathways such as monocyte count. We further identify
                  several splicing events in MPHOSPH9, CSGALNACT2 and FIP1L1 associated with TS, which are
                  also implicated in immune function. This analysis of expression and splicing begins to explore
                  the biology of TS GWAS signals.

                  1 Department of Human Genetics, McGill University, Montréal, QC, Canada. 2 Montreal Neurological Institute, McGill University, Montréal, QC, Canada.
                  3 Department of Neurology and Neurosurgery, McGill University, Montréal, QC, Canada. 4 Department of Neurosciences and CHU Sainte-Justine, University
                  of Montréal, Montreal, QC, Canada. 5These authors contributed equally: Calwing Liao, Veikko Vuokila. ✉email: guy.rouleau@mcgill.ca

                  COMMUNICATIONS BIOLOGY | (2022)5:289 | https://doi.org/10.1038/s42003-022-03231-0 | www.nature.com/commsbio                                        1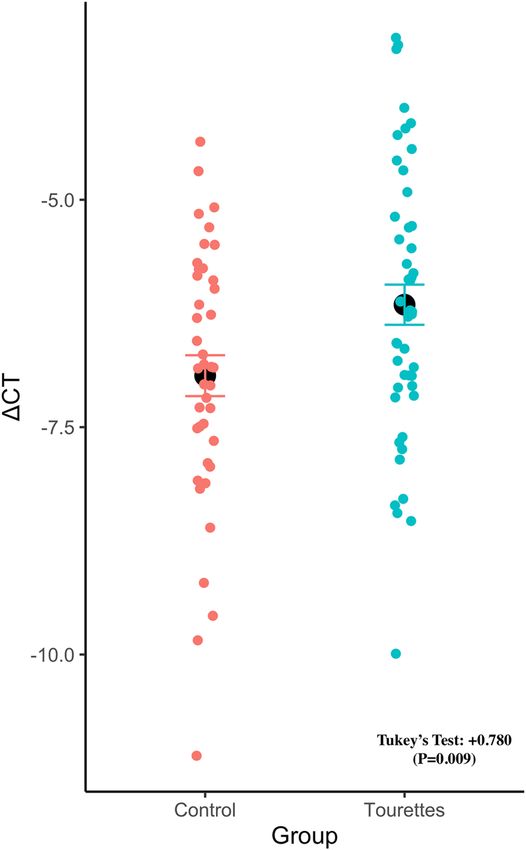
ARTICLE COMMUNICATIONS BIOLOGY | https://doi.org/10.1038/s42003-022-03231-0
T
ourette’s Syndrome (TS) is a neuropsychiatric disorder that An omnibus test using the GTEx and CMC brain tissue panels
is characterized by motor and phonic tics1. The onset of also identified the top two genes: ATP6V0A2 (P = 3.70E−05) and
the disorder is typically between the age of 5 and 7 years. NEB (P = 1.72E−04) (Table 1). Given the lower number of FDR-
TS has been shown to have a large genetic component, in which significant hits, we used a nominally significant threshold (FDR-
the first-degree relatives of TS patients have a 10–100-fold higher corrected p value < 0.10) to assess pathways. We found that
rate of TS compared to the general population2,3. Past genetic significant pathways were related to FLT3 signalling, myosin
studies of TS have identified several implicated genes such as binding, and microfilament activity (Supplementary Data 1).
CELSR3, a gene where recurrent do novo variants are found in
probands4. Furthermore, a recent genome-wide association study Splicing in Tourette’s syndrome. Given the importance of
(GWAS) identified a genome-wide significant hit on chromosome alternative splicing in neurodevelopment and brain gene
13, rs2504235, which is within the FLT3 (Fms Related Tyrosine expression, a splicing TWAS was done to identify splicing events
Kinase 3) gene5. Although GWAS is a powerful method for associated with TS. There were several significant genes after
identifying associated genetic loci, it is often difficult to interpret permutation. The top three hits were MPHOSPH9 (Z = −4.32,
the biological effects of significant hits. P = 1.58E−05), FIP1L1 (Z = 4.21, P = 2.55E−05) and CSGAL-
Recently, transcriptomic imputation was developed to allow for NACT2 (Z = 4.14, P = 3.39E−05) (Table 1). However, we also
the integration of genetic and expression data from datasets such caution on the interpretability of the effect direction given that
as the CommonMind (CMC) and Genotype-Tissue Expression alternatively spliced exons are typically negatively correlated18.
(GTEx) consortia6,7. The derivation of panels involves a machine-
learning approach to characterize the relationship between Fine-mapping of FLT3 locus. To determine whether FLT3 is the
gene expression and genotypes, making tissue-specific predictive putatively causal gene on the DLPFC, FOCUS was used to assign
models. Transcriptomic imputation can leverage these reference a probabilistic inclusion probability for genes at the TWAS
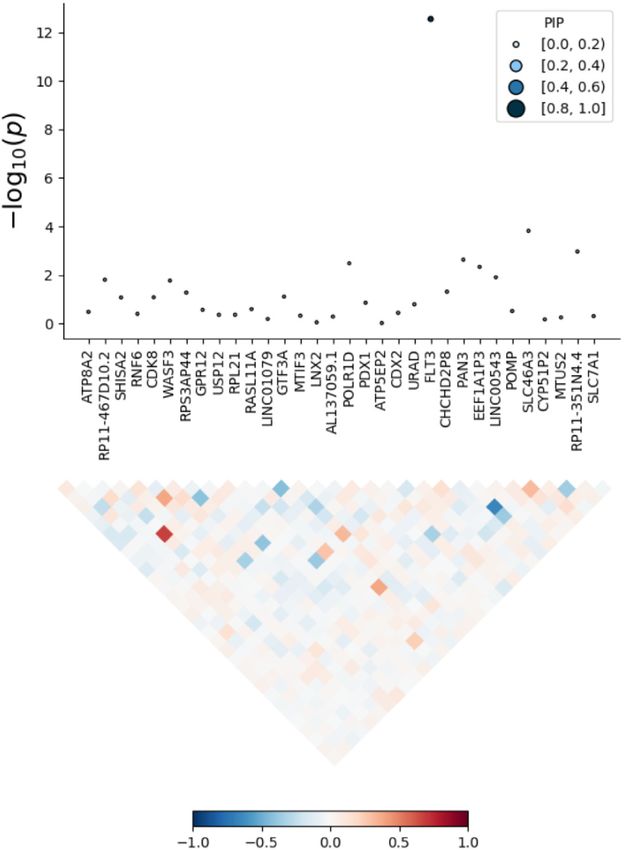
imputation panels from these consortia and identifies the genetic region19. For the region 13:27284583-13:29257379 (hg19 coor-
correlation between imputed expression and GWAS data6. Ulti- dinates), the FLT3 gene had the highest posterior inclusion
mately, transcriptomic imputation allows for better character- probability (PIP) of 0.849 and was included in the 90% credible
ization of GWAS data by prioritizing tissue-specific genes gene set (Fig. 1). The PIP is an inclusion probability (0–1), where
associated with disease8. Furthermore, imputation of aberrant a higher PIP may suggest higher chance of being potentially
splicing can be done through this method. Given that alternative causal.
splicing occurs frequently in brain tissue and in early develop-
ment, identifying potential genes with aberrant splicing could be
important for understanding the genetic etiology of brain RT-qPCR of FLT3. Given that brain tissue for TS is difficult to
disorders9,10. This methodology, known as a transcriptome-wide acquire in large sample sizes, LCL were from TS patients and
association study (TWAS), has already been used to prioritize controls were used to assess the expression of FLT3. To test
genes in a variety of different traits, such as schizophrenia, normality of qPCR data, a Shapiro–Wilk test was done. It was
depression, and ADHD6,11–14. For instance, for ADHD, a TWAS found that the ΔCT values (a measure of expression based on the
was done with adult brain tissue and found several genes difference in the number of PCR cycles required for the fluor-
including ST3GAL315. A subsequent ADHD TWAS using fetal escent signal to exceed background level) were normally dis-
brain tissue also implicated ST3GAL316. tributed (W = 0.99, P = 0.70). Next, an ANOVA was done and
To identify genetically regulated genes associated with TS, we determined that the disease status was statistically different in the
conducted a TWAS of the current largest TS cohort of 4819 cases dataset (F = 7.06, P = 0.0095). A Tukey’s test showed that TS
and 9488 controls5. Brain-specific panels were derived from the patients had significantly higher expression of FLT3 compared to
CMC and GTEx 53 v7. The TWAS revealed the expression of controls, with a ΔCT difference 0.780 (P = 0.009) (Fig. 2). The
FLT3 to be increased across many brain tissues in TS, with the corresponding fold change is +1.72 higher in TS than controls.
largest effect in the dorsolateral prefrontal cortex (DLPFC). Given The effect size was determined to be moderate-large (Cohen’s
that FLT3 is expressed in lymphoblasts, we additionally measured F, 0.30).
the RNA expression of FLT3 in 100 lymphoblastoid cell lines
(LCL;50 cases and 50 controls). Brain samples for TS are often Phenome-wide association study of FLT3. To identify pheno-
difficult to acquire and not readily available in large sample sizes, types associated with the top gene, a regional phenome-wide
which make LCL a useful source of information. Previous studies association study spanning the entire gene (pheWAS) was done
have demonstrated that ~23% of post-mortem brain tissue and for FLT3. The pheWAS identified several immunological traits
lymphoblastoid cell lines have similar expression levels17. There associated with FLT3 such as monocyte count (3.87E−40) and
was an increased expression in FLT3 in LCL derived from TS percentage of white blood cells (1.42E−21) (Fig. 3).
cases, consistent with TWAS results. In conclusion, increased
expression of FLT3 was implicated through TWAS across several Discussion
brain tissues and expression in LCL. While recent GWAS for TS have successfully identified risk loci,
the biological relevance of these associations remains unknown.
Here, we conduct a TWAS using the summary statistics of over
Results 14,000 individuals from the most recent TS GWAS5. This
Transcriptome-wide significant hits. To identify genes asso- approach allows for imputation of expression by leveraging
ciated with TS, a TWAS was conducted using FUSION. The genotype-expression reference panels. From this, we identified
strongest significant hit was FLT3, with increased expression increased FLT3 expression as the top hit in the DLPFC and
(Z = 4.67, P = 2.98E−06) in the DLPFC (Table 1). Interestingly, additionally found an increase in expression across most brain
the gene also had increased expression in the brain cortex, hip- tissue types, suggesting global dysregulation. The global dysre-
pocampus, anterior cingulate cortex, frontal cortex, cerebellum, gulation may suggest that commonly TS-implicated brain areas
and cerebellar hemispheres suggesting a global dysregulation such as the supplementary motor area could potentially have
across brain tissue types. The gene DHRS11 was also implicated FLT3 dysregulation20. Validation of expression in LCL prepared
(Z = 4.26, P = 2.01E−05), although not genome-wide significant. from TS cases found an increased or an increase in RNA
2 COMMUNICATIONS BIOLOGY | (2022)5:289 | https://doi.org/10.1038/s42003-022-03231-0 | www.nature.com/commsbioCOMMUNICATIONS BIOLOGY | https://doi.org/10.1038/s42003-022-03231-0 ARTICLE Table 1 TWAS genes with association to Tourette’s syndrome. Gene Method Tissue P value Permutation P value Z-score FLT3 Expression Dorsolateral prefrontal cortex 3.04E−06 0.00616 4.6683 FLT3 Expression Cortex 3.24E−06 0.01289 4.6551 FLT3 Expression Hippocampus 7.87E−06 0.0108 4.4688 FLT3 Expression Anterior cingulate cortex BA24 8.12E−06 0.007 4.462 FLT3 Expression Frontal cortex BA9 8.30E−06 0.0185 4.4574 FLT3 Expression Cerebellum 1.44E−05 0.011 4.3382 DHRS11 Expression Substantia nigra 2.01E−05 0.0153 4.26398 FLT3 Expression Cerebellar hemisphere 2.43E−05 0.0096 4.22163 ATP6V0A2 Omnibus – 3.70E−05 (Nominally significant) – – NEB Omnibus – 0.000172 (Nominally significant) – – MPHOSPH9 Splicing Dorsolateral prefrontal cortex 1.58E−05 0.01509 −4.317536 FIP1L1 Splicing Dorsolateral prefrontal cortex 2.55E−05 0.00184 4.21065 CSGALNACT2 Splicing Dorsolateral prefrontal cortex 3.39E−05 0.00090 4.14582 Fig. 1 Fine mapping of chromosome 13 TWAS signal. PIP is the posterior inclusion probability. TWAS p values derived from FOCUS are on the Y-axis and genes within the locus are on the X-axis. The local correlation structure is shown in the bottom half of the figure. The PIP for FLT3 was the highest. COMMUNICATIONS BIOLOGY | (2022)5:289 | https://doi.org/10.1038/s42003-022-03231-0 | www.nature.com/commsbio 3
ARTICLE                                                                COMMUNICATIONS BIOLOGY | https://doi.org/10.1038/s42003-022-03231-0

expression compared to LCL from control individuals. The FLT3                 the pheWAS pertains only to the top hit FLT3 and not the rest of
gene encodes for a tyrosine-protein kinase and it has been asso-              the genomic loci underlying TS risk. Interestingly, previous stu-
ciated with inflammation and immune function21,22. This could                  dies have demonstrated that TS patients have significantly higher
point toward immunity in TS as a putative biological mechanism.               levels of monocytes compared to healthy controls23. This could
The FLT3 gene has been shown to be related to the developmental               suggest dysregulation of monocytes partially due to increased
process of mouse brain, and its expression was markedly                       expression of FLT3, which may contribute toward pathogenicity
increased with age. Furthermore, the pheWAS identified that                    of TS. Alternatively, FLT3 could also alter neuroimmune
FLT3 is associated with immunological traits such as monocyte                 interactions, but further functional data would be needed to
count and white blood cell counts. However, we emphasize that                 investigate this. Furthermore, fine-mapping the TWAS hit
                                                                              demonstrated that FLT3 was in the 90% causal credible-set with a
                                                                              PIP of 0.849 for the DLPFC. This further stipulates that FLT3 is
                                                                              the strongest putative gene at this locus. A previous study
                                                                              investigating transcriptomic differences of the basal ganglia
                                                                              between TS and controls found an enrichment of differentially
                                                                              expressed immune-related genes, reinforcing the potential
                                                                              importance of immune-related genes in TS24.
                                                                                 The splicing TWAS identified several putatively associated
                                                                              genes (MPHOSPH9, FIP1L1, and CSGALNACT2) associated with
                                                                              TS, suggesting that both splicing, and genetically regulated genes
                                                                              are potentially implicated in TS. The MPHOSPH9 gene encodes
                                                                              for a protein that regulates cell cycling25. This gene has been
                                                                              implicated in multiple sclerosis, which is an inflammatory disease
                                                                              of the central nervous system25. In addition, FIP1L1 is associated
                                                                              with pre-mRNA 3′-end formation and has been implicated in
                                                                              immunological function by cooperating with IL-526,27. These
                                                                              findings could potentially support the hypothesis that the
                                                                              pathophysiology of TS may include or involve the immune sys-
                                                                              tem. Understanding the role of immunity in TS may elucidate
                                                                              the link between streptococcal infections and tic exacerbations
                                                                              as proposed in the pediatric autoimmune neuropsychiatric
                                                                              disorders associated with streptococcal infections (PANDAS)
                                                                              hypothesis1,28. It is also possible that these dysregulated may
                                                                              point to synaptic pruning and potentially overactive microglia
                                                                              instead of an immune response, which has been implicated in
                                                                              schizophrenia29. A previous study has also found that microglia-
                                                                              mediated neuroinflammation was found higher in the TS group
                                                                              in the bilateral caudate and bilateral lentiform nucleus and
                                                                              bilateral caudate nuclei compared to controls30. The CSGAL-
                                                                              NACT2 gene encodes for chondroitin sulfate protein, which is
Fig. 2 FLT3 RNA Expression differences between Tourette’s Syndrome            involved in the brain extracellular matrix31. A previous meta-
patients and controls in lymphoblastoid cell lines (LCL). TS LCL had          analysis of ADHD and TS showed implication of sulfuration of
higher expression of FLT3 compared to controls after adjusting for plate,     chondroitin, suggesting potential relevance32. These results build
sex, and age. The black dot represents the mean of the data and error bars    upon the GWAS study by suggesting that FLT3 expression may
are ±SE.                                                                      be overexpressed in TS and identifying putative splicing gene

Fig. 3 Regional phenome-wide association study (pheWAS) of FLT3 for 2977 unique traits. Each point represents a trait. Only traits with an association
(P < 0.05) were included for the plot.

4                           COMMUNICATIONS BIOLOGY | (2022)5:289 | https://doi.org/10.1038/s42003-022-03231-0 | www.nature.com/commsbio
COMMUNICATIONS BIOLOGY | https://doi.org/10.1038/s42003-022-03231-0 ARTICLE
targets to further investigate. Given the high degree of splicing in associated with FLT3. Only publicly available GWAS summary statistics were
brain tissue, this area may prove fruitful for identifying novel included in the GWASAtlas database. Any GWAS based on immune-chip
sequencing, whole-exome sequencing or replicable cohorts were excluded. At the
gene targets9. time, there were 2977 unique traits and the Bonferroni-corrected threshold was set
We conclude this study with some strengths, caveats and at 1.68E−5 (0.05/2977).
potential future directions. Strengths of TWAS include trying to
unravel the biological relevance behind GWAS signals and identify Lymphoblastoid cell lines. Tourette’s patients were recruited at the TS clinic at the
gene targets for functional follow-up. Here, we were able to Montreal General Hospital and theAllen Memorial Institute. The family members
investigate the directional effects of FLT3 and prioritize the gene were interviewed by a group consisting of a psychiatrist, neuropsychologist, and
neurologist. Symptoms were evaluated with semi-structured interviews using
over others within the same GWAS locus. For limitations, TWAS standardized scales. All Tourette’s patients had definite TS based on the DSM-IV
signals can putatively be confounded due to expression imputation and the TS Classification Study Group. Severity of tics was evaluated using the Yale
from weighted linear combinations of SNPs. Because of this, some Global Tic Severity Scale. Patients were excluded if there was evidence of another
of these SNPs may be associated with non-regulatory mechanisms neurological disorder that could mimic TS, or if they had neuroleptic-induced
that inflate the test statistic. A second caveat is that there is cur- tardive dyskinesia, or tics secondary to head injury or drug abuse. Lymphoblastoid
cell lines were prepared from consenting individuals. The study was approved by
rently no available replication cohort, given that the largest GWAS the institutional review board of McGill University (IRB00010120) and informed
for TS was used for this study. Future work could look at inte- consent was obtained from patients. A total of 100 LCL (50 controls and 50 cases)
grating single-cell sequencing data with TS GWAS to determine were randomly selected. Cells derived from TS patients and controls were grown at
single-cell cis-eQTL regulated genes. Furthermore, individual 37 °C and cells were cultured for ~1 week prior to RNA extraction. Control LCL
were selected if there is no clinical reporting of TS or any other psychiatric dis-
TWAS risk could be investigated in independent cohorts. A third order. Similar ages and sex were chosen to match the TS samples.
caveat is that a given gene may be influenced by genetic regulators
independent of cis-eQTLs and sQTLs but still have downstream RNA extraction. RNA was extracted from the cells using the Qiagen RNAeasy
effect on TS. Finally, the use of GWASAtlas for the pheWAS can Mini Kit. The RNA was subsequently stored in −80 °C after elution with RNAse-
present potential selection bias on which traits get included, free water. One microgram of each sample of RNA was converted into cDNA using
however, it was used since it can be readily used by any investi- the SuperScript VILO cDNA Synthesis Kit by Thermo Fisher Scientific.
gators as more phenotypes get added. In conclusion, we identify
the FLT3 gene as likely involved in TS with increased expression Reverse-transcriptase quantitative qPCR. The cDNA was used to perform a
Taqman qPCR using QuantStudio 7. The FLT3 probe (Accession number:
found by TWAS and in lymphoblastoid cell lines of patients. We Hs00174690_m1) was used, and POLR2A (polymerase [RNA] II [DNA-directed]
further identify several significant genes associated with aberrant polypeptide) (Accession number: Hs00172187_m1) was used as the endogenous
splicing and point toward immunity in the pathogenesis of TS. control. The thermocyler parameters consisted of the following: 2 min at 95 °C, and
40 cycles of 95 °C for 1 s and 60 °C for 20 s. The qPCR was performed in triplicate.
The cycling parameters were A Shapiro–Wilk Test was done to determine the
Methods normality of the mean CT values data. Mean CT values were derived from aver-
Genotyping data. Public summary statistics were obtained from the Psychiatric aging the triplicate CT values. An ANOVA was done using the model mean CT
Genetics Consortium through the OCD & Tourette Syndrome group. Briefly, the values ~ sex + plate + disease status + disease status:sex). Mean CT values were
summary statistics consists of a case-control GWAS for TS. Population stratifica- derived from averaging the triplicate CT values. Cohen’s F was used to determine
tion was accounted for through multidimensional scaling, and European indivi- the effect size of the data.
duals were retained. Imputation was done using the 1000 Genomes phase 1
haplotypes. Meta-analysis of different cohorts for the GWAS was done using an
Reporting summary. Further information on research design is available in the Nature
inverse variance model. Further details on the participant ascertainment and
Research Reporting Summary linked to this article.
quality control steps are previously described in the 2019 TS GWAS5. The sum-
mary statistics were munged using LDSC and were used as the input for the
subsequent transcriptomic imputation33. Data availability
All other data are contained within the article or its supplementary data (Supplementary
Data 2 and 3) and available upon reasonable request. Supplementary Data 2 and 3
Transcriptomic imputation. Imputation was done by using reference panels from
FUSION that were derived from consortia datasets of tissue-specific gene expression contain the TWAS summary statistics from Table 1. Source data to generate Figs. 1–3 can
integrated with genotypic data. The CommonMind Consortium (CMC) and brain be found in Supplementary Data 4. The TS GWAS summary statistics can be accessed
tissue panels from GTEx 53 v7 were used for a total of 14 tissue types and panels. To freely from the Psychiatric Genomics Consortium at https://www.med.unc.edu/pgc/
account for multiple hypothesis testing, P values were adjusted for false-discovery download-results/ (data https://doi.org/10.6084/m9.figshare.14672232)5.
rate (FDR). FUSION was used to conduct the transcriptome-wide association testing
and features that capture a significant heritability were used. The 1000 Genomes v3 Code availability
LD panel was used for the TWAS. FUSION utilizes several penalized linear models, Code is available from the corresponding author upon reasonable request.
such as GBLUP, LASSO, Elastic Net. In addition, a Bayesian sparse linear mixed
model is used. FUSION computes an out-sample R2 to determine the best model by
performing a fivefold cross-validating of every model. After, a multiple degree-of- Received: 27 February 2021; Accepted: 7 March 2022;
freedom omnibus test was done to test for effect in multiple reference panels. The
threshold for the omnibus test was P = 4.64E−06 (0.05/10,323 [number of genes
tested]). Next, we sought to assess splicing events associated with TS. Splicing ana-
lysis was done using the CMC splicing imputation panel obtained from FUSION,
following the same methods as described earlier, and an FDR p value < 0.05 was
considered significant.
References
1. Müller, N. Tourette’s syndrome: clinical features, pathophysiology, and
Fine-mapping of TWAS associations. To address the issue of co-regulation and therapeutic approaches. Dialogues Clin. Neurosci. 9, 161–171 (2007).
LD, we used FOCUS (Fine-mapping of causal gene sets) to model predicted 2. O’Rourke, J. A., Scharf, J. M., Yu, D. & Pauls, D. L. The genetics of Tourette
expression correlations and to assign a posterior probability for causality in rele- syndrome: a review. J. Psychosom. Res. 67, 533–545 (2009).
vant tissue types19. Briefly, FOCUS prioritizes genes for each TWAS hit to be 3. Chowdhury, U. & Heyman, I. Tourette’s syndrome in children. Br. Med. J.
included in a 90%-credible set while accounting for pleiotropic SNP effects. The 329, 1356–1357 (2004).
identical TWAS reference panels for FUSION were used as in the analysis 4. Wang, S. et al. De Novo Sequence and Copy Number Variants Are Strongly
described above. Associated with Tourette Disorder and Implicate Cell Polarity in Pathogenesis.
Cell Rep. 24, 3441–3454.e12 (2018).
5. Yu, D. et al. Interrogating the Genetic Determinants of Tourette’s Syndrome
Phenome-wide association studies. To identify phenotypes associated with
and Other Tic Disorders Through Genome-Wide Association Studies. Am. J.
FLT3, a phenome-wide association study (pheWAS) was done. PheWAS was done
Psychiatry 176, 217–227 (2019).
using public data provided by GWASAtlas (https://atlas.ctglab.nl)34. Briefly, the
6. Gusev, A. et al. Integrative approaches for large-scale transcriptome-wide
pheWAS seeks to identify traits that are associated with FLT3 by querying many
different GWAS traits. This method seeks to prioritize phenotypes that may be association studies. Nat. Genet. 48, 245–252 (2016).
COMMUNICATIONS BIOLOGY | (2022)5:289 | https://doi.org/10.1038/s42003-022-03231-0 | www.nature.com/commsbio 5ARTICLE COMMUNICATIONS BIOLOGY | https://doi.org/10.1038/s42003-022-03231-0
7. Consortium, Gte. Genetic effects on gene expression across human tissues. disorders associated with streptococcal infection and tourette syndrome: a
Nature 550, 204–213 (2017). positron emission tomographic (PET) study using 11C-[R]-PK11195. J. Child
8. Wainberg, M. et al. Opportunities and challenges for transcriptome-wide Neurol. 30, 749–756 (2015).
association studies. Nat. Genet. 51, 592–599 (2019). 31. Sato, T. et al. Differential roles of two N-acetylgalactosaminyltransferases,
9. Raj, B. & Blencowe, B. J. Alternative splicing in the mammalian nervous CSGalNAcT-1, and a novel enzyme, CSGalNAcT-2. Initiation and elongation
system: recent insights into mechanisms and functional roles. Neuron 87, in synthesis of chondroitin sulfate. J. Biol. Chem. 278, 3063–3071 (2003).
14–27 (2015). 32. Tsetsos, F. et al. Meta-Analysis of Tourette Syndrome and Attention Deficit
10. Su, C. H., Dhananjaya, D. & Tarn, W. Y. Alternative splicing in neurogenesis Hyperactivity Disorder Provides Support for a Shared Genetic Basis. Front.
and brain development. Front. Mol Biosci. 5, 12 (2018). Neurosci. 10, 340 (2016).
11. Mancuso, N. et al. Large-scale transcriptome-wide association study identifies 33. Bulik-Sullivan, B. K. et al. LD Score regression distinguishes confounding
new prostate cancer risk regions. Nat. Commun. 9, 1–11 (2018). from polygenicity in genome-wide association studies. Nat. Genet. 47,
12. Huckins, L. M. et al. Gene expression imputation across multiple brain regions 291–295 (2015).
provides insights into schizophrenia risk. Nat. Genet. 51, 659–674 (2019). 34. Watanabe, K. et al. A global view of pleiotropy and genetic architecture in
13. Liao, C. et al. Multi-tissue probabilistic fine-mapping of transcriptome-wide complex traits. bioRxiv 500090 https://doi.org/10.1101/500090 (2018).
association study identifies cis-regulated genes for miserableness. bioRxiv 1–30
https://doi.org/10.1101/682633 (2019).
14. Wray, N. R. et al. Genome-wide association analyses identify 44 risk variants Acknowledgements
and refine the genetic architecture of major depression. Nat. Genet. 50, We would like to acknowledge the Psychiatric Genetics Consortium for the aggregation
668–681 (2018). and release of summary statistics. We would like to thank any patients for participating
15. Liao, C. et al. Transcriptome-wide association study of attention deficit in our studies. C.L. would like to dedicate this paper to Emily B. for inspiring him to
hyperactivity disorder identifies associated genes and phenotypes. Nat. study Tourette’s Syndrome. Funding came from the Canadian Institutes of Health
Commun. 10, 1–7 (2019). Research.
16. Hall, L. S. et al. Cis-effects on gene expression in the human prenatal brain
associated with genetic risk for neuropsychiatric disorders. Mol. Psychiatry Author contributions
1–7 https://doi.org/10.1038/s41380-020-0743-3 (2020). C.L. performed analyses and drafted the paper. V.V. H.C., and C.V.B. helped with
17. Rollins, B., Martin, M. V., Morgan, L. & Vawter, M. P. Analysis of whole molecular work. F.A., I.A.M., and J.P.R. provided scientific input. P.A.D. and G.A.R.
genome biomarker expression in blood and brain. Am. J. Med. Genet., Part B: oversaw the paper.
Neuropsychiatr. Genet. 153, 919–936 (2010).
18. Gusev, A. et al. Transcriptome-wide association study of schizophrenia and
chromatin activity yields mechanistic disease insights. Nat. Genet. 50, 538–548 Competing interests
(2018). The authors declare no competing interests.
19. Mancuso, N. et al. Probabilistic fine-mapping of transcriptome-wide
association studies. Nat. Genet. 51, 675–682 (2019).
20. Tübing, J. et al. Associative plasticity in supplementary motor area - motor
Additional information
Supplementary information The online version contains supplementary material
cortex pathways in Tourette syndrome. Sci. Rep. 8, 1–8 (2018).
available at https://doi.org/10.1038/s42003-022-03231-0.
21. Whartenby, K. A., Small, D. & Calabresi, P. A. FLT3 inhibitors for the
treatment of autoimmune disease. Expert Opin. Investig. Drugs 17, 1685–1692
Correspondence and requests for materials should be addressed to Guy A. Rouleau.
(2008).
22. van Galen, P. et al. Single-Cell RNA-Seq Reveals AML Hierarchies Relevant to
Peer review information Communications Biology thanks Paweł Wołkow and the other
Disease Progression and Immunity. Cell https://doi.org/10.1016/
anonymous, reviewers for their contribution to the peer review of this work. Primary
J.CELL.2019.01.031 (2019).
Handling Editors: Hélène Choquet and George Inglis.
23. Matz, J. et al. Altered monocyte activation markers in Tourette’s syndrome: a
case–control study. BMC Psychiatry 12, 29 (2012).
Reprints and permission information is available at http://www.nature.com/reprints
24. Lennington, J. B. et al. Transcriptome Analysis of the Human Striatum in
Tourette Syndrome. Biol. Psychiatry 79, 372–382 (2016). Publisher’s note Springer Nature remains neutral with regard to jurisdictional claims in
25. International Multiple Sclerosis Genetics Conssortium (IMSGC). IL12A, published maps and institutional affiliations.
MPHOSPH9/CDK2AP1 and RGS1 are novel multiple sclerosis susceptibility
loci. Genes Immun. 11, 397–405 (2010).
26. Yamada, Y., Cancelas, J. A., Williams, D. A. & Rothenberg, M. E. IL-5 and the
FIP1L1/PDGFRA Fusion Gene Cooperatively Promote Eosinophil Open Access This article is licensed under a Creative Commons
Development, Activation, and Signal Transduction. J. Allergy Clin. Immunol. Attribution 4.0 International License, which permits use, sharing,
119, S214 (2007). adaptation, distribution and reproduction in any medium or format, as long as you give
27. Gendreau, K. L., Unruh, B. A., Zhou, C. & Kojima, S. Identification and appropriate credit to the original author(s) and the source, provide a link to the Creative
characterization of transcripts regulated by circadian alternative polyadenylation Commons license, and indicate if changes were made. The images or other third party
in mouse liver. G3: Genes Genom. Genet. 8, 3539–3548 (2018). material in this article are included in the article’s Creative Commons license, unless
28. Kurlan, R. Tourette’s syndrome and “PANDAS” Will the relation bear out? indicated otherwise in a credit line to the material. If material is not included in the
Pediatric autoimmune neuropsychiatric disorders associated with article’s Creative Commons license and your intended use is not permitted by statutory
streptococcal infection. Neurology 50, 1530–1534 (1998). regulation or exceeds the permitted use, you will need to obtain permission directly from
29. Sellgren, C. M. et al. Increased synapse elimination by microglia in the copyright holder. To view a copy of this license, visit http://creativecommons.org/
schizophrenia patient-derived models of synaptic pruning. Nat. Neurosci. 22, licenses/by/4.0/.
374–385 (2019).
30. Kumar, A., Williams, M. T. & Chugani, H. T. Evaluation of basal ganglia and
thalamic inflammation in children with pediatric autoimmune neuropsychiatric © The Author(s) 2022
6 COMMUNICATIONS BIOLOGY | (2022)5:289 | https://doi.org/10.1038/s42003-022-03231-0 | www.nature.com/commsbioYou can also read