Comparison of Long Non-Coding RNA Expression Profiles of Cattle and Buffalo Differing in Muscle Characteristics - Frontiers
←
→
Page content transcription
If your browser does not render page correctly, please read the page content below
ORIGINAL RESEARCH
                                                                                                                                             published: 26 February 2020
                                                                                                                                          doi: 10.3389/fgene.2020.00098

                                              Comparison of Long Non-Coding
                                              RNA Expression Profiles of Cattle
                                              and Buffalo Differing in Muscle
                                              Characteristics
                                              Hui Li 1†, Kongwei Huang 1†, Pengcheng Wang 1, Tong Feng 1,2, Deshun Shi 1,
                                              Kuiqing Cui 1, Chan Luo 1, Laiba Shafique 1, Qian Qian 2, Jue Ruan 2 and Qingyou Liu 1,2*
                                              1State Key Laboratory for Conservation and Utilization of Subtropical Agro-Bioresources, Guangxi University, Nanning,
                                              China, 2 Agricultural Genomics Institute at Shenzhen, Chinese Academy of Agricultural Sciences, Shenzhen, China

                                              Buffalo meat consist good qualitative characteristics as it contains “thined tender” which is
                                              favorable for cardavascular system. However, the regulatory mechanisms of long non-coding
                           Edited by:         RNA (lncRNA), differences in meat quality are not well known. The chemical-physical
                  Göran Andersson,            parameters revealed the muscle quality of buffalo that can be equivalent of cattle, but there
     Swedish University of Agricultural
                  Sciences, Sweden
                                              are significant differences in shearing force and muscle fiber structure. Then, we examined
                        Reviewed by:
                                              lncRNA expression profiles of buffalo and cattle skeletal muscle that provide first insights into
                      Xiangdong Ding,         their potential roles in buffalo myogenesis. Here, we profiled the expression of lncRNA in cattle
   China Agricultural University (CAU),       and buffalo skeletal muscle tissues, and 16,236 lncRNA candidates were detected with 865
                                  China
                          Shaojun Liu,        up-regulated lncRNAs and 1,296 down-regulated lncRNAs when comparing buffalo to cattle
            Hunan Normal University,          muscle tissue. We constructed coexpression and ceRNA networks, and found lncRNA
                                  China
                                              MSTRG.48330.7, MSTRG.30030.4, and MSTRG.203788.46 could be as competitive
                    *Correspondence:
                           Qingyou Liu
                                              endogenous RNA (ceRNA) containing potential binding sites for miR-1/206 and miR-133a.
                qyliu-gene@gxu.edu.cn         Tissue expression analysis showed that MSTRG.48330.7, MSTRG.30030.4, and
     †
      These authors have contributed          MSTRG.203788.46 were highly and specifically expressed in muscle tissue. Present study
                 equally to this work         may be used as a reference tool for starting point investigations into the roles played by several
                                              of those lncRNAs during buffalo myogenesis.
                    Specialty section:
          This article was submitted to       Keywords: buffalo, cattle, RNA-seq, lncRNA, myogenesis
                   Livestock Genomics,
                a section of the journal
                   Frontiers in Genetics

           Received: 17 August 2019           INTRODUCTION
          Accepted: 29 January 2020
         Published: 26 February 2020          As a form of striated muscle tissue, skeletal muscle is an important object in the study of meat
                              Citation:
                                              quality and plays key roles in regulating homeostasis and metabolism, accounting for 40–60% of the
Li H, Huang K, Wang P, Feng T, Shi D,         animal body (Li et al., 2018b). Skeletal muscle developmental inability via perantes lead to
    Cui K, Luo C, Shafique L, Qian Q,          embryonic death, while the failure to repair or maintain skeletal muscle after birth that can lead
Ruan J and Liu Q (2020) Comparison            to a decline in quality of life and even death. Myogenic progenitor cells from multi-potent
of Long Non-Coding RNA Expression             mesodermal precursor cells are committed to the muscle fate, and express Pax3 and Pax7
Profiles of Cattle and Buffalo Differing in
                Muscle Characteristics.
                   Front. Genet. 11:98.       Abbreviations: CeRNA, competing endogenous RNA, miRNA, microRNA; lncRNA, long non-coding RNA; qRT-PCR, real-
       doi: 10.3389/fgene.2020.00098          time quantitative PCR.

Frontiers in Genetics | www.frontiersin.org                                          1                                           February 2020 | Volume 11 | Article 98
Li et al.                                                                                                     Difference in lncRNA Expression Profiles

destined to become myoblasts (Buckingham and Relaix, 2015).                 verified by Quantitative PCR(qPCR). We further constructed
Then, myoblasts experience proliferation, differentiation and               coexpression and ceRNA networks to select candidate lncRNA.
fuse into myotubes through the regulation of myogenic                       Our research will be beneficial for the improvement of Chinese
regulatory factors: MyoD, MRF4, Myf5, and myogenin play                     meat buffalo breeding and provide new insights into the genetic
key roles in the process of regeneration in adult muscle                    mechanism of Chinese swamp meat.
(Hernandez-Hernandez et al., 2017). In fact, various non-
coding RNAs (ncRNAs) have been identified and
demonstrated to regulate myogenesis and muscle regeneration
including microRNAs (miRNAs) and long non-coding RNAs
                                                                            MATERIALS AND METHODS
(lncRNAs) (Li et al., 2018b). MiRNAs profoundly influenced the               Sample Preparation
physiology and pathology of skeletal muscle, such as miR-1 and              Chinese swamp buffalo (n = 3, 12 months old) and Guangxi
miR-133 in vitro and in vivo have distinct roles in regulating              native cattle (n = 3, 12 months old) under the same feeding and
skeletal muscle proliferation and differentiation (Li et al., 2018a).       management were obtained from SIYE husbandry of Guangxi,
    LncRNAs have played versatile roles in regulating skeletal              China. The longissimus dorsalis muscle of adult buffalo and
myogenesis and regeneration at multiple levels (Kallen et al., 2013;        cattle were used for muscle quality analysis, transcriptome
McHugh et al., 2015; Munschauer et al., 2018; Neumann et al., 2018).        sequencing and qPCR analysis. The 4 months old buffalo and
LncRNAs are well known for their involvement in transcriptional/            cattle fetal with a body length of 15 cm were selected from the
epigenetic regulation on chromatins through interacting with                local slaughterhouse in Nanning. Buffalo and cattle fetal tissues
chromatin regulators, for example, acting as “molecular scaffold”           (skin, heart, liver, spleen, lung, kidney, small intestine, leg
or decoys to activate or repress transcription (Caretti et al., 2006;       muscle, and longissimus dorsalis muscle) were used to extract
Korostowski et al., 2012). Other unique mechanisms have been                RNA and analyze the expression of lncRNAs.
found to explain the diverse modes of lncRNA action in myogenesis
(Han et al., 2014; Zhou et al., 2015). For example, lncRNA could act
as competing endogenous RNAs (ceRNAs) to sequester miRNAs
                                                                            Meat Quality Evaluation
                                                                            The longissimus thoracis muscles were taken between the 12th
from their target mRNAs (Cesana et al., 2011; Kallen et al., 2013).
                                                                            and 14th ribs from the left side of body, and performed the
Some transcribed from antisense strand of protein coding genes
                                                                            following analyses in triplicate: the pH was immediately
could directly pair with the mRNA to modulate coding gene
                                                                            measured using a pH meter (Thermo Orion, Hudson, NH,
translation (Wang et al., 2013; Wang et al., 2016). Interestingly,
                                                                            USA); water content was determined on drying at 100°C for 24
Emerging research has shown that some lncRNAs could translate
                                                                            h; crude fat level was assessed by extracting for 12 h using
micropeptides (10 years old)
period is eaten and therefore seemed tougher than beef (Sakaridis
et al., 2013; Zhang et al., 2016). Compared to beef, buffalo meat           Library Preparation
indeed has less fat, lower calories, and less cholesterol, which is         Total RNA of longissimus muscle was extracted and assessed by
healthier and can confer significant cardiovascular benefits.                 electrophoresis and quantified by NanoDrop spectrophotometer
“Buffalo meat is an amazing cure for diabetes” as is described in           (NanoDrop, Wlinington, USA). Ribosomal RNA was removed
the Compendium of Materia Medica, which was considered to be                by probe, and then the remaining RNA was used for library
the most comprehensive and complete medical work in the history             construction and sequencing (Ribo-Zero RNA-seq). cDNA
of Chinese medicine. Here, the longissimus dorsi muscles of                 library preparation and Illumina sequencing analysis were
swamp buffaloes and Guangxi native cattle under the same                    perofrmed as previous studies (Hui et al., 2018).
feeding and management were selected, and analyzed its
differences in physiological biochemical indexes. The histological          lncRNAs Identification
staining and analytical chemistry methods were used to directly             Potential lncRNAs were filtered through the following highly
compare the differences in pH, water content, shear force,                  stringent criterion: (1) transcript length is not less than 200 nt;
intramuscular fat content, ash content, and myofiber structure.              (2) transcript expression is more than 3 reads; (3) the transcripts
    In the second part, the Ribo-Free RNA-seq method was                    were annotated as “i”, “j”, “o”, “u”, and “x” according to the
selected to analyze the expression of lncRNA in longissimus                 cuffcompare classes; (4) the coding potential calculator (CPC)
dorsi muscles of swamp buffaloes and Guangxi native cattle.                 score less than -1, and coding-non-coding-index (CNCI) score
Differentially expressed genes and lncRNAs were identified in                less than 0 were kept; (5) the transcripts containing open reading
skeletal muscle samples, and the candidate lncRNAs were                     frame (ORF) is greater than 100 aa were removed; (6) via

Frontiers in Genetics | www.frontiersin.org                             2                                    February 2020 | Volume 11 | Article 98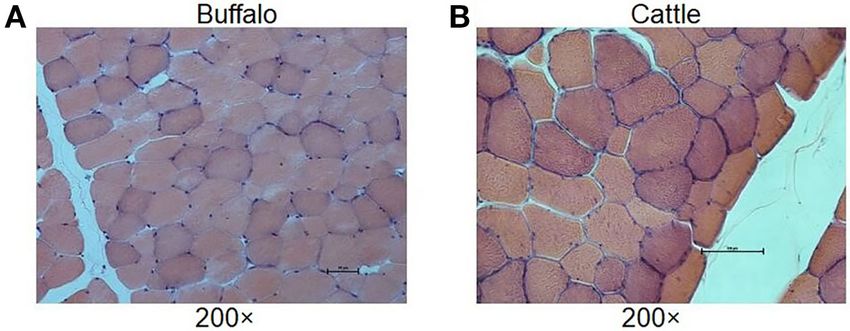
Li et al. Difference in lncRNA Expression Profiles
aligning to the Swiss-Protein, Cpat, and Pfam database, the TABLE 2 | Histological analysis of longissimus dorsi muscle samples.
transcripts were removed with known protein-coding domain. Buffalo (n = 20) Cattle (n = 20)
Gene Ontology and KEGG Pathway Muscle fiber area (mm )2
2947.10 ± 60.97 6325.94 ± 89.71*
Isometric diameter (mm) 60.97 ± 6.08 90.15 ± 3.15*
Analysis Circumference (mm) 211.89 ± 27.97 310.93 ± 15.01*
Gene Ontology (http://www.geneontology.org) and KEGG Density (1.0 × 10³/mm2) 6.79 3.16*
pathway (http://www.kegg.jp) were analyzed as previous study
*Significant at P < 0.05. The two breeds were compared at the same time point.
(Hui et al., 2018).
Coexpression Analysis Furthermore, the amino acid composition of muscle samples was
As a cis-regulator, lncRNA could regulate the expression of also analyzed, and showed no difference in the ratio of essential
adjacent genes. The coexpression network of the candidate amino acids or umami amino acids (P > 0.05), suggesting that
lncRNAs and their upstream or downstream 10 kb mRNAs under the same feeding and management conditions, the longest
was constructed. The connectivity and enrichment were dorsal muscle of buffalo and cattle are basically similar in amino
performed due to Position Frequency Matrix. acid composition (Table 3). These results revealed that under the
same feeding and management, the muscle quality of buffalo can
CeRNA Network Analysis be equivalent to that of cattle, but there are significant differences
According to the CeRNA theory, a lncRNA-miRNA-mRNA in shearing force and muscle fiber structure. Therefore, whole
network was constructed. The predictedinteractions of transcriptome RNA-Seq was performed to analyze the
miRNA-mRNA and miRNA-lncRNA were analyzed by differences of buffalo and cattle musculus longissimus.
RNAhybrid (https://bibiserv.cebitec.uni-bielefeld.de/rnahybrid)
and TargetScan (http://www.targetscan.org/). Ribo-Zero RNA-Seq of Buffalo and Cattle
Muscle
Quantitative Real-Time PCR (qRT-PCR) Three longissimus muscle samples were selected to perform
Total RNA were extracted using Trizol reagent (TaKaRa, Dalian,
Ribo-Zero RNA-Seq from cattle and buffalo at 12 M old,
China), and reverse transcription was performed by HiScript R II
respectively. As shown in Figure 2A, a large number of
One Step RT-PCR kit (Vazyme, Nanjing, China). qRT-PCR was
lncRNAs were identified. On average, 83~137 and 116~131
performed with ChamQ SYBR qPCR Master Mix (Vazyme,
million unique mapped clean reads were acquired from the
Nanjing, China) with the internal control of b-actin using 2-
DDCt buffalo and cattle libraries, respectively (Table 4). We found
method. All primers sequences were showed in Table S1.
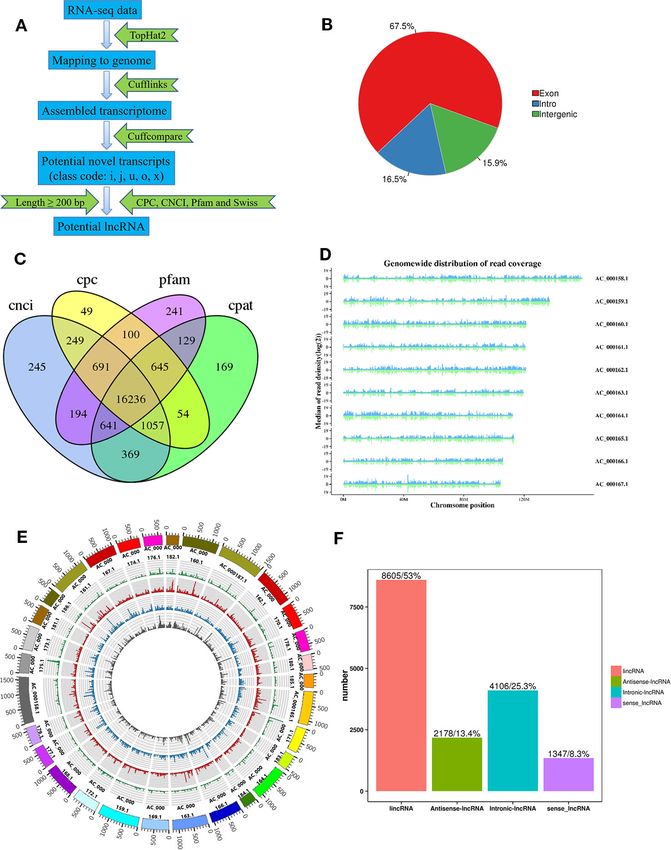
67.5% of the reads located in exon regions, while a significant
reduction was observed in intergenic or intronic regions (32.5%;
Figure 2B). Novel reliable lncRNAs were filtered by using Pfam
RESULTS and Cpat database and tested by CPC and CNCI, and a total of
16,236 potential lncRNA transcripts were identified to be
Comparison of Meat Quality
expressed (Figure 2C, Table S2). We found chromosome with
In order to understand the difference of meat quality between
longer length to be more likely to produce more lncRNAs,
buffalo and cattle, we analyzed the physiological and biochemical
indicating that the number of reads distributed in the
indexes of their longissimus dorsi samples. According to the
chromosome increased with chromosome length (Figure 2D,
indexes, significant differences were found in shear force between
E). According to the Cuffcompare classes, the lncRNAs aligned
buffalo and cattle (P < 0.05), while no significant differences were
to intergenic regions (u) accounted for the largest proportion
found in pH, water content, intramuscular fat content and ash
(8,605, 53%; Figure 2F).
content (P > 0.05; Table 1). Moreover, the muscle samples were
made into frozen sections and observed with HE staining by
microscopy, and showed that the muscle fiber area, isometric
Genomic Features of Identified LncRNAs
As shown in Figure 3A, B, the identified lncRNAs showed a low
diameter, circumference and density of buffalo were significantly
expression level, and the mean expression levels were 5.96
smaller than those of cattle (P < 0.05; Table 2 and Figure 1).
(FPKM). As illustrated in Figure 3C, the lncRNA data showed
a good correlation between buffalo and cattle muscle samples.
TABLE 1 | Phenotypic parameters measured in longissimus dorsi samples.
2,161 lncRNAs were significantly (P < 0.05) differently expressed
in buffalo and cattle muscle samples (Figure 3D), and were listed
Buffalo (n = 3) Cattle (n = 3) in Table S3. Among all the differentially expressed lncRNAs,
pH 6.54 ± 0.17 6.5 ± 0.21
MSTRG.233222.1 and MSTRG.104517.1 showed the highest
Shear force (N/cm) 32.90 ± 1.16 28.22 ± 0.76* expression level of all up-regulated and down-regulated
Water content (%) 77.34 ± 1.87 76.26 ± 2.67 lncRNAs when comparing buffalo to cattle muscle tissue,
Intramuscular fat content (%) 2.15 ± 0.91 1.84 ± 0.62 respectively. To better understand potential functions of
Ash (g/100 g) 1.03 ± 0.06 1.03 ± 0.7
lncRNA, the scatter plot and volcano plot were displayed in
*Significant at P < 0.05. The two breeds were compared at the same time point. Figures 3G–I. There were 865 lncRNAs were up-regulated, while
Frontiers in Genetics | www.frontiersin.org 3 February 2020 | Volume 11 | Article 98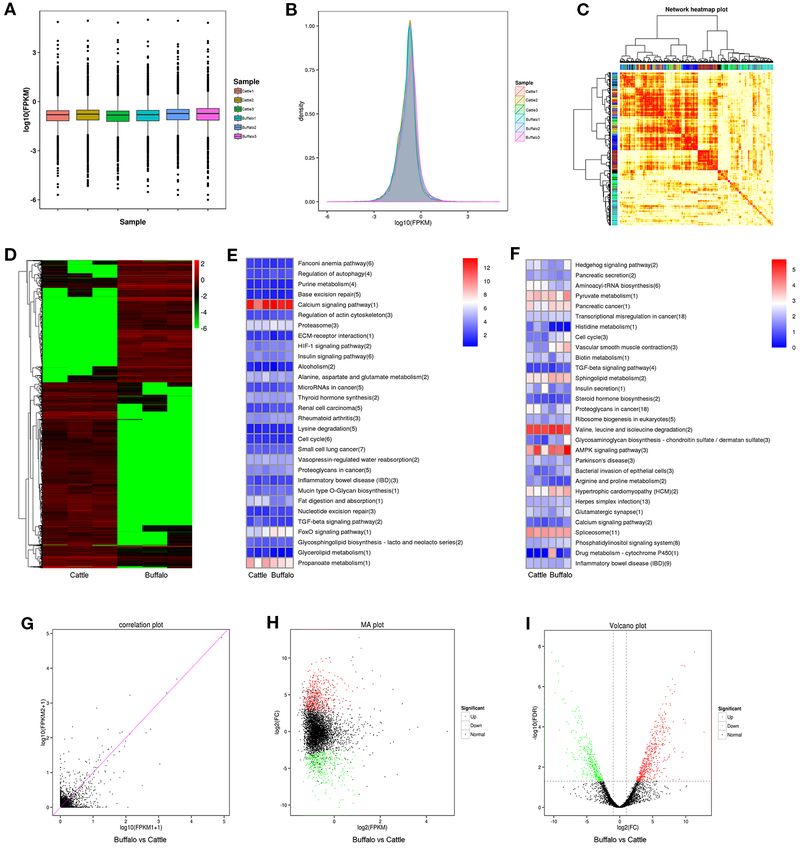
Li et al.                                                                                                                      Difference in lncRNA Expression Profiles

  FIGURE 1 | Histological analysis of longissimus dorsi muscles. The HE staining of muscle results showed that the muscle fiber area, isometric diameter,
  circumference and density of buffalo (A) were significantly smaller than those of cattle (B).

TABLE 3 | Amino acid analysis results of longissimus dorsi muscle sample.
                                                                                           Previous study has shown that lncRNA is shorter in length
Amino acid                                                   Breeds                    than protein-encoded transcripts. As illustrated in Figure 4A,
                                                                                       the mean length of lncRNAs (1,087 nucleotides) was shorter than
                                              Buffalo (n = 3)     Cattle (n = 3)
                                                                                       that of the mRNA (1,153 nucleotides). The average ORF length
Asp (g/100 g)                                  1.81 ± 0.02         1.78 ± 0.10         of lncRNA was 66.7 nt, and the mRNA was 309.7 nt, revealing
Thr (g/100 g)                                  0.89 ± 0.02         0.91 ± 0.02         that lncRNA has a lower coding potential than protein-coding
Ser (g/100 g)                                  0.78 ± 0.01         0.76 ± 0.02         genes (Figure 4B). Moreover, lncRNAs had fewer exons (about
Glu (g/100 g)                                  3.18 ± 0.09         3.15 ± 0.11
Pro (g/100 g)                                  0.66 ± 0.10         0.69 ± 0.05
                                                                                       2.4) than protein-coding genes (about 3.6, Figure 4C).
Gly (g/100 g)                                  0.83 ± 0.04         0.85 ± 0.05         Interestingly, the average expression level of lncRNA was
Ala (g/100 g)                                  1.12 ± 0.05         1.15 ± 0.03         approximately 2.5-fold higher than that of protein-coding
Cys (g/100 g)                                  0.16 ± 0.02         0.02 ± 0.02         genes (6.0 vs 2.4; Figure 4D), revealing that lncRNAs in
Val (g/100 g)                                  0.91 ± 0.12         0.87 ± 0.11         muscle do not act as transcriptional noise and may play
Met (g/100 g)                                  0.52 ± 0.05         0.51 ± 0.03
Ile (g/100 g)                                  0.93 ± 0.04         0.97 ± 0.03
                                                                                       important roles in regulating biological processes. Similar to
Leu (g/100 g)                                  1.64 ± 0.06         1.64 ± 0.05         mRNA, lncRNA has a similar number of isoforms, suggesting its
Tyr (g/100 g)                                  0.67 ± 0.06         0.70 ± 0.03         important roles in transcriptional regulation (Figure 4E). The
Phe (g/100 g)                                  1.00 ± 0.10         0.93 ± 0.02         expression of lncRNA and mRNA in different combinations of
Lys (g/100 g)                                  1.87 ± 0.07         1.80 ± 0.07
                                                                                       comparative analysis indirectly shows the expression
Trp (g/100 g)                                  0.30 ± 0.01         0.30 ± 0.02
His (g/100 g)                                  0.74 ± 0.12         0.72 ± 0.04
                                                                                       relationship between lncRNA and mRNA in a certain
Arg (g/100 g)                                  1.29 ± 0.04         1.26 ± 0.06         biological period, thus volcano and MA interactive maps of
Total amino acid content (/100 g)             19.29 ± 0.56        19.00 ± 0.51         differentially expressed lncRNA and mRNA were drawn
Essential amino acid (/100 g)                  8.06 ± 0.25         7.91 ± 0.10         (Figures 4F, G). The positional relationship of genes on
Percentage of essential amino acids (%)       41.78 ± 0.73        41.63 ± 0.79
                                                                                       chromosomes is closely related to the functions of genes, and
Flavor amino acid (/100 g)                     6.94 ± 0.17         6.93 ± 0.28
Percentage of flavor amino acid (%)            35.98 ± 0.62        36.47 ± 0.33         some lncRNAs may have regulatory functions on their
                                                                                       neighboring genes. Therefore, we analyzed the chromosome
                                                                                       distribution of differentially expressed lncRNAs and mRNAs
1,296 lncRNAs were down-regulated (P < 0.05; Table S3), and                            (Figure 4H).
buffalo had a clear tendency for low expression of lncRNA
(Figures 3D–I).                                                                        Coexpression and CeRNAs Networks
    LncRNA regulates the transcription of coding genes through                         In order to further investigate the cis-regulatory relationship of
cis and trans regulatory relationships: if the role of lncRNA is                       lncRNAs, the adjacent coding genes 10 kb upstream and
limited to the same chromosome (adjacent genes), cis regulation                        downstream of the candidate lncRNAs were performed to
is exercised; trans works when it affects gene expression on other                     construct coexpression network. The top 10 most significantly
chromosomes (at long distances). The top 30 enriched KEGG                              differentially expressed lncRNAs were chosen to hunt their
pathways by cis and trans regulation were present in Figures 3E,                       neighboring coding genes (Figure 5A). Each lncRNA had
F. Calcium signaling pathway and Valine, leucine and isoleucine                        different number of adjacent coding genes. For example,
degradation had the highest level in cis or trans’ target genes                        MSTRG.266281.11 had maximum number of 11 neighboring
cluster, respectively, indicating that these pathways may involve                      coding genes, whereas MSTRG.203788.46 had only one nearby
in regulating skeletal myogenesis.                                                     coding gene (MYH8) and was positively correlated with

Frontiers in Genetics | www.frontiersin.org                                        4                                          February 2020 | Volume 11 | Article 98
Li et al.                                                                                                                        Difference in lncRNA Expression Profiles

  FIGURE 2 | Identification of lncRNAs in buffalo and cattle skeletal muscle tissue. (A) Workflow for the preparation and analysis of lncRNA libraries. (B) Pie charts
  representing the percentage of reads mapping to indicated genomic regions. (C) Venn diagram depicting the overlap of lncRNAs discovered in lncRNAs
  identification. (D, E) Distribution of lncRNAs along each chromosome. (F) Classification of lncRNAs, as defined by their genomic location relative to neighboring or
  overlapping genes.

expression levels of MYH8. Interestingly, MSTRG.233222.1 were                               LncRNAs to sequester miRNAs from their target mRNAs
up-regulated in the buffalo muscle compared to the cattle muscle,                       could be as a member of ceRNAs, and miRNAs act as common
and all its four neighboring coding genes (ICK, GSTA5, FBXO9,                           target of the lncRNAs and mRNAs. 15 muscle development
GSTA3) presented higher levels in the buffalo muscle, suggesting                        related miRNAs were chosen with a total of 5 lncRNAs and 44
this lncRNA may has cis-regulatory relationship on its                                  mRNAs to construct an ceRNA (mRNA-miRNA-lncRNA)
neighboring genes. The coexpression network could furnish                               network (Figure 5B). For instance, MSTRG.30030.4 has
valuable clue for these lncRNAs’ potential function in                                  multiple binding sites for muscle-related microRNAs, for
regulating nearby coding genes.                                                         example, miR-133a and miR-128 (Chen et al., 2006; Kim et al.,

Frontiers in Genetics | www.frontiersin.org                                         5                                           February 2020 | Volume 11 | Article 98
Li et al.                                                                                                                         Difference in lncRNA Expression Profiles

TABLE 4 | Summary of reads mapping to the reference genome.

Samples          Total Reads         Mapped Reads             Uniq Mapped Reads             Multiple Mapped Reads             Reads Map to ‘+’          Reads Map to ‘-’

Cattle1          159,445,302           144,123,296                 116,097,555                     28,025,741                    70,917,781                 70,516,292
                                         (90.39%)                   (72.81%)                        (17.58%)                      (44.48%)                   (44.23%)
Cattle2          182,448,004           164,895,797                 131,073,274                     33,822,523                    80,640,303                 80,556,898
                                         (90.38%)                   (71.84%)                        (18.54%)                      (44.20%)                   (44.15%)
Cattle3          177,076,476           158,593,439                 125,617,731                     32,975,708                    77,438,780                 76,997,388
                                         (89.56%)                   (70.94%)                        (18.62%)                      (43.73%)                   (43.48%)
Buffalo1         212,213,766           155,061,510                 137,479,465                     17,582,045                    77,107,211                 77,486,901
                                         (73.07%)                   (64.78%)                         (8.29%)                      (36.33%)                   (36.51%)
Buffalo2         190,931,794           139,035,249                 124,008,574                     15,026,675                    69,092,223                 69,540,702
                                         (72.82%)                   (64.95%)                         (7.87%)                      (36.19%)                   (36.42%)
Buffalo3         136,416,330           95,407,829                  83,824,709                      11,583,120                    47,254,024                 47,493,449
                                         (69.94%)                   (61.45%)                         (8.49%)                      (34.64%)                   (34.82%)

  FIGURE 3 | Differentially expressed lncRNAs in buffalo and cattle skeletal muscle. (A, B) The expression levels of lncRNAs, plotted as fragments per kilobase of
  exon per million fragments mapped (FPKM). (C) Weighted gene coexpression network analysis of lncRNAs in buffalo and cattle muscle sample. (D) Heatmap of
  differentially expressed lncRNAs in buffalo and cattle muscle tissue. (E, F) The top 30 enriched KEGG pathways by cis (E) and trans (F) regulation. (G–I) Scatter plot,
  MA interactive maps and volcano plot showing the correlation between abundances of individual lncRNAs in buffalo and cattle muscle sample.

Frontiers in Genetics | www.frontiersin.org                                          6                                            February 2020 | Volume 11 | Article 98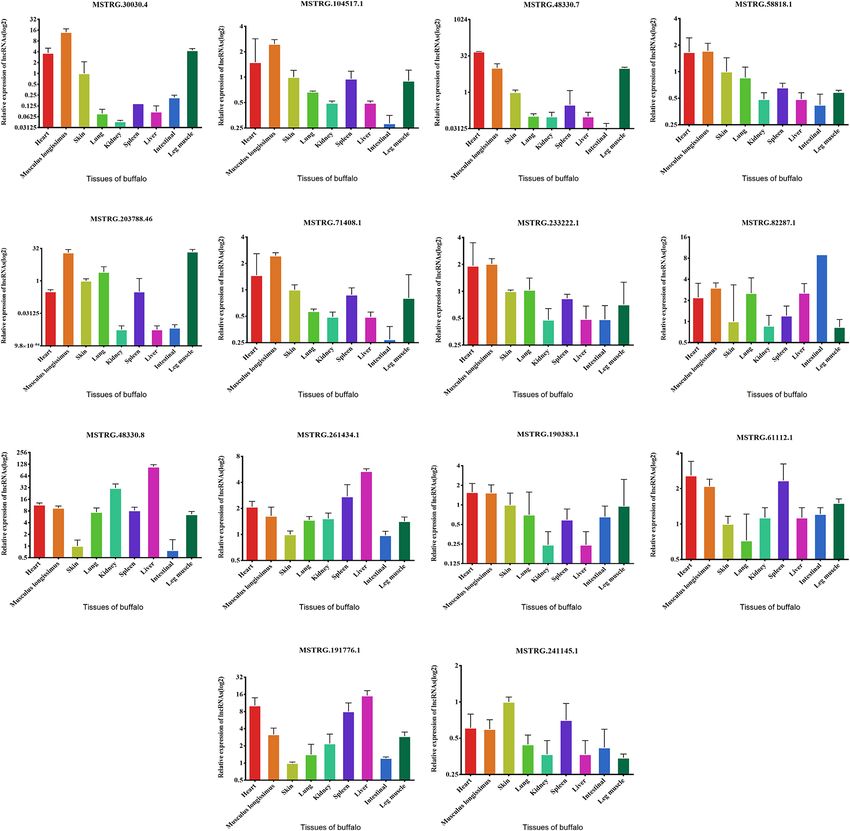
Li et al. Difference in lncRNA Expression Profiles
FIGURE 4 | Comparison and analysis of genomic features of mRNA and lncRNA in muscle tissue. (A) Distribution of transcript lengths of lncRNAs and mRNA.
(B) Distribution of ORF lengths of lncRNAs and mRNA. (C) Distribution of exon number of lncRNAs and mRNA. (D) Distribution of expression levels of lncRNAs and
mRNA. (E) Distribution of isoform number of lncRNAs and mRNA. (F, G) Volcano plot and MA interactive maps showing the correlation between abundances of
differentially expressed lncRNAs and mRNA. (H) Distribution of differentially expressed lncRNAs along each chromosome.
2006). This ceRNA network may provide valuable information fetal period and lncRNA was involved in this process (Figure
for buffalo skeletal myogenesis. 6B). We also analyzed the changes of lncRNA in fetal leg muscles
and found that the change trend was basically consistent with the
Identification of Candidate LncRNA expression of lncRNA in the longest dorsal muscle (Figure 6C)
To further validate lncRNAs expression profiles obtained from As shown in Figure 6D, MSTRG.30030.4 and MSTRG.104517.1
the RNA-Seq results, 14 lncRNAs that may be involved in muscle were the lncRNAs with the most significant expression
development regulation were selected and measured by qRT- differences among the highly expressed lncRNAs, revealing
PCR. The normalized read counts of the 14 lncRNAs were shown that they may play important roles in muscle growth or
in Table S2. Overall, these randomly selected lncRNAs showed differentiation. Therefore, we also examined the expression of
similar expression patterns between qRT-PCR and sequencing 14 lncRNAs in different tissues in order to find potential
results, suggesting that the lncRNA-Seq data are highly accurate lncRNAs that are specifically expressed and highly expressed
(Figure 6A). Similarly, we also analyzed the expression of these in muscles.
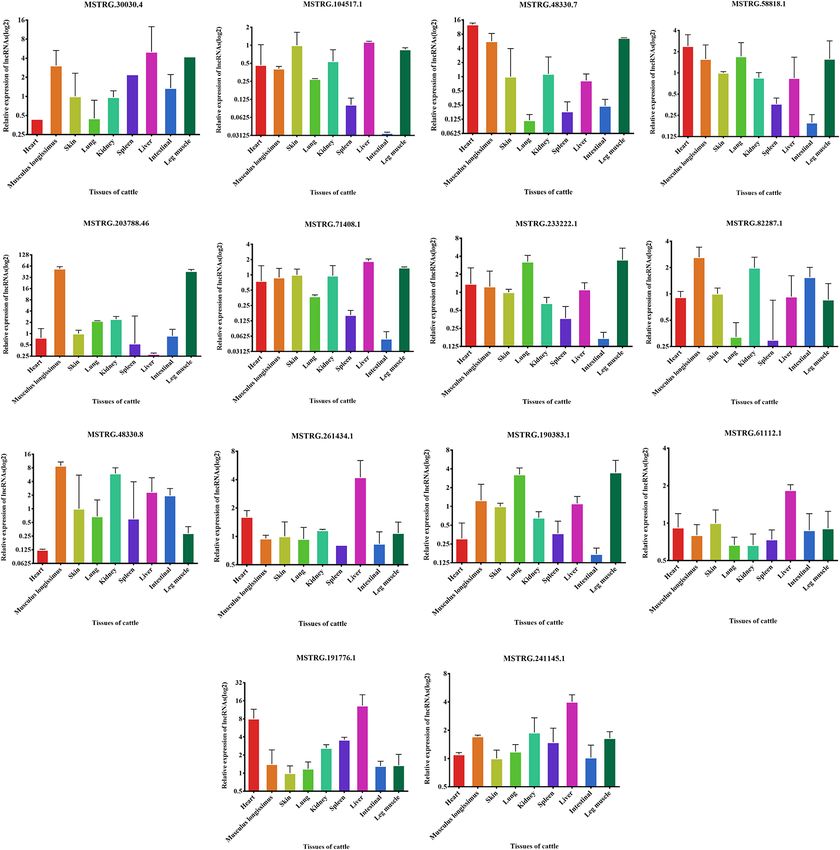
14 lncRNAs in the fetal dorsal longest muscle and found that the We examined the expression of these 14 lncRNAs in the heart,
expression of these 14 lncRNAs varied more in the fetal period, spleen, lung, liver, kidney, skin, small intestine, brain, leg muscle and
indicating that muscle development was more complex in the dorsal longest muscle of cattle and buffalo. The buffalo tissue
Frontiers in Genetics | www.frontiersin.org 7 February 2020 | Volume 11 | Article 98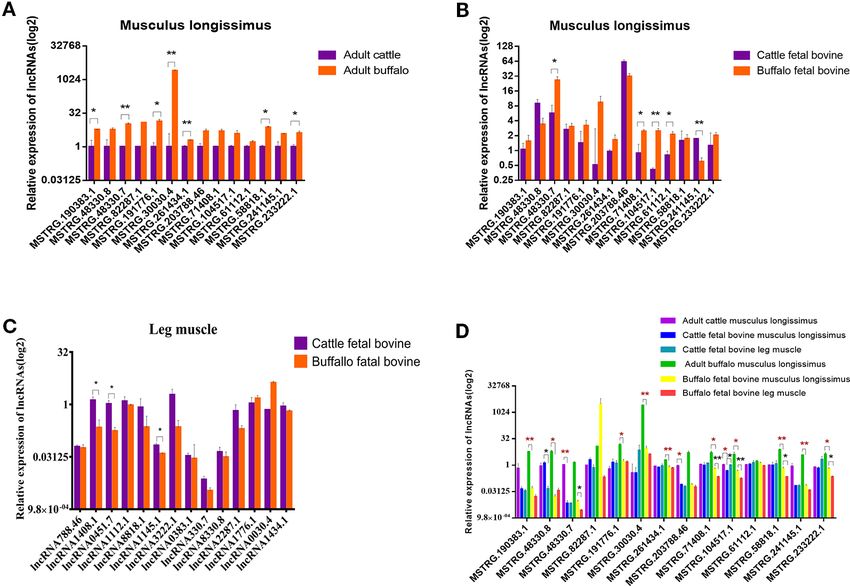
Li et al.                                                                                                                      Difference in lncRNA Expression Profiles

  FIGURE 5 | Coexpression network and competing endogenous RNA network in cattle and buffalo muscle tissues. (A) LncRNAs and their potential cis regulated
  nearby genes are shown in the network. (B) The network includes lncRNA-miRNA and miRNA-mRNA interactions, whereby edges indicate sequence matching, and
  lncRNAs connect ties suggesting miRNA-mediated mRNA expression.

  FIGURE 6 | Validation of putative lncRNA. (A) 14 lncRNAs were selected and identified, as they exhibited significantly different expression patterns (assessed from
  our RNA-sequencing approach) when comparing longissimus dorsi muscles, using quantitative real-time PCR (qRT-PCR). (B) 14 lncRNAs were identified in fetus
  cattle and buffalo longissimus dorsi muscles using qRT-PCR. (C) 14 lncRNAs were identified in fetus cattle and buffalo leg muscles using qRT-PCR. (D) The
  expression of 14 lncRNAs in cattle and buffalo muscle tissue. *P < 0.05, **P < 0.01.

Frontiers in Genetics | www.frontiersin.org                                        8                                           February 2020 | Volume 11 | Article 98
Li et al.                                                                                                                  Difference in lncRNA Expression Profiles

expressionassaydisplayedthatMSTRG.30030.4,MSTRG.104517.1,                               revolution and the improvement of social productivity, few
MSTRG.48330.7, MSTRG.58818.1, MSTRG.71408.1,                                            buffaloes are still retained for farming. At present, buffaloes
MSTRG.203788.46, and MSTRG.233222.1 was highly expressed in                             were selected for meat or milk production, and their easement
muscle tissue and low in other tissues, indicating potential roles in                   value is gradually abandoned (Pisano et al., 2016). By analyzing
buffalo muscle development (Figure 7). Similarly, we found that                         the longest dorsal muscle of buffalo and cattle in the same
MSTRG.48330.7, MSTRG.30030.4, and MSTRG.203788.46 were                                  breeding and growing environment, it was found that their
highly and specifically expressed in cattle muscle tissue, and these                     meat value was comparable. Therefore, high quality buffalo
lncRNAs could be chosen as candidates to analyze their real roles in                    meat can be obtained through optimization of breeding
vivo and in vitro in muscle development (Figure 8).                                     management. Muscle freshness is related to the composition
                                                                                        and content of umami amino acids in muscle. The flavor of beef
                                                                                        is related to fatty acid content, and marbling level of beef is one of
DISCUSSION                                                                              the important indicators in beef classification. Present study,
                                                                                        focus on physiological and biochemical indexes, amino acid
Muscle strength is a quantitative trait, which is related to a                          composition, and intramuscular fat content of the longest
variety of physiological and biochemical indexes. The origin and                        dorsal muscle of boar buffalo and local cattle were not
evolution of buffalo are closely related to the cultivation of                          significantly different under the same feeding and management
human beings (Low et al., 2019). Due to the rise of industrial                          conditions. Interestingly, there are significant differences in the

  FIGURE 7 | Expression levels of 14 candidate lncRNAs in different tissues of fetus buffalo.

Frontiers in Genetics | www.frontiersin.org                                         9                                      February 2020 | Volume 11 | Article 98
Li et al. Difference in lncRNA Expression Profiles
FIGURE 8 | Expression levels of 14 candidate lncRNAs in different tissues of fetus cattle.
shear force and muscle fiber structure (muscle fiber area, specific roles in muscle but not by-product of mRNA. In addition,
diameter, and circumference) between buffalo and cattle, which some lncRNAs were specifically or mainly expressed in muscle
may be due to genetic factors rather than the influence of tissue, such as MSTRG.30030.4, revealing that these lncRNAs are
breeding management on this trait. These results suggest that purposefully produced. LncRNA is more than just a by-product of
the strength trait of buffalo is positively selected, which is related protein coding genes, and many lncRNAs have been demonstrated
to the role of buffalo in providing animal power under China's to play a role in skeletal muscle development. Increasing studies
small-scale peasant economy for thousands of years. Similarly, show that lncRNA in cis or in trans is involved in the transcriptional
candidate genes associated with strength trait were also or post-transcriptional regulation of gene expression (Caretti et al.,
positively selected. 2006; Korostowski et al., 2012; Han et al., 2014; Zhou et al., 2015).
Most of the studies on the molecular mechanism of skeletal The top 10 most significantly differentially expressed
muscle development in bovine are protein coding genes. However, lncRNAs were chosen with their neighboring coding genes to
the occurrence and potential functions of lncRNAs, which reflect the construct a co-express network. For example, MSTRG.233222.1
differences between the longissimus muscles of buffalo and cattle, are were up-regulated in the buffalo muscle, and all its four
still unclear. Abundant lncRNAs were differentially expressed in the neighboring coding genes presented higher levels in the buffalo
muscle tissue of buffalo and cattle, suggesting that lncRNAs have muscle, suggesting this lncRNA may has cis-regulatory
Frontiers in Genetics | www.frontiersin.org 10 February 2020 | Volume 11 | Article 98Li et al. Difference in lncRNA Expression Profiles
relationship on its neighboring genes. AmRNA-miRNA-lncRNA ETHICS STATEMENT
network was constructed in buffalo muscle according to the
common target miRNAs of the mRNAs and lncRNAs. All experimental animals were provided by SIYE Breeding Farm,
MSTRG.30030.4 has multiple binding sites for muscle-related Nanning, Guangxi Province, China. The cattles and buffalos were
microRNAs, for example, miR-133a and miR-128. Tissue maintained according to the No. 5 Proclamation of the Ministry
expression analysis showed that lncRNA MSTRG.48330.7, of Agriculture, P. R. China, and we confirm that all animal
MSTRG.30030.4, and MSTRG.203788.46 were mainly protocols and methods were approved by the Review Committee
expressed in muscle tissue, that revealing its potential role in for the Use of Animal Subjects of Guangxi University.
buffalo muscle development. Moreover, MSTRG.48330.7,
MSTRG.30030.4, and MSTRG.203788.46 had multiple binding
sites for muscle-related microRNAs, for example, miR-1/206 and AUTHOR CONTRIBUTIONS
miR-133a which were the most representative muscle-associated
miRNAs (Chen et al., 2006; Kim et al., 2006). Therefore, our next QL, JR, and HL designed the experiment. KH and PW collected
step is to explore the role of MSTRG.48330.7, MSTRG.30030.4, the experimental tissues. KH, PW, TF, and KC contributed to
and MSTRG.203788.46 in the differentiation of cattle and analyzing the data and interpreting the results. HL, QL, and QQ
buffalo myoblasts. wrote the manuscript with input from all the authors. DS, CL,
and LS participated in designing the structure of the article. All
the authors read and approved the final manuscript.
CONCLUSIONS
This study is the first to compare chemical-physical FUNDING
characteristics of muscle in cattle and buffalo, and provide an
overview of lncRNA expression in buffalo muscle tissues. This work was supported by the National Natural Science
Thousands of lncRNAs were identified, and several of which Foundation of China (Grant No. 31860638 and 31760648) and
were highly and specifically expressed in buffalo muscle tissues. the Guangxi Natural Science Foundation (Grant No.
We further constructed coexpression and ceRNA networks, and AA17204051, 2018GXNSFAA050086 and AB16380042).
found MSTRG.48330.7, MSTRG.30030.4, and
MSTRG.203788.46 could be as ceRNA which contained
potential binding sites for miR-1/206 and miR-133a. This ACKNOWLEDGMENTS
study may lay a foundation for in-depth investigations into the
roles of those lncRNAs during buffalo muscle development. The authors would like to acknowledge SIYE breeding farm for
providing the cattles and buffalos.
DATA AVAILABILITY STATEMENT
SUPPLEMENTARY MATERIAL
The data generated and transcripts obtained were deposited at
NCBI as the SRA accession SRP116252 and TSA accession The Supplementary Material for this article can be found online
GFWP00000000.1. The data and material are also provided as at: https://www.frontiersin.org/articles/10.3389/fgene.2020.
Supplementary Data. 00098/full#supplementary-material
REFERENCES
Chen, J. F., Mandel, E. M., Thomson, J. M., Wu, Q., Callis, T. E., Hammond, S. M.,
Anderson, D. M., Anderson, K. M., Chang, C. L., Makarewich, C. A., Nelson, B. R., et al. (2006). The role of microRNA-1 and microRNA-133 in skeletal muscle
McAnally, J. R., et al. (2015). A micropeptide encoded by a putative long noncoding proliferation and differentiation. Nat. Genet. 38, 228–233. doi: 10.1038/ng1725
RNA regulates muscle performance. Cell 160, 595–606. doi: 10.1016/j.cell.2015.01.009 Han, P., Li, W., Lin, C. H., Yang, J., Shang, C., Nurnberg, S. T., et al. (2014). A long
Buckingham, M., and Relaix, F. (2015). PAX3 and PAX7 as upstream regulators of noncoding RNA protects the heart from pathological hypertrophy. Nature 514,
myogenesis. Semin. Cell Dev. Biol. 44, 115–125. doi: 10.1016/j.semcdb.2015.09.017 102–106. doi: 10.1038/nature13596
Caretti, G., Schiltz, R. L., Dilworth, F. J., Padova, M. D., Zhao, P., Ogryzko, V., et al. Hernandez-Hernandez, J. M., Garcia-Gonzalez, E. G., Brun, C. E., and Rudnicki, M. A.
(2006). The RNA helicases p68/p72 and the noncoding RNA SRA are (2017). The myogenic regulatory factors, determinants of muscle development, cell
coregulators of MyoD and skeletal muscle differentiation. Dev. Cell 11, 547– identity and regeneration. Semin. Cell Dev. Biol. 72, 10–18. doi: 10.1016/
560. doi: 10.1016/j.devcel.2006.08.003 j.semcdb.2017.11.010
Cesana, M., Cacchiarelli, D., Legnini, I., Santini, T., Sthandier, O., Chinappi, M., Hui, L., Jiameng, Y., Rui, J., Xuefeng, W., Chengchuang, S., Yongzhen, H., et al.
et al. (2011). A long noncoding RNA controls muscle differentiation by (2018). Long Non-coding RNA profiling reveals an abundant MDNCR that
functioning as a competing endogenous RNA. Cell 147, 358–369. doi: promotes differentiation of myoblasts by sponging miR-133a. Mol. Ther.
10.1016/j.cell.2011.09.028 Nucleic Acids 12, 610–625. doi: 10.1016/j.omtn.2018.07.003
Frontiers in Genetics | www.frontiersin.org 11 February 2020 | Volume 11 | Article 98Li et al. Difference in lncRNA Expression Profiles
Kallen, A. N., Zhou, X. B., Xu, J., Qiao, C., Ma, J., Yan, L., et al. (2013). The Pisano, M. B., Scano, P., Murgia, A., Cosentino, S., and Caboni, P. (2016).
imprinted H19 lncRNA antagonizes let-7 microRNAs. Mol. Cell 52, 101–112. Metabolomics and microbiological profile of Italian mozzarella cheese
doi: 10.1016/j.molcel.2013.08.027 produced with buffalo and cow milk. Food Chem. 192, 618–624. doi:
Kim, H. K., Lee, Y. S., Sivaprasad, U., Malhotra, A., and Dutta, A. (2006). Muscle- 10.1016/j.foodchem.2015.07.061
specific microRNA miR-206 promotes muscle differentiation. J. Cell Biol. 174, Sakaridis, I., Ganopoulos, I., Argiriou, A., and Tsaftaris, A. (2013). A fast and
677–687. doi: 10.1083/jcb.200603008 accurate method for controlling the correct labeling of products containing
Korostowski, L., Sedlak, N., and Engel, N. (2012). The Kcnq1ot1 long non-coding buffalo meat using High Resolution Melting (HRM) analysis. Meat Sci. 94, 84–
RNA affects chromatin conformation and expression of Kcnq1, but does not 88. doi: 10.1016/j.meatsci.2012.12.017
regulate its imprinting in the developing heart. PLoS Genet. 8, e1002956. doi: Wang, J., Gong, C., and Maquat, L. E. (2013). Control of myogenesis by rodent SINE-
10.1371/journal.pgen.1002956 containing lncRNAs. Genes Dev. 27, 793–804. doi: 10.1101/gad.212639.112
Li, H., Yang, J., Jiang, R., Wei, X., Song, C., Huang, Y., et al. (2018a). CircFUT10 Wang, G. Q., Wang, Y., Xiong, Y., Chen, X. C., Ma, M. L., Cai, R., et al. (2016).
reduces proliferation and facilitates differentiation of myoblasts by sponging Sirt1 AS lncRNA interacts with its mRNA to inhibit muscle formation by
miR-133a. J. Cell. Physiol. 233, 4643–4651. doi: 10.1002/jcp.26230 attenuating function of miR-34a. Sci. Rep. 6, 21865. doi: 10.1038/srep21865
Li, Y., Chen, X., Sun, H., and Wang, H. (2018b). Long non-coding RNAs in the Zhang, Y., Wang, H., Gui, L., Wang, H., Mei, C., Zhang, Y., et al. (2016). Profile of
regulation of skeletal myogenesis and muscle diseases. Cancer Lett. 417, 58–64. muscle tissue gene expression specific to water buffalo: comparison with domestic
doi: 10.1016/j.canlet.2017.12.015 cattle by genome array. Gene 577, 24–31. doi: 10.1016/j.gene.2015.11.015
Low, W. Y., Tearle, R., Bickhart, D. M., Rosen, B. D., Kingan, S. B., Swale, T., et al. Zhou, L., Sun, K., Zhao, Y., Zhang, S., Wang, X., Li, Y., et al. (2015). Linc-YY1
(2019). Chromosome-level assembly of the water buffalo genome surpasses promotes myogenic differentiation and muscle regeneration through an
human and goat genomes in sequence contiguity. Nat. Commun. 10, 260. doi: interaction with the transcription factor YY1. Nat. Commun. 6. doi: 10.1038/
10.1038/s41467-018-08260-0 ncomms10026
Mchugh, C. A., Chen, C. K., Chow, A., Surka, C. F., Tran, C., Mcdonel, P., et al.
(2015). The Xist lncRNA interacts directly with SHARP to silence transcription Conflict of Interest: The authors declare that the research was conducted in the
through HDAC3. Nature 521, 232. doi: 10.1038/nature14443 absence of any commercial or financial relationships that could be construed as a
Munschauer, M., Nguyen, C. T., Sirokman, K., Hartigan, C. R., Hogstrom, L., Engreitz, potential conflict of interest.
J. M., et al. (2018). The NORAD lncRNA assembles a topoisomerase complex
critical for genome stability. Nature 561, 132. doi: 10.1038/s41586-018-0453-z Copyright © 2020 Li, Huang, Wang, Feng, Shi, Cui, Luo, Shafique, Qian, Ruan and
Nelson, B. R., Makarewich, C. A., Anderson, D. M., Winders, B. R., Troupes, C. D., Wu, F., Liu. This is an open-access article distributed under the terms of the Creative
et al. (2016). A peptide encoded by a transcript annotated as long noncoding RNA Commons Attribution License (CC BY). The use, distribution or reproduction in
enhances SERCA activity in muscle. Science 351, 271–275. doi: 10.1126/science.aad4076 other forums is permitted, provided the original author(s) and the copyright owner(s)
Neumann, P., Nicolas, Jaé, Knau, A., Glaser, S. F., Fouani, Y., Rossbach, O., et al. (2018). are credited and that the original publication in this journal is cited, in accordance
The lncRNA GATA6-AS epigenetically regulates endothelial gene expression via with accepted academic practice. No use, distribution or reproduction is permitted
interaction with LOXL2. Nat. Commun. 9, 237. doi: 10.1038/s41467-017-02431-1 which does not comply with these terms.
Frontiers in Genetics | www.frontiersin.org 12 February 2020 | Volume 11 | Article 98You can also read