Treasury Management Strategy 2021/22 to 2023/24 - Including: Minimum Revenue Provision (MRP) Policy 2020/21 & 2021/22
←
→
Page content transcription
If your browser does not render page correctly, please read the page content below
Appendix 1 – Treasury Management Strategy

  Treasury Management Strategy
  2021/22 to 2023/24

  Including:
  Minimum Revenue Provision (MRP)
  Policy 2020/21 & 2021/22

                                        7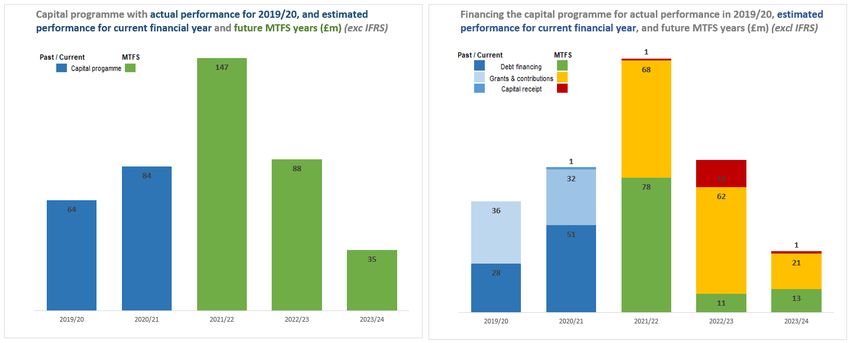
1. Introduction
1.1. Background
1.1.1. The Council is required to operate a balanced budget, which means that cash raised
through the year will meet its cash expenditure. The Treasury Management Strategy
(TMS) has four fundamental roles:
Manage external investments - security, liquidity and yield
Ensure debt is prudent and economic
Produce and monitor the Prudential Indicators
To ensure that decisions comply with regulations.
1.1.2. The role of treasury management is to ensure cash flow is adequately planned so that
cash is available when it is needed. Surplus monies are invested in low-risk
counterparties commensurate with the Council’s low risk appetite ensuring that security
and liquidity are achieved before considering investment return.
1.1.3. The second main function of the treasury management service is the funding of the
Council’s capital plans. These capital plans provide a guide to the borrowing need of
the Council, essentially the longer-term cash flow planning, to ensure that the Council
can meet its capital spending obligations. This management of longer-term cash may
involve arranging long or short-term loans or using longer-term cash flow surpluses. On
occasion, when it is prudent and economic, any debt previously drawn may be
restructured to meet Council risk or cost objectives.
1.1.4. The contribution the treasury management function makes to the authority is critical, as
the balance of debt and investment operations ensure liquidity or the ability to meet
spending commitments as they fall due, either on day-to-day revenue or for larger capital
projects. The treasury operations will see a balance of the interest costs of debt and the
investment income arising from cash deposits affecting the available budget. Since cash
balances generally result from reserves and balances, it is paramount to ensure
adequate security of the sums invested, as a loss of principal will in effect result in a loss
to the General Fund Balance.
1.1.5. Whilst any loans to third parties will impact on the treasury function, these activities are
generally classed as non-treasury activities, (arising usually from capital expenditure),
and are separate from the day-to-day treasury management activities.
1.1.6. CIPFA defines treasury management as:
“The management of the local authority’s investments and cash flows, its banking,
money market and capital market transactions; the effective control of the risks
associated with those activities; and the pursuit of optimum performance consistent with
those risks.”
1.2. Reporting Requirements
1.2.1. Capital Strategy
1.2.2. The CIPFA revised 2017 Prudential and Treasury Management Codes requires all local
authorities to prepare an additional report, a capital strategy report, which will provide
the following:
a high-level long-term overview of how capital expenditure, capital financing; and
treasury management activity contribute to the provision of services
2
8 an overview of how the associated risk is managed
the implications for future financial sustainability
1.2.3. The aim of this capital strategy is to ensure that all elected members on the full council
fully understand the overall long-term policy objectives and resulting capital strategy
requirements, governance procedures and risk appetite.
1.2.4. This Capital Strategy is reported separately from the Treasury Management Strategy
and non-treasury investments will be reported through the former. This ensures the
separation of the core treasury function under security, liquidity and yield principles, and
the policy and investments usually driven by expenditure on an asset. The Capital
Strategy shows:
the corporate governance arrangements for these types of activities
any service objectives relating to the investments
the expected income, costs and resulting contribution
for non-loan type investments, the cost against the current market value
the risks associated with each activity
1.2.5. Where a physical asset is being bought, details of market research, advisers used, (and
their monitoring), ongoing costs and investment requirements and any credit information
will be disclosed, including the ability to sell the asset and realise the investment cash.
1.2.6. Where the Council has borrowed to fund any non-treasury investment, there would be
an explanation of why borrowing was required and why the MHCLG Investment
Guidance and CIPFA Prudential Code have not been adhered to, see section 14 for
further details.
1.2.7. The Council does not hold any non-treasury investment for purely yield and financial
return purposes. However, if a loss is incurred on any non-treasury investment during
the final accounts and audit process, the strategy and revenue implications will be
reported through the budgetary control process.
1.3. Treasury Management Reporting
1.3.1. The council is currently required to receive and approve, as a minimum, three main
treasury reports each year, which incorporate a variety of policies, estimates and actuals.
1.3.2. Prudential and Treasury Indicators and Treasury Strategy - the first, and most
important report is forward looking and covers:
the capital plans, (including prudential indicators)
a Minimum Revenue Provision (MRP) policy, (how residual capital expenditure is
charged to revenue over time)
the treasury management strategy, (how the investments and borrowings are to be
organised), including treasury indicators
an investment strategy, (the parameters on how investments are to be managed)
1.3.3. A Mid-Year Treasury Management Report – this is primarily a progress report and will
update members on the capital position, amending prudential indicators as necessary,
and whether any policies require revision.
3
91.3.4. An Annual Treasury Report – this is a backward-looking review document and
provides details of a selection of actual prudential and treasury indicators and actual
treasury operations compared to the estimates within the strategy.
4
101.3.5. Scrutiny
1.3.6. The above reports are required to be adequately scrutinised and this role is undertaken
by the Audit Committee, Cabinet and full Council.
1.4. Treasury Management Strategy for 2021/22
1.4.1. The strategy for 2021/22 covers:
Capital issues
the capital expenditure plans and the associated prudential indicators
the MRP policy
Treasury management issues
the current treasury position debt rescheduling
treasury indicators which limit the the investment strategy
treasury risk and activities of the
creditworthiness policy
Council
the policy on use of external service
prospects for interest rates
providers
the borrowing strategy
policy on borrowing in advance of
need
1.4.2. These elements cover the requirements of the Local Government Act 2003, the CIPFA
Prudential Code 2017, the MHCLG MRP Guidance, the CIPFA Treasury Management
Code 2017, and the MHCLG Investment Guidance.
1.5. IFRS16 - Leases
1.5.1. A new International Financial Reporting Standard (IFRS) on leases is due to be adopted
by the Code of Practice on Local Authority Accounting in the United Kingdom (the Code)
with effect from 1 April 2022. IFRS 16 defines a lease as a contract or part of a contract,
which conveys the right to use as asset (the underlying asset) for a period in exchange
for a consideration. The CIPFA/LASAAC Local Authority Accounting Code Board has
agreed to defer the implementation of IFRS 16 Leases until the 2022/23 financial year.
This decision was taken in response to pressures on council finance teams as a result
of the COVID-19 pandemic.
1.5.2. Under the standard the distinction between finance leases and operating leases under
the previous leasing standard is removed and all leases are treated as finance leases.
A ‘right of use’ asset is shown on the balance sheet with a corresponding liability of the
discounted value of the future lease payments. There are exceptions for short-dated
leases (under a year, or with less than a year remaining at transition) and low value
leases (low value to be determined by the Council using its approach to determining de
minimus items).
1.5.3. All leases that do not meet the exceptions will be treated as capital expenditure from
2022/23 and form part of the Capital Financing Requirement (CFR). An estimate of the
impact of the transition to the new standard has been built into the relevant indicators.
The full impact will not be known until the 2022 Code has been issued and the detailed
assessment completed. If this has a material impact on the Prudential Indicators then a
revised Treasury Management Strategy will be produced.
5
116 12
1.6.   Training
1.6.1. The CIPFA Code requires the responsible officer to ensure that Council members with
       responsibility for treasury management receive adequate training in treasury
       management. This requirement is reviewed annually as part of the annual Performance
       Development Review (PDR) and monthly supervisions. This requirement also applies
       to Council members responsible for scrutiny.

1.7.   Changes to the current Treasury Management Code and Prudential Code
1.7.1. CIPFA have released proposed changes to the current Treasury Management Code and
       Prudential Code.
1.7.2. The Treasury Management code was last updated in 2017, since then the landscape for
       public services has changed. The increasing profile of the role of treasury management
       as a result of the pandemic, the disciplines and skills required to meet the advances
       brought forward by issues such as the Markets in Financial Instruments Directive, known
       as MIFID II, and the increasing complexity of transactions in the sector all underline the
       importance of the Treasury Management Code and its guidance. In addition, the rise in
       commercial non-treasury investments is a contributing factor behind the need to
       strengthen its provisions to ensure that they are fit for the 21st century. The proposed
       changes to the treasury management practices guidance includes increased monitoring
       of training and skills, and a formal policy requirement for documenting training. CIPFA is
       also proposing new guidance for environmental, social and governance risk
       management, so that local authorities consider the ecological impact of the company
       they are looking to work with.
1.7.3. In response to the recommendation of the Public Accounts Committee and the
       substantial increase in commercial investment, CIPFA is proposing to strengthen the
       provisions within the Prudential Code of Capital Finance in Local Authorities, CIPFA
       2017 (Prudential Code), and will require any local authority commercial investment
       undertaken to be consistent with statutory provisions, proportionate to service and
       revenue budgets and consistent with effective treasury management practice. The
       proposed revisions to the Prudential Code also strengthen the requirement to assess
       the affordability of commercial activity within local authorities’ capital strategies.
1.7.4. The closing date for responding to the consultations is 12 April 2021 and the Council
       intends to respond to both.

1.8.   Treasury Management Advisors
1.8.1. The Council uses Link Group, Treasury solutions as its external treasury management
       advisors who have a contract until September 2021.
1.8.2. The Council recognises that responsibility for treasury management decisions remains
       with the Council at all times and will ensure that undue reliance is not placed upon
       external advisors.
1.8.3. The Council also recognises that there is value in employing external providers of
       treasury management services in order to access specialist skills and resources. The
       Council will ensure that the terms of their appointment and the methods by which their
       value will be assessed are properly agreed, documented and subjected to regular
       review.

1.9.   Treasury Management Policy Statement

                                              7

                                       13
1.9.1. The Treasury Management Policy Statement sets out the policies and objectives of
Treasury Management Activities which is revised annually. It reflects December 2017
guidance.
1.9.2. The Council regards the successful identification, monitoring and control of risk to be the
prime criteria by which the effectiveness of its treasury management activities will be
measured. Accordingly, the analysis and reporting of treasury management activities will
focus on their risk implications for the organisation, and any financial instruments entered
into to manage these risks.
1.9.3. The Council acknowledges that effective treasury management will provide support
towards the achievement of its business and service objectives. It is therefore committed
to the principles of achieving value for money in treasury management, and to employing
suitable comprehensive performance measurement techniques, within the context of
effective risk management.
1.9.4. Investments cover all financial assets of the organisation, as well as other non-financial
assets which the organisation holds and attracts a financial return such as existing
historic investment property portfolios. This may therefore include investments which
are not managed as part of normal treasury management or under treasury management
delegations. All investments require an appropriate investment management and risk
management framework. For the investment property portfolio this is incorporated in the
Asset Management Plan.
1.9.5. The Council’s high-level policies for borrowing and investments are set out below:
to reduce the revenue cost of the Council’s debt in the medium term by obtaining
financing at the cheapest rate possible
to invest available cash balances with a few high-quality investment counterparties
over a spread of maturity dates in accordance with the Council’s lending list
to seek to reschedule or repay debt at the optimum time
1.10. The Treasury Management Role of the Section 151 Officer
The S151 (responsible) officer must do the following:
recommend clauses, treasury management policy/practices for approval, reviewing
the same regularly, and monitoring compliance
submit regular treasury management policy reports
submit budgets and budget variations
receive and reviewing management information reports
review the performance of the treasury management function
ensuring the adequacy of treasury management resources and skills, and the
effective division of responsibilities within the treasury management function
ensuring the adequacy of internal audit, and liaising with external audit
recommending the appointment of external service providers
preparation of a capital strategy to include capital expenditure, capital financing, non-
financial investments and treasury management, with a long-term timeframe
ensuring that the capital strategy is prudent, sustainable, affordable and prudent in
the long-term and provides value for money
8
14 ensuring that due diligence has been carried out on all treasury and non-financial
investments and is in accordance with the risk appetite of the authority
ensure that the authority has appropriate legal powers to undertake expenditure on
non-financial assets and their financing
ensuring the proportionality of all investments so that the authority does not undertake
a level of investing which exposes the authority to an excessive level of risk compared
to its financial resources
ensuring that an adequate governance process is in place for the approval,
monitoring and ongoing-risk management of all non-financial investments and long-
term liabilities
provision to members of a schedule of all non-treasury investments including material
investments in subsidiaries, joint ventures, loans and financial guarantees
ensuring that members are adequately informed and understand the risk exposures
taken on by an authority. This is done by regular training presentations to the Audit
Committee.
ensuring that the authority has adequate expertise, either in house or externally
provided, to carry out the above. This is done by regular attendance at courses and
conferences and joint working with the Link Group as treasury advisors
creation of Treasury Management Practices (TMPs) which specifically deal with how
non treasury investments will be carried out and managed, to include the following -
o Risk management (TMP1 and schedules), including investment and risk
management criteria for any material non-treasury investment portfolios
o Performance measurement and management (TMP2 and schedules), including
methodology and criteria for assessing the performance and success of non-
treasury investments
o Decision making, governance and organisation (TMP5 and schedules), including
a statement of the governance requirements for decision making in relation to non-
treasury investments; and arrangements to ensure that appropriate professional
due diligence is carried out to support decision making
o Reporting and management information (TMP6 and schedules), including where
and how often monitoring reports are taken to the various committees
o Training and qualifications (TMP10 and schedules), including how the relevant
knowledge and skills in relation to non-treasury investments will be arranged
9
152. Capital Prudential Indicators 2021/22 to 2023/24
2.1. The Council’s capital programme is the key driver of the treasury management activity.
The output of the capital programme is reflected in the prudential indicators which are
designed to assist member’s overview and confirm the capital programme.
2.2. Indicator 1 – Capital Expenditure – this Prudential Indicator is a summary of the Council’s
estimated capital expenditure for the forthcoming financial year and the following two
financial years including how it will be funded either from grants, contributions, or capital
receipts with the remaining being the ‘net financing requirement’
2019/20 2020/21 2021/22 2022/23 2023/24
Capital Expenditure Actual Est Est Est Est
£m £m £m £m £m
Customer & Digital Services 3.0 4.6 2.5 3.0 3.0
20.6 46.1 13.1 16.5
People & Communities 21.0
33.0 13.8
Place & Economy 18.1 46.6 53.3
Resources 16.6 13.8 18.2 12.1 2.0
-
Capitalisation Direction 5.6 6.0 20.0 -
Invest to Save - 5.9 13.5 6.6 -
Total 64.3 83.9 146.9 88.1 35.3
Financed by:
Capital receipts (repayment of capital loans) - 1.4 1.1 15.5 1.2
Capital grants & contributions 36.2 32.0 67.8 62.0 20.6
Net Financing Requirement 28.1 50.5 78.0 10.6 13.5
Total 64.3 83.9 146.9 88.1 35.3
IFRS16 Transition 22.0
The below charts show the capital programme in visual form along with funding breakdown.
2.3. The capital receipts (repayment of capital loans) shown in the table relate to:
2020/21 - ECS Peterborough 1LLP – capital loan repayment - £1.0m and Vivacity
£0.4m
2021/22 - ECS Peterborough 1LLP – capital loan repayment - £1.1m
2022/23 - ECS Peterborough 1LLP – capital loan repayment - £1.2m and Hotel
£14.3m
10
16 2023/24 - ECS Peterborough 1LLP – capital loan repayment - £1.2m
2.4. The Invest to Save schemes are included in total capital expenditure and the funding
resources to be used. However, these schemes will either generate income or generate
savings on revenue budgets elsewhere in the Council’s services. Therefore, the borrowing
costs associated with these projects will have a minimal impact on the Council’s MTFS
position.
2.5. Indicator 2 – Capital Financing Requirement (CFR) – the CFR is the total historical capital
expenditure which has not yet been paid for from either revenue or capital resources. It is
a measure of the Council’s underlying borrowing requirement. Any capital expenditure
which has not immediately been paid for will increase the CFR.
2.6. The CFR does not increase indefinitely, as the MRP is a statutory annual revenue charge
which broadly reduces the indebtedness in line with each asset's life, and so charges the
economic consumption of capital assets as they are used.
2.7. The CFR includes any other long-term liabilities (e.g. PFI schemes, finance leases)
included on the Council’s balance sheet. Whilst this increases the CFR, and therefore the
Council’s borrowing requirement, these types of schemes include a borrowing facility and
so the Council is not required to separately borrow for these schemes. The following table
shows the CFR estimates for the next three financial years for Council approval:
2019/20 2020/21 2021/22 2022/23 2023/24
Capital Financing Requirement Actual Est Est Est Est
£m £m £m £m £m
CFR brought forward 577.4 588.4 622.0 682.2 694.4
Borrowing / (Repayment) 5.4 27.7 26.7 (15.5) (5.1)
Invest to Save - 5.9 13.5 6.6 -
IFRS16 Transition adjustment & MRP - - - 22.0 (0.8)
Capitalisation Direction & MRP 5.6 - 20.0 (0.9) (0.9)
CFR carried forward 588.4 622.0 682.2 694.4 687.6
Movement in CFR 11.0 33.6 60.2 12.2 (6.8)
Net financing requirement 28.1 50.5 78.0 10.5 13.5
Lease Liability (est IFRS16 adj) - - - 22.0 -
Less MRP & other financing (17.1) (16.9) (17.8) (20.3) (20.3)
Movement in CFR 11.0 33.6 60.2 12.2 (6.8)
2.8. Indicator 3 – Actual and estimates of the ratio of financing costs to net revenue budget.
This indicator identifies the proportion of the revenue budget which is taken up in financing
capital expenditure i.e. the net interest cost and the provision to repay debt.
Ratio of Gross Financing Costs to Net 2019/20 2020/21 2021/22 2022/23 2023/24
Revenue Budget Actual Est Est Est Est
Total Ratio 20.0% 16.1% 15.2% 17.0% 17.7%
Ratio with gross MRP charge (capital
receipts to redeem debt not factored into 22.0% 21.8% 16.5% 18.4% 17.9%
financing)
Relating to Capitalisation Direction 0.0% 0.2% 0.3% 0.8% 0.8%
11
1712 18
3.     Minimum Revenue Provision (MRP) Policy Statement

3.1.    Capital expenditure is generally expenditure on assets which have a life expectancy of
        more than one year e.g., buildings, vehicles, equipment, etc. Such expenditure is spread
        over several years in order to try to match the years over which such assets benefit the
        local community through their useful life. The manner of spreading these costs is through
        an annual MRP.

3.2.    MHCLG Regulations require full Council to approve an MRP statement in advance of each
        year. A variety of options are provided to Councils to calculate this revenue charge and
        the Council must satisfy itself that the provision is prudent.

3.3.    A change introduced by the revised MHCLG MRP Guidance was the allowance that any
        charges made over the statutory MRP, voluntary revenue provision (VRP) or
        overpayments, can, if needed, be reclaimed in later years if deemed necessary or prudent.
        In order for these sums to be reclaimed for use in the budget, this policy must disclose the
        cumulative overpayment made each year. Previous accumulated overpayments were
        fully utilised as at 31 March 2020.

3.4.    Councils are allowed by statute to use capital receipts for the repayment of any borrowing
        previously incurred. The application of capital receipts to repay debt would reduce the
        level of MRP chargeable to revenue, but statutory guidance does not address how such
        a reduction should be calculated. When the Council uses its capital receipts to redeem
        borrowing, the value of the MRP which would otherwise have been set aside for that year
        will be reduced by the amounts which have instead been repaid from capital receipts.
        This results in a prudent level of MRP, as there will be no reduction in the overall level of
        funding set aside to redeem debt.

3.5.    During 2019/20 detailed discussions were held with MHCLG with regards to the Council's
        application of capital receipts to redeem debt. Following these discussions there remains
        a possibility that the government could amend legislation to provide additional clarity with
        regards to the use of capital receipts to redeem debt. At the time of drafting there has
        been no additional clarity provided and therefore the Council has not amended its
        approach and continues to use the receipt from asset sales to redeem its debt. Once
        clarity is provided the Council will review its application of receipts and amend its policy
        accordingly if it is deemed necessary with relevant reports presented to the member
        meetings.

3.6.    There are other possible uses for capital receipts, as per the Capital Strategy, the level of
        capital receipts used to redeem debt will be at the discretion of the S151 officer and their
        judgements as to which option provides better value for money for the Council's financial
        strategy.

3.7.    Repayments for the PFI scheme and finance leases are applied as MRP, and the
        associated amounts are included in these Prudential Indicators.

3.8.    The following table summarises the MRP Policy.

       Capital Expenditure
                                   MRP Policy Update 2020/21 & 2021/22
       Incurred
       Expenditure funded by       Asset Life, annuity method – MRP will be based on the prevailing PWLB
       unsupported borrowing       interest rate for a loan with a term equivalent to the estimated life of the
                                   project.
                                   If capital receipts have been used to repay borrowing for the year then the
                                   value of MRP which would have otherwise been set aside to repay
                                   borrowing will be reduced by the amounts which have instead been repaid
                                                 13

                                           19
Capital Expenditure
MRP Policy Update 2020/21 & 2021/22
Incurred
from capital receipts. The level of capital receipts to be applied to redeem
borrowing will be determined annually by the Chief Finance Officer (S151),
taking into account forecasts for future expenditure, the generation of
further receipts and alternative uses which may provide better value for
money for the Council's financial strategy. The same process will apply for
S106, POIS and CIL receipts.
Private Finance Initiative
Use the annuity method of calculation over the remaining asset life
(PFI) - Finance Lease
The MRP requirement would be regarded as met by a charge equal to the
element of the rent/charge that goes to write down the balance sheet
liability.
Where a lease (or part of a lease) is brought onto the balance sheet,
Other Finance Leases having previously been accounted for off- balance sheet, the MRP
requirement would be regarded as having been met by the inclusion in the
charge for the year in which the restatement occurs, of an amount equal to
the write-down for that year plus retrospective writing down of the balance
sheet liability that arises from the restatement.
Secured loans to third No MRP will be charged each year as reliance can be placed on the capital
parties repaid in bullet receipt that will be generated when the loan is repaid or, in the event of a
form. default, the realisation of the security. If realisation of the security does not
equate to the original loaned amount the Council will recognise the
associated impairment and will charge MRP for the outstanding loan
amount over the next MTFS periods or remaining life of the asset,
whichever is longer. Impairment relating to IFRS9 adjustments will attract
the same treatment.
Secured loans to third MRP will be charged each year equal to the Annual Base Repayment
parties repaid over the life Amounts profiled in the legal agreement. Where additional repayments are
of the loan. made by the borrower the Council will make voluntary MRP charges to
match. In the event of default reliance will be placed on the capital receipt
that will be generated on realisation of the security. If realisation of the
security does not equate to the remaining balance of the loan the Council
will recognise the associated impairment and charge MRP on this amount
over the next MTFS period or remaining life of the asset, whichever is
longer. Impairment relating to IFRS9 adjustments will attract the same
treatment.
14
204. Current Treasury Position
4.1. The capital expenditure plans set out in Section 2 provides a summary of the service activity
of the Council. The treasury management function ensures that the Council’s cash is
organised in accordance with the relevant professional codes, so that sufficient cash is
available to meet this service activity and the Council’s capital strategy. This will involve
both the organisation of the cash flow and, where capital plans require, and the organisation
of appropriate borrowing facilities. The strategy covers the relevant treasury / prudential
indicators, the current and projected debt positions and the annual investment strategy.
4.2. The overall treasury management portfolio as at 31 March 2020, and for the position as at
at 8 February 2021, are shown in the following table for both borrowing and investment.
Actual Actual Current Current
Treasury Portfolio 31.03.20 31.03.20 08.02.21 08.02.21
£000 % £000 %
Treasury Investments
Banks 9,700 100 13,800 58
DMADF (HM Treasury) - - - -
Money Market Funds - - 10,000 42
Total Treasury Investments 9,700 100 23,800 100
Treasury External Borrowing
Local Authorities (90,500) 19 (55,000) 12
PWLB (369,587) 77 (369,587) 84
LOBOs (17,500) 4 (17,500) 4
Total External Borrowing (477,587) 100 (442,087) 100
Net Treasury Investment / (Borrowing) (467,887) (418,177
4.3. Indicator 4 - The Council’s estimated treasury position at 31 March 2021, with estimates
for future years, is summarised below. The table below shows the actual external borrowing
(Gross Debt) against the estimated CFR.
2019/20 2020/21 2021/22 2022/23 2023/24
Gross debt & capital financing
Actual Est Est Est Est
requirement
£m £m £m £m £m
External Borrowing
Market Borrowing 457.6 477.6 511.2 571.4 541.7
Repayment of borrowing (17.5) (110.5) (49.6) (12.1) (5.0)
Expected change in borrowing 37.5 144.1 89.8 3.3 (0.2)
Capitalisation Direction - - 20.0 (0.9) (0.9)
Other long-term liabilities 49.8 48.8 48.0 69.2 67.5
Gross Debt at 31 March 527.4 560.0 619.4 630.9 603.1
CFR 588.4 622.0 682.2 694.4 687.6
% of Gross Debt to CFR 89.6% 90.0% 90.8% 90.8% 87.8%
4.4. Based on the prudential indicators there are a number of key measures to ensure that the
Council operates its activities within defined limits. One of these is that the Council needs
to ensure that its total borrowing does not, except in the short-term, exceed the total of the
CFR in the year plus the estimates of any additional CFR for 2021/22 and the following two
financial years. This allows some flexibility for limited early borrowing for future years, but
ensures that borrowing is not undertaken for revenue purposes.
4.5. The Chief Finance Officer (S151) reports that the Council complied with this prudential
indicator in the current year and does not envisage difficulties for the future. This view takes
15
21into account current commitments, existing plans and the proposals in this Medium-Term
Financial Strategy (MTFS).
4.6. Indicator 5 - The Operational Boundary - external borrowing is not normally expected to
exceed this limit. If the operational boundary was exceeded this would be reported
immediately to the members of the Audit Committee with a full report taken to the next
committee meeting. In the current year it has not been exceeded. The Operational
Boundary is set out below:
2019/20 2020/21 2021/22 2023/24
2022/23Est
Operational Boundary Actual Est Est Est
£m
£m £m £m £m
Borrowing 477.6 632.0 702.2 704.5 693.4
Other long-term liabilities 49.8 48.8 48.0 69.2 67.5
Total 527.4 680.8 750.2 773.7 760.9
4.7. Indicator 6 - The Authorised Limit for external borrowing - this represents a limit beyond
which external borrowing is prohibited. This limit is set and revised by full Council.
2019/20 2020/21 2021/22 2022/23 2023/24
Authorised Limit Actual Est Est Est Est
£m £m £m £m £m
Borrowing 477.6 700.8 780.2 813.7 770.9
Other long-term liabilities 49.8 48.8 48.0 69.2 67.5
Total 527.4 749.6 828.2 882.9 838.4
4.8. This is a statutory limit determined under section 3 (1) of the Local Government Act 2003.
Government under sections 4(1) and 4(2) may limit either the total of all Council borrowing,
or those of a specific Council, although this power has not yet been exercised.
16
2217 23
5. Prospects for Interest Rates
5.1. The Council utilises the treasury services of Link Group and part of their service is to assist
the Council to formulate a view on interest rates to assist with borrowing and investment
decisions.
5.2. The Link Group forecast for bank base rate and PWLB new borrowing was updated on the
9th February 2021 as a consequence of the outcome of the Monetary Policy Report and is
as follows (note that the PWLB Borrowing Rate includes the Certainty Rate adjustment).
Interest Rate Bank 5yr 10yr 25yr 50yr
Budget
(All rates shown Rate PWLB PWLB PWLB PWLB
as %)
Assumption
View Rate Rate Rate Rate
Mar-21 0.10 0.90 1.30 1.90 1.70 1.50
Jun-21 0.10 0.90 1.30 1.90 1.70
Sep-21 0.10 0.90 1.30 1.90 1.70
1.40
Dec-21 0.10 0.90 1.30 1.90 1.70
Mar-22 0.10 1.00 1.40 2.00 1.80
Jun-22 0.10 1.00 1.40 2.00 1.80
Sep-22 0.10 1.10 1.50 2.10 1.90
1.50
Dec-22 0.10 1.10 1.50 2.10 1.90
Mar-23 0.10 1.10 1.50 2.10 1.90
Jun-23 0.10 1.20 1.60 2.20 2.00
Sep-23 0.10 1.20 1.60 2.20 2.00
1.60
Dec-23 0.10 1.20 1.60 2.20 2.00
Mar-24 0.10 1.20 1.60 2.20 2.00
5.3. The Council successfully applied to be one of the principal local authorities that would
qualify for the Certainty Rate, during the period 1 November 2020 to 31 October 2021. This
results in the Council being able to benefit from reduced interest rates on PWLB loans by
20 basis points (0.20%). The Council is assuming that there will be a similar scheme in
place when this scheme expires. The Council will submit a new application to ensure it
qualifies.
5.4. When borrowing is undertaken an assessment of the prevailing interest rates is performed
across the different period lengths and the debt taken will represent best value for money
in accordance with the existing debt maturity profile and capital financing budget
performance.
5.5. Link Group interest rate forecasts, are based on their views of the future economic climate,
and below are some extracts taken from their economic forecasts:
The Bank of England’s Monetary Policy Committee (MPC) kept Bank Rate and
quantitative easing (QE) unchanged on 4th February. However, it revised its economic
forecasts to take account of a third national lockdown which started on 5th January,
which is obviously going to delay economic recovery and do further damage to the
economy. Moreover, it had already decided in November to undertake a further
tranche of quantitative easing (QE) of £150bn, to start in January when the previous
programme of £300bn of QE, announced in March to June 2020, finished. As only
about £16bn of the latest £150bn tranche had been used towards the end of January,
it felt that there was already sufficient provision for QE - which would be made to last
to the end of 2021. This implied that the current rate of purchases of £4.4bn per week
would be slowed during the year.
Although its short-term forecasts were cut for 2021, the medium-term forecasts were
more optimistic than in November, based on an assumption that the current lockdown
18
24will be gradually eased after Q1 as vaccines are gradually rolled out and life can then
start to go back to some sort of normality. The Bank’s main assumptions were:
• The economy would start to recover strongly from Q3 2021.
• £125bn of savings made by consumers during the pandemic will give a big boost to
the pace of economic recovery once lockdown restrictions are eased and consumers
can resume high street shopping, going to pubs and restaurants and taking holidays.
• The economy would still recover to reach its pre-pandemic level by Q1 2022 despite
a long lockdown in Q1 2021.
• Spare capacity in the economy would be eliminated in Q1 2022.
• The Bank also expects there to be excess demand in the economy by Q4 2022.
• Unemployment will peak at around 7.5% during late 2021 and then fall to about 4.2%
by the end of 2022. This forecast implies that 0.5m foreign workers will have been lost
from the UK workforce by their returning home.
• CPI inflation was forecast to rise quite sharply towards the 2% target in Q1 2021 due
to some temporary factors, (e.g. the reduction in VAT for certain services comes to an
end) and given developments in energy prices. CPI inflation was projected to be close
to 2% in 2022 and 2023.
• The Monetary Policy Report acknowledged that there were downside risks to their
forecasts e.g. from virus mutations, will vaccines be fully effective, how soon can
tweaked vaccines be devised and administered to deal with mutations? There are also
issues around achieving herd immunity around the world from this virus so that a
proliferation of mutations does not occur which prolong the time it takes for the global
economy to fully recover.
• The Report also mentioned a potential upside risk as an assumption had been made
that consumers would only spend £6bn of their savings of £125bn once restrictions
were eased. However, the risk is that that consumers could spend a lot more and more
quickly.
• The Bank of England also removed negative interest rates as a possibility for at least
six months as financial institutions are not ready to implement them. As in six months’
time the economy should be starting to grow strongly, this effectively means that
negative rates occurring are only a slim possibility in the current downturn. However,
financial institutions have been requested to prepare for them so that, at a future time,
this could be used as a monetary policy tool if deemed appropriate. (Gilt yields and
PWLB rates jumped upwards after the removal of negative rates as a key risk in the
short-term.)
• Prior to 4th February, the MPC’s forward guidance outlined that the sequencing of a
withdrawal of monetary policy support would be that Bank Rate would be increased
first: and only once it had reached a certain level, ‘around 1.5%’, before a start would
be made on winding down the stock of asset purchases made under QE. However, the
MPC decided at the February meeting that this policy should be reviewed as to whether
a start should be made first on winding down QE rather than raising Bank Rate.
• The MPC reiterated its previous guidance that Bank Rate would not rise until inflation
was sustainably above 2%. This means that it will tolerate inflation running above 2%
19
25from time to time to balance out periods during which inflation was below 2%. This is
termed average inflation targeting.
Public borrowing was forecast in November 2020 by the Office for Budget
Responsibility (the OBR) to reach £394bn in the current financial year, the highest ever
peace time deficit and equivalent to 19% of GDP. In normal times, such an increase
in total gilt issuance would lead to a rise in gilt yields, and so PWLB rates. However,
the QE done by the Bank of England has depressed gilt yields to historic low levels,
(as has similarly occurred with QE and debt issued in the US, the EU and Japan). This
means that new UK debt being issued, and this is being done across the whole yield
curve in all maturities, is locking in those historic low levels through until maturity. In
addition, the UK has one of the longest average maturities for its entire debt portfolio,
of any country in the world. Overall, this means that the total interest bill paid by the
Government is manageable despite the huge increase in the total amount of debt. The
OBR was also forecasting that the government will still be running a budget deficit of
£102bn (3.9% of GDP) by 2025/26. However, initial impressions are that they have
taken a pessimistic view of the impact that vaccines could make in the speed of
economic recovery. It is now likely that total borrowing will probably reach around
£420bn due to further Government support measures introduced as a result of further
restrictions and the third national lockdown.
Overall, the pace of recovery was not expected to be in the form of a rapid V shape,
but a more elongated and prolonged one. The initial recovery was sharp after quarter
1 saw growth at -3.0% followed by -18.8% in quarter 2 and then an upswing of +16.0%
in quarter 3; this still left the economy 8.6% smaller than in Q4 2019. While the one
month second national lockdown that started on 5th November caused a further
contraction of 5.7% m/m in November, this was much better than had been feared and
showed that the economy is adapting to new ways of working. This left the economy
‘only’ 8.6% below the pre-crisis level. However, a strong recovery from a further
contraction during quarter 1 2021 is expected in the second half of 2021 and is likely
to mean that the economy recovers to its pre-pandemic level during Q1 2022.
Vaccines – the game changer. The Pfizer announcement on 9th November of a
successful vaccine has been followed by approval of the Oxford
University/AstraZeneca and Moderna vaccines. The Government has set a target to
vaccinate 14 million people in the most at risk sectors of the population by 15th
February; it has made good, and accelerating progress in hitting that target. The aim
is also to vaccinate all over 50s by May and all adults by September. This means that
the national lockdown starting in early January, could be replaced by regional tiers of
lighter restrictions, beginning possibly in Q2. At that point, there would be less reason
to fear that hospitals could become overwhelmed any more. Effective vaccines have
radically improved the economic outlook so that it may now be possible for GDP to
recover to its pre-virus level as early as Q1 2022. These vaccines have enormously
boosted confidence that life could largely return to normal during the second half of
2021. With the household saving rate having been exceptionally high since the first
lockdown in March, there is plenty of pent-up demand and purchasing power stored up
for when life returns to normal.
Provided that both monetary and fiscal policy are kept loose for a few years yet, then
it is still possible that in the second half of this decade, the economy may be no smaller
than it would have been if COVID-19 never happened. The major concern though, is
that new mutations of the virus might defeat the current batch of vaccines. However,
work is already advanced to produce what may well become annual revaccinations
each autumn with updated vaccines. In addition, countries around the world have
ramped up vaccine production facilities and vastly improved testing regimes; they are
therefore now much better equipped to deal effectively with any new outbreaks of
mutations of this virus.
20
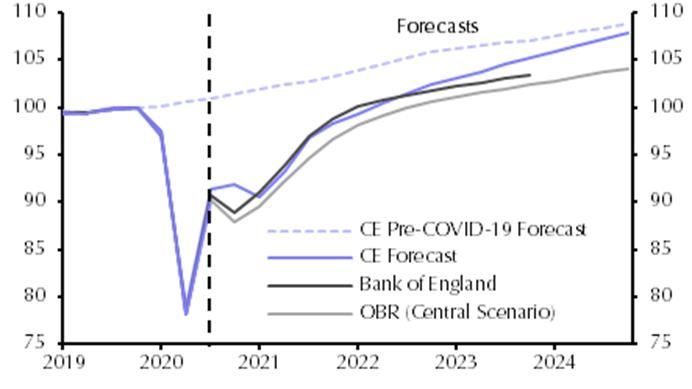
26Chart: Level of real GDP (Q4 2019 = 100)
This recovery of growth which eliminates the effects of the pandemic by about the
middle of the decade, would have major repercussions for public finances as it would
be consistent with the government deficit falling to around 2.5% of GDP without any
tax increases. This would be in line with the OBR’s most optimistic forecast in the
graph below, rather than their current central scenario which predicts a 4% deficit due
to assuming much slower growth. However, Capital Economics forecasts in the graphs
above and below, assumed that politicians do not raise taxes or embark on major
austerity measures and so, (perversely!), depress economic growth and recovery.
Chart: Public Sector Net Borrowing (as a % of GDP)
21
27 There will still be some painful longer term adjustments as e.g. office space and travel
by planes, trains and buses may not recover to their previous level of use for several
years, or possibly ever, even if vaccines are fully successful in overcoming the current
virus. There is also likely to be a reversal of globalisation as this crisis has exposed
how vulnerable long-distance supply chains are. On the other hand, digital services are
one area that has already seen huge growth.
Brexit. The final agreement of a trade deal on 24.12.20 has eliminated a significant
downside risk for the UK economy. The initial agreement only covers trade so there is
further work to be done on the services sector where temporary equivalence has been
granted in both directions between the UK and EU; that now needs to be formalised on
a permanent basis. However, it is evident from problems with trade flows at ports in
January and February, that work needs to be done to smooth out the issues and
problems that have been created by complex customs paperwork, in order to deal with
bottle necks currently being caused.
Fiscal policy. In December, the Chancellor made a series of announcements to provide
further support to the economy: -
An extension of the COVID-19 loan schemes from the end of January 2021 to the
end of March.
The furlough scheme was lengthened from the end of March to the end of April.
The Budget on 3.3.21 will lay out the “next phase of the plan to tackle the virus and
protect jobs”. This does not sound like tax rises are imminent, (which could hold
back the speed of economic recovery).
The Financial Policy Committee (FPC) report on 6.8.20 revised down the expected
credit losses for the banking sector to “somewhat less than £80bn”. It stated that in its
assessment, “banks have buffers of capital more than sufficient to absorb the losses
that are likely to arise under the MPC’s central projection”. The FPC stated that for real
stress in the sector, the economic output would need to be twice as bad as the MPC’s
projection, with unemployment rising to above 15%.
The balance of risks to the UK:
The overall balance of risks to economic growth in the UK is now probably more to
the upside but is subject to major uncertainty due to the virus - both domestically
and its potential effects worldwide.
There is relatively little domestic risk of increases or decreases in Bank Rate in the
near-term, nor significant changes in shorter-term PWLB rates. The Bank of
England has effectively ruled out the use of negative interest rates anytime soon but
increases in Bank Rate are likely to be some years away given the underlying
economic expectations. However, it is always possible that safe haven flows, due to
22
28unexpected domestic developments and those in other major economies, could
impact gilt yields, (and so PWLB rates).
6. Investment and Borrowing Rates
6.1. Investment returns are likely to remain exceptionally low during 2021/22 with little increase
in the following two years.
6.2. Borrowing interest rates fell to historically very low rates as a result of the COVID crisis and
the quantitative easing operations of the Bank of England: Indeed, gilt yields up to six years
were negative during most of the first half of 2020/21. The policy of avoiding new borrowing
by running down spare cash balances has served local authorities well over the last few
years. The unexpected increase of 100 bps in PWLB rates on top of the then current margin
over gilt yields of 80 bps in October 2019, required an initial major rethink of local authority
treasury management strategy and risk management. However, in March 2020, the
Government started a consultation process for reviewing the margins over gilt rates for
PWLB borrowing for different types of local authority capital expenditure.
6.3. As a consequence of these increases in margins, many local authorities decided to refrain
from PWLB borrowing unless it was for HRA or local infrastructure financing, until such time
as the review of margins was concluded.
6.4. On 25 November 2020, the Chancellor announced the conclusion to the review of margins
over gilt yields for PWLB rates; the standard and certainty margins were reduced by 1%
but a prohibition was introduced to deny access to borrowing from the PWLB for any local
authority which had purchase of assets for yield in its three year capital programme.
6.5. Borrowing for capital expenditure - greater value can be obtained in borrowing for shorter
maturity periods so the Council will assess its risk appetite in conjunction with budgetary
pressures to reduce total interest costs. Longer-term borrowing could also be undertaken
for the purpose of certainty, where that is desirable, or for flattening the profile of a heavily
unbalanced maturity profile.
6.6. Against this background and the risks within the economic forecast, caution will be adopted
with the 2021/22 treasury operations. The Chief Finance Officer (S151) will monitor interest
rates in financial markets and adopt a pragmatic approach to changing circumstances.
6.7. There will remain a cost of carry to any new long-term borrowing that temporarily increases
cash balances. This revenue cost is the difference between borrowing costs and investment
returns.
7. Borrowing Strategy
7.1. The Council is currently maintaining an under-borrowed position, where the CFR balance
is greater than gross debt, see Indicator 2, and chart on page 13. This is in line with the
agreed strategy that the Council’s cash balances be used to fund capital expenditure before
additional borrowing is undertaken. This strategy is prudent as investment returns are low
and counterparty risk is still an issue that needs to be considered.
7.2. The capital programme consists of three main types of capital projects:
Invest to Save – Self Funding Schemes
Specific Schemes – e.g. School Extensions
23
29 Rolling Capital Projects e.g. Enhancing current assets
7.3. Any borrowing decisions will be reported to the appropriate decision-making body at the
next available opportunity.
7.4. The MTFS is based on the following borrowing strategy for the next three years. The
borrowing strategy is under constant review throughout the year monitoring changes in
interest rates and borrowing opportunities. The proposed strategy for 2021/22 financial
year is:
a) To consider the rescheduling (early redemption and replacement) of loans to maximise
interest rate savings and possible redemption discounts.
b) Significant risk of a sharp fall in long- and short-term rates may arise. In this case long-
term borrowings will be postponed, and potential rescheduling from fixed rate funding
into short-term borrowing will be considered.
c) Significant risk of a much sharper rise in long and short-term rates than currently
forecast may arise. This may arise due to a greater than expected increase in world
economic activity or a sudden increase in inflation risks. In this case the portfolio
position will be re-appraised with the likely action that fixed rate funding will be drawn
whilst interest rates were still relatively cheap.
d) To maintain an appropriate balance between PWLB, Local Authority and other market
debt in the debt portfolio and a balance in the maturity profile of debt.
e) To give full consideration to other debt instruments e.g., Local Authority Bonds as an
alternative to PWLB borrowing. Due regard will be given to money laundering
regulations. The Council is monitoring the development of the scheme and may
participate if this proves beneficial.
8. New Borrowing Approaches to Be Considered
8.1. To realign the loan maturity profile with the rate of the existing CFR debt will be financed
by taking out shorter term Local Authority Loans. In the current climate this will reduce
interest costs in the short term.
8.2. Currently the PWLB Certainty Rate is set at gilts + 80 basis points for both HRA and non-
HRA borrowing. However, consideration may still need to be given to sourcing funding at
cheaper rates from financial institutions (primarily insurance companies and pension funds
but also some banks, out of spot or forward dates) and the Municipal Bonds Agency. The
Council’s advisors will keep us informed as to the relative merits of each of these alternative
funding sources.
8.3. Maturing long-term debt is replaced by new borrowing. To achieve long-term financial
sustainability the Council should aim to reduce its overall debt and the associated financing
costs including interest. A high value of outstanding debt represents a financial risk
because of potential interest rate changes.
8.4. The use of Capital receipts or S106 receipts to make MRP is a one-off revenue saving.
Using these funds in this way means they are not available to fund Capital assets and
reduce the overall borrowing requirement.
8.5. Interest rates are liable to change. In the event of significant changes, the Council seeks to
avoid an increased revenue cost on its capital financing charges.
24
308.6. The Treasury Management Strategy uses the planned Capital Programme to calculate the
borrowing requirement. Typically, the Council does not spend at the planned level in any
financial year.
8.7. Link Group have a product that will allow the Council to borrow from the market at current
interest rates with a small premium but not draw down the funds until they are required -
‘forward borrow’.
9. Treasury Debt Prudential Indicators
9.1. There are three debt treasury indicators which ensure debt structure remains within
appropriate limits. This manages risk and reduces the impact of any adverse movement in
interest rates.
9.2. Indicator 7 – Upper limit on fixed interest rate exposure. This identifies a maximum limit for
fixed interest rates based upon the debt position net of investments. This has been set at
100% of the borrowing requirement.
9.3. Indicator 8 - Upper limit on variable rate exposure. This identifies a maximum limit for
variable interest rates based upon the debt position net of investments. This has been set
at 25% of the borrowing requirement.
2019/20 2020/21 2021/22 2022/23 2023/24
Interest Rate Exposure
Actual Est Est Est Est
(Upper Limits)
£m £m £m £m £m
(7) Limits on fixed interest rate net debt 477.6 712.1 744.4 744.5 703.4
% of fixed interest rate exposure 100% 100% 100% 100% 100%
(8) Limits on variable interest rate on net
- 178.0 186.1 186.1 175.9
debt
% of variable interest rate exposure 0% 25% 25% 25% 25%
9.4. Indicator 9 - Maturity structure of borrowing. These gross limits are set to reduce the
Council’s immediate exposure to large fixed rate sums falling due for refinancing.
Maturity structure of borrowing Upper Limit As at 8 February 2021
Under 12 months 40% 12.33%
12 months to 2 years 40% 2.74%
2 years to 5 years 80% 4.07%
5 years to 10 years 80% 4.42%
10 years and above 100% 76.44%
9.5. The following chart shows the Council’s debt maturity profile by financial year as at 8
February 2021, and the above indicator limits based on the Operational Boundary
compared with current perfomance:
25
3110. Policy on Borrowing in Advance of Need (Future Capital Expenditure)
10.1. The Council will not borrow more than it requires, or in advance of its needs, purely in order
to profit from the investment of the extra sums borrowed. However, at any time the Council
may obtain a loan or other financing at what are considered advantageous terms in
anticipation of future capital expenditure. The money borrowed will be invested temporarily.
The Council may also borrow in the day-to- day management of its cash flow operations or
as an alternative to redeeming higher yielding investments.
10.2. The Council will ensure there is a clear link between the capital programme across the
future years and the maturity profile of the existing debt portfolio which supports the need
to take funding in advance of capital expenditure.
10.3. The Council will ensure the ongoing revenue liabilities created, and the implications for the
future plans and budgets have been considered and factored into the MTFS.
10.4. Consideration will be given to the alternative interest rate bases available, the most
appropriate periods to fund and repayment profiles to use.
11. Debt Rescheduling on Existing Debt Portfolio
11.1. Rescheduling of current borrowing in our debt portfolio is unlikely to occur as there is still a
very large difference between premature redemption rates and new borrowing rates, even
though the general margin of PWLB rates over gilt yields was reduced by 100 bps in
November 2020.
12. Investment Strategy Principles
12.1. The Council’s investment priorities will be security first, portfolio liquidity second and then
yield, (return). The Council will aim to achieve the optimum return (yield) on its investments
commensurate with proper levels of security and liquidity and with the Council’s risk
appetite. In the current economic climate it is considered appropriate to keep investments
short term to cover cash flow needs. However, where appropriate (from an internal as well
as external perspective), the Council will also consider the value available in periods up to
12 months with high credit rated financial institutions, as well as wider range fund options.
26
3212.2. The Council’s investment policy has regard to the following: -
MHCLG’s Guidance on Local Government Investments (“the Guidance”)
CIPFA Treasury Management in Public Services Code of Practice and Cross Sectoral
Guidance Notes 2017 (“the Code”)
CIPFA Treasury Management Guidance Notes 2018
12.3. The MHCLG and CIPFA have extended the meaning of ‘investments’ to include both
financial and non-financial investments. This report deals solely with financial investments,
(as managed by the treasury management team).
13. Investment Counterparty Selection Criteria and Financial Investment Strategy
13.1. As the Council has run down its cash balances, surplus cash will be generated from cash
flow movements e.g., a grant received in advance of spend or from borrowing in advance
of need. Therefore, investment activity will be kept to a minimum.
13.2. However, where it is necessary for investments to be undertaken in order to manage the
Council’s cash flows, the Council’s primary principle is for the security of its investments.
After this main principle the Council will ensure that:
It maintains a policy covering both the categories of investment types it will invest in,
criteria for choosing investment counterparties with adequate security and monitoring
their security.
It has sufficient liquidity in its investments. For this purpose, it will set out procedures for
determining the maximum periods for which funds may prudently be committed. These
procedures also apply to the Council’s prudential indicators covering the maximum
principal sums invested.
13.3. The Chief Finance Officer (S151) will maintain a counterparty list in compliance with the set
out below. Any revision of the criteria will be submitted to Council for approval as
necessary.
13.4. The Councils minimum criteria will apply to the lowest rating for any institution according to
the type of investment account being used. For instance, the credit rating criteria for the
use of the Council’s call accounts and Money Market Funds, which are used for short-term
investments only, will use the Short-Term credit ratings in the table shown within 13.5. If
an institution is rated by the three credit agencies and two meet the Council’s criteria and
the other one does not, the institution will fall outside the lending criteria. This complies
with a CIPFA Treasury Management Panel recommendation in March 2009 and the CIPFA
Treasury Management Code of Practice 2017.
13.5. In order to minimise the risk to investing, the Council has clearly stipulated the minimum
acceptable credit quality of counterparties for inclusion on the lending list. The Council
uses the creditworthiness service provided by Link Group which uses ratings from all three
rating agencies, Fitch, Moody’s and Standard and Poor’s, as well as Credit Default Swap
(CDS) spreads. Link Group monitors ratings on a real time basis and notifies clients
immediately on any rating changes or possible downgrades. Minimum Credit Ratings
Criteria – further explanations are given in Annex 1.
Minimum Credit Ratings for Group 2 Banks
Agency Short-Term Long-Term
Fitch F1 AA+
27
33You can also read