Ukraine One year of war in - Assessing the impact on global trade and development - World Trade Organization
←
→
Page content transcription
If your browser does not render page correctly, please read the page content below
One year of war in
   Ukraine
Assessing the impact on global
   trade and development

About the WTO

The World Trade Organization is the international body dealing
with the global rules of trade between nations. Its main function
is to ensure that trade flows as smoothly, predictably and freely
as possible, with a level playing field for all its members.

       This assessment note has been prepared by WTO Secretariat staff.
       The opinions expressed in this assessment note are those of its
       authors. They are not intended to represent the positions or opinions
       of the WTO or its members and are without prejudice to members’
       rights and obligations under the WTO.

       The designations employed in this publication and the presentation of
       material therein do not imply the expression of any opinion whatsoever
       on the part of the WTO concerning the legal status of any country,
       area or territory or of its authorities, or concerning the delimitation of
       its frontiers.

Cover image: Bunkering of a dry cargo ship with grain, Odessa, Ukraine.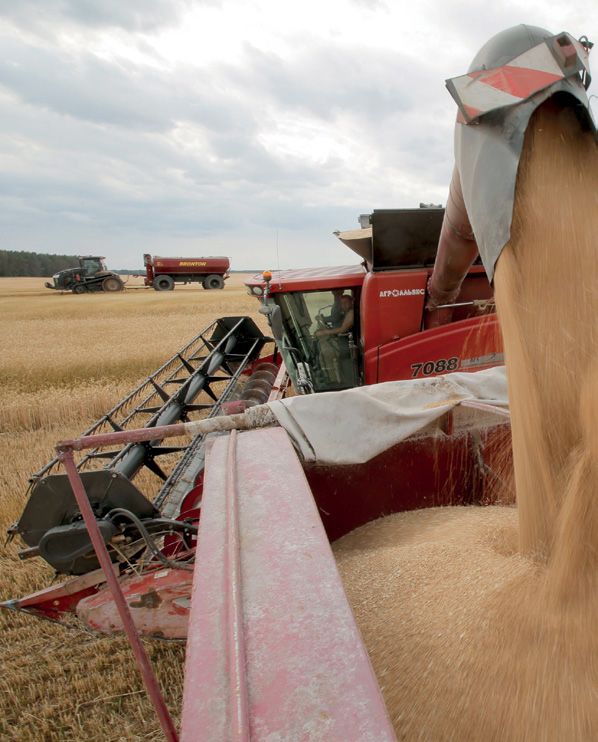
Contents
Executive summary                                            2

1 Introduction                                               4

2 Analytical assessment of the trade and economic effects    6

3 Way forward and policy implications                       18

Bibliography                                                20

                                                             1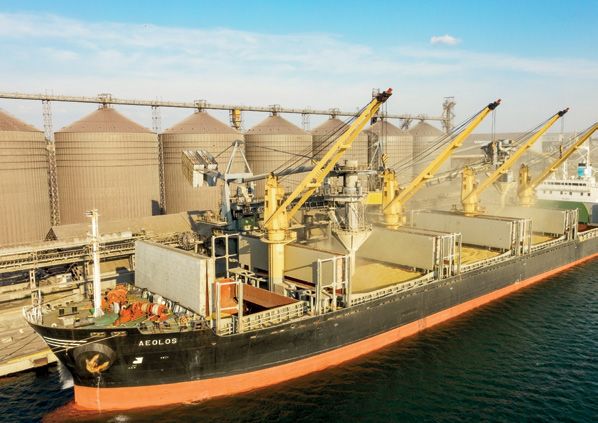
ON E YEAR OF WAR I N U KRAI N E: ASSESSI NG TH E I M PACT ON G LOBAL TRADE AN D DEVE LOPM E NT

Executive summary
The war in Ukraine is causing immense human                  4 per cent year-on-year in the second quarter of 2022,
suffering. At the same time, it has delivered another        when measured in terms of trade in intermediate goods.
severe challenge to the global economy already strained      Trade in products and by countries greatly affected by
by the impact of the COVID-19 pandemic. However, the         the war was remarkably resilient. Even in the short run
multilateral trading system has withstood this disruption    and for unexpected disruptions, alternative suppliers
relatively well so far.                                      filled in the gaps – at least for the majority of products
                                                             affected by the conflict.
Global trade continued to increase in 2022,
including for products greatly affected by the               For the longer term, new simulations highlight
war, highlighting the resilience of the multilateral         the importance of strengthening the multilateral
trading system. Early estimates suggest that trade           trading system. The latest simulations run by WTO
growth was above the WTO trade forecast from April           economists modelling different scenarios for the global
2022 (around 3 per cent) and substantially higher than       economy show that the gains from further multilateral
the more pessimistic predictions for 2022. This stability    liberalization are large. In line with this, the opportunity
is also reflected in trade in supply chains, which grew by   costs of decoupling into two rival blocs relative to

    Port of Odessa, Ukraine.

2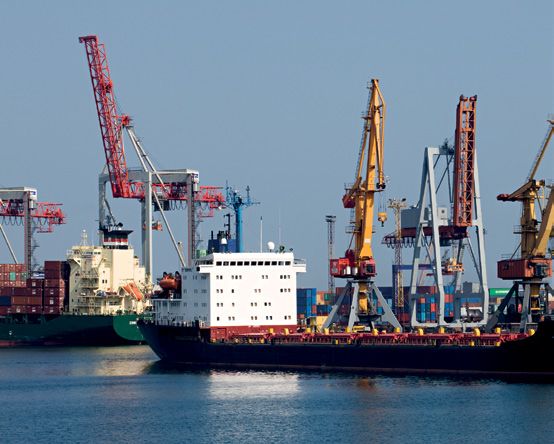
EXECUTIVE SU M MARY

more liberalization are estimated at 8.7 per cent of real        Ukraine’s exports collapsed by 30 per cent in 2022
income at the global level, varying between 6.4 per cent         in value terms. The drop was relatively consistent
for developed countries, 10.1 per cent for developing            across trade partners, although some neighbouring
countries and more than 11.3 per cent for least-                 countries, such as Hungary and Poland, increased
developed countries.                                             their imports from Ukraine. This was driven mostly
                                                                 by increased imports of agricultural products such
The benefits of reglobalization are not only                     as oilseeds, fats and oils, meat and dairy. Exports of
about income gains but also about resilience and                 cereals, which are central to the food security of many
security for the supply of goods. The positive trade             African economies, declined by 14.9 per cent, forcing
performance of countries dependent on imports from               these economies to adjust their trade patterns.
the conflict region was facilitated by their ability to switch
their import supply to unaffected economies. For example,        Increases in prices led Russia’s exports to expand
Ethiopia used to rely on Ukraine and Russia for 45 per           by 15.6 per cent in value terms, but estimates
cent of its wheat imports. The country reacted to the loss       suggest that Russia’s export volume might have
of most supplies from these two countries by increasing          slightly declined. The increase in Russia’s exports
purchases from other producers, including the United             in value terms is driven mostly by goods in the primary
States (shipments increased by 20 per cent in volume             sector such as fuels, fertilizers and cereals. The relatively
terms) and Argentina, which supplied 21 per cent of              limited increase in trade values in combination with the
Ethiopia’s imported wheat, up from zero in the previous year.    sharp increase in prices for these goods suggests a
                                                                 slight decline in export volume. In contrast, trade flows
                                                                 have fallen sharply for industrial goods, such as motor
                                                                 vehicles, pharmaceuticals and aircraft, where sanctions
                                                                 are likely to be particularly restrictive.

                                                                 Prices rose for goods most affected by the war
                                                                 but by less than expected at the beginning of
                                                                 the war. Among these products, prices increased
                                                                 between 4.4 per cent for palladium – a key input in the
                                                                 production of catalytic converters in the automotive
                                                                 sector – and 24.2 per cent for maize. While these price
                                                                 increases are substantial, they are significantly lower
                                                                 than the gloomiest predictions. Simulations run by WTO
                                                                 economists in a scenario of cascading export restrictions
                                                                 on food forecast wheat prices increasing by up to
                                                                 85 per cent in some low-income regions. However,
                                                                 the actual increase was 17 per cent.

                                                                 The relative restraint by WTO members in
                                                                 imposing export restrictions likely played a key
                                                                 role in keeping price increases in check.
                                                                 The WTO’s latest trade monitoring report, covering
                                                                 mid-October 2021 to mid-October 2022, shows
                                                                 that regular (non-COVID-related) import-facilitating
                                                                 measures introduced by WTO members covered
                                                                 US$ 1,038.4 billion of trade, far exceeding the trade
                                                                 coverage of import-restrictive measures (US$ 163.5
                                                                 billion). This, in combination with the limited price
                                                                 increases in grains, suggests that the success of the
                                                                 WTO’s 12th Ministerial Conference, which resulted in
                                                                 the Ministerial Declaration on the Emergency Response
                                                                 to Food Insecurity, has had a meaningful impact on
                                                                 reducing food insecurity.

                                                                                                                            3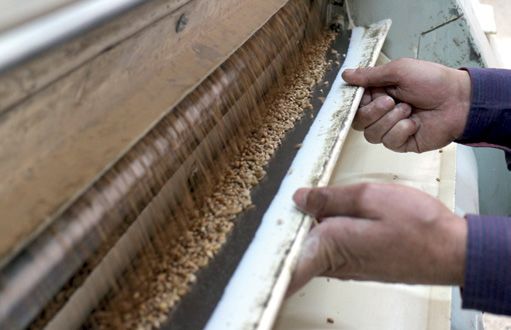
ON E YEAR OF WAR I N U KRAI N E: ASSESSI NG TH E I M PACT ON G LOBAL TRADE AN D DEVE LOPM E NT

1           Introduction

The war in Ukraine started one year ago. The human
and economic costs are enormous and growing.
Through trade, particularly in food and some raw
                                                             Trade is an effective
materials, its effects have spread globally, manifested by   tool to cushion the effects
supply chain disruptions and increased food insecurity.
Early assessments of the impact of the war, including
                                                             of crises.
a WTO Secretariat note (WTO, 2022), laid out different
scenarios for spill-overs to other regions and identified
countries and sectors at heightened risk. After one
year of war, the WTO Secretariat has reassessed the          vegetable oils. As a result, the direst scenarios foreseen
situation and examined how the multilateral trading          at the onset of the war have so far not materialized.
system has reacted to the crisis.                            Instead, a flexible, open and rules-based multilateral
                                                             trading system, supported by a restraint in the imposition
This note examines analytically how global trade and         of export restrictions by many commodity exporters, has
the trade of Russia and Ukraine have evolved over the        been able to respond and adjust.
past year. It looks at how countries highly dependent
on Russian or Ukrainian exports of agricultural and          In line with this, the results of simulations run by WTO
primary goods have responded to the crisis, and how          economists indicate that reinvesting in multilateral trade
prices and trade in goods greatly affected by the war        liberalization can create by far the biggest income gains
have developed. Tracking these impacts is important to       compared to fragmented trade scenarios (Métivier et
understand and address the repercussions of the war for      al., 2023). The opportunity cost of foregoing further
developing economies. It can also reveal how resilient       multilateral liberalization and moving to geopolitical
the trading system is and help to identify potential         rivalry instead is estimated at 8.7 per cent at the global
bottlenecks.                                                 level, varying between 6.4 per cent for developed
                                                             countries, 10.1 per cent for developing countries and
This note also studies trade policy responses in the         more than 11.3 per cent for least-developed countries.
short run and assesses potential long-term impacts           This is particularly important as the price hikes triggered
of the war under different scenarios. While the              by the polycrises of war and pandemic, in combination
immediate impact of the war is most severe on                with other macroeconomic trends, have put a severe
Ukraine, any disintegration of the multilateral trading      strain on the finances of developing and least-developed
system in response could significantly harm growth           countries. Additional negative effects from fragmentation
prospects around the world. Mapping out these                would significantly worsen their situation.
impacts enables policymakers to compare the effects
of different policy options.                                 Overall, the assessment suggests that trade is an
                                                             effective tool to cushion the effects of crises. However,
The analytical assessment shows that the multilateral        this requires a multilateral trading system that remains
trading system has been relatively resilient. While prices   open and inclusive. Fragmentation and nearshoring
for many affected commodities have increased steeply         would severely limit a country’s potential to substitute
in the aftermath of the war, importers were able to          imports from sourcing partners, as observed in 2022.
substitute both geographically and across products.          For example, Ethiopia’s reorientation of wheat imports
Supply from the Black Sea region, for instance, has          away from the Black Sea region might not have been
been replaced by imports from other sources including        possible in a trading system divided into separate blocs.
Argentina, the European Union and the United States.
Similarly, imports of wheat and sunflower oil seem
to have been replaced by imports of rice and other

4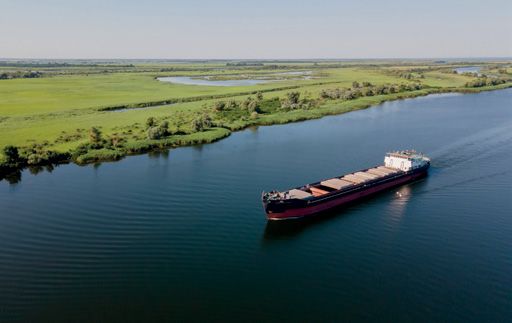
A container ship approaches a storm
          on the Suez Canal, Egypt.

                                5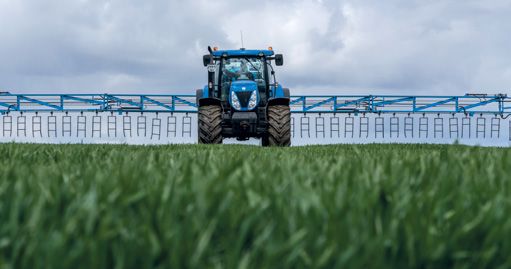
ON E YEAR OF WAR I N U KRAI N E: ASSESSI NG TH E I M PACT ON G LOBAL TRADE AN D DEVE LOPM E NT

2              Analytical assessment of the
               trade and economic effects
Global macroeconomic                                                While most of these predictions materialized to
and trade effects                                                   some degree, worst case scenarios have largely
                                                                    been avoided. Instead, output and trade have been
Economic forecasts from the WTO and other                           remarkably resilient. The most recent estimates put
organizations were downgraded following the outbreak                output growth in the middle of its expected range, while
of war in Ukraine last year. Shortly before the start               trade growth exceeded the WTO forecast in April 2022
of hostilities, the International Monetary Fund (IMF)               (see Figure 1).2 The IMF World Economic Outlook of
estimated that world GDP at purchasing power parity                 October 2022 forecast GDP growth in 2022 to be
would grow 4.4 per cent in 2022 and that the volume of              3.2 per cent, later revised up to 3.4 per cent in January
goods trade would increase 6.0 per cent (IMF, 2022a).               2023 (IMF, 2022b, 2023). Their GDP forecast for 2023
With no fresh economic data available at the onset of               was revised up at the same time, from 2.7 per cent to
the conflict, WTO economists used a simulation model                2.9 per cent.
to calculate its likely impact. They estimated that the war
would reduce world GDP growth by between 0.7 and
1.3 percentage points, bringing it somewhere between
3.1 per cent and 3.7 per cent. Meanwhile, growth in                 Ukraine’s total exports
the trade of goods was expected to halve, bringing the
                                                                    decreased by 30% from
WTO’s forecast of October 20211 down from 4.7 per
cent to between 2.4 and 3.0 per cent, with pessimistic              2021 to 2022.
scenarios putting trade growth as low as 0.5 per cent.

    FIGURE 1

    World merchandise trade volume (Index, 2015 = 100)
    122

    120

    118

    116

    114

    112

    110
                 Q1               Q2               Q3          Q4               Q1            Q2             Q3
                                         2021                                                 2022
                      WTO forecast in April 2022        Lowest WTO prediction in April 2022          Actual growth

    Source: WTO estimates.

6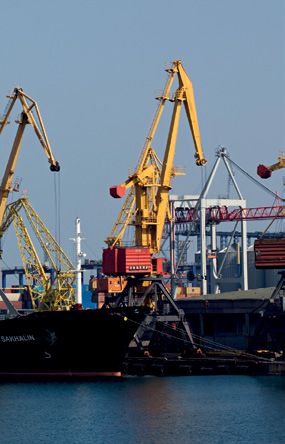
ANALYTICAL ASSESSM E NT OF TH E TRADE AN D ECONOM IC E FFECTS
The WTO’s merchandise trade forecast for 2022 was Russia. When comparing exports for the same March to
also revised upwards in October to 3.5 per cent, up November periods in 2021 and 2022 and for the same
from 3.0 per cent in April.3 Trade performance was reporting importers, Ukraine’s total exports decreased
better than expected, which can be attributed to several by 30.0 per cent, while Russia’s exports increased by
factors, including relatively strong consumer demand as 15.6 per cent. These aggregate figures hide substantial
labour markets remained strong in advanced economies. variation in the responses across products and importers.
Transport and supply chains pressures also eased in Russia’s increase in exports is driven primarily by goods
the second half of 2022, while shipping rates declined in the primary sector, such as fuels, fertilizers and cereals
and commodity prices receded. Despite these positive (see Figure 2). However, the relatively limited increase
signals, trade growth in 2023 is still likely to be sluggish, in trade values in combination with the sharp increase
since monetary policy tightening takes effect with long in prices for these goods suggests that Russia’s export
and variable lags. The WTO’s current forecast of 1.0 volume might have declined slightly.
per cent growth in merchandise trade in 2023 will be
revised in April.
With regard to global supply chains, world exports of
intermediate goods, a proxy for supply chain trade, grew
Russia’s exports
4 per cent year-on-year in the second quarter of 2022 increased by 15.6%
to US$ 2.5 trillion.4 The overall growth, while slower
from 2021 to 2022.
than the increase recorded in the same period a year
ago, continues to indicate stable activity in global supply
chains. Hence, firms appear to have responded quickly
and flexibly to disruptions from the war, so that they do
not show up in the aggregate data. Trade values for industrial goods have fallen. This holds
for non-complex goods, such as wood products and
In sum, the multilateral trading system has withstood the steel, and for goods dependent on complex supply
disruption by the war. Firms appear to have adjusted chains and inputs from advanced economies, such as
quickly and effectively. Analysing the response of motor vehicles, pharmaceuticals and aircraft, where
countries and products greatly affected by the war can sanctions are likely to be particularly restrictive.
shed light on how these adjustments have taken place
and on how the multilateral trading system contributed Figure 2 also illustrates that importers have reacted
to these developments. very differently in the past year. While some countries
reduced their imports significantly, such as the United
The impact on Russian and Ukrainian States, the United Kingdom, Poland, the Republic of
exports Korea and Finland, others increased their imports, such
as China, India and Türkiye. This corresponds partly
Examining how Russian and Ukrainian exports have to whether or not countries imposed sanctions.
developed during the war has its caveats, as direct data However, some countries which imposed sanctions,
are not observable in the case of Russia and are likely such as Italy, Greece and France, also saw their
distorted in the case of Ukraine. Instead, it is necessary imports increase due to the temporary exemption of
to rely on so-called mirror estimates obtained from fuels from the sanctions coupled with price increases
importers reporting trade with the two countries. in oil and gas.
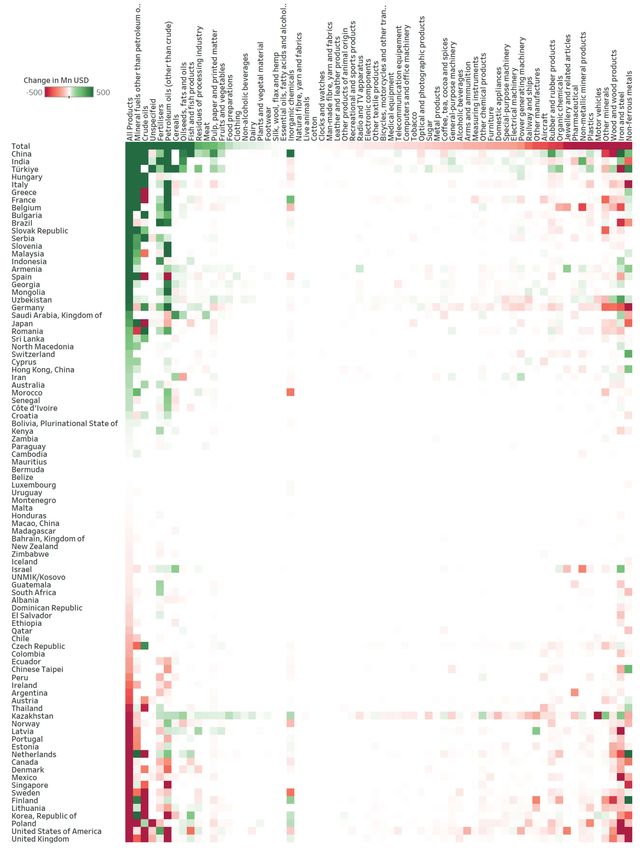
In addition, it is less reasonable to use global average Ukraine’s decrease in exports of 30 per cent was
prices to obtain volume estimates due to the presence relatively consistent across trade partners, although
of sanction and other country-specific measures in place some neighbouring countries, such as Poland and
that might drive a wedge between global prices and Hungary, increased their sourcing from Ukraine. This
prices charged by Russia and Ukraine. As a result, the was driven mostly by increased imports of agricultural
focus is on trade values, which do not necessarily reflect products such as oilseeds, fats and oils, meat and dairy
changes in traded quantities. (see Figure 3). Exports of cereals, which are central to
the food security of many African economies, declined
Mirror estimates indicate that the war has had a by 14.9 per cent, which forced these economies to
substantially more detrimental impact on Ukraine than on adjust their trade patterns as discussed below.
7ON E YEAR OF WAR I N U KRAI N E: ASSESSI NG TH E I M PACT ON G LOBAL TRADE AN D DEVE LOPM E NT
FIGURE 2
Changes in Russia’s export values, 2021-2022 (In US$ million, March to November)
trans
Change in US$ million
-500 500
Unspecified
Fertilizers
Note: The vertical axis shows economies sorted by total share of products imported from Russia, while the horizontal axis shows product
categories. The colour variation represents the change in US dollar value of products imported from Russia by individual economies.
The darker the colour, the greater the change of import value from Russia.
Source: WTO estimates based on monthly data compiled by Trade Data Monitor. Exports from Ukraine and Russia are calculated based on
mirror imports statistics from the same 90 economies.
8ANALYTICAL ASSESSM E NT OF TH E TRADE AN D ECONOM IC E FFECTS
FIGURE 3
Ukraine’s export values by importer and product, 2022
(In US$ million; year-on-year change March to November 2022 in per cent)
Germany Bulgaria Spain
Hungary US$ 1,764 US$ 1,399 US$ 1,182
(-6.9%) (+77.2%) (+0.8%)
US$ 2,115
(+29.9%) USA Netherlands Austria
Italy
Poland US$ 1,012
US$ 1,179 (-36.6%)
US$ 952
(-57.2%)
US$ 688
(-14.0%)
US$ 4,910 (-60.7%)
France Belgium Lithuania
China
(+22.4%) India US$ 460
(-34.1%)
US$ 420
(-35.2%)
US$ 375
(-11.1%)
US$ 2,078 Slovak US$ 580
(-67.7%)
Republic Denmark Japan Georgia
(-70.4%) US$ 1,154
Saudi
Arabia,
Kazakhstan US$ 174
US$ 203 (-6.9%)
US$ 172
(-71.3%)
US$ 164
(-54.4%)
Kingdom of (-44.3%)
US$ 305
(+39.9%) UK
(-47.1%) Canada
Slovenia US$ 144
Uzbekistan Serbia
US$ 133 US$ 128 Switzerland
US$ 119
US$ 187 (-2.7%) (-63.4%) (-41.3%)
US$ 574
(-37.7%)
Türkiye (+56.3%) Chinese
(-34.1%) Croatia Malaysia Taipei Indonesia Norway
Israel US$ 56 US$ 53 US$ 50 US$ 48 US$ 47
Romania
Estonia (+46.5%) (-58.7%) (-95.0%) (-19.8%)
(-55.7%)
US$ 265 US$ 78
US$ 2,997
Portugal (-23.9%) Morocco Aus.
Brazil Ethiopia Thailand Qatar
(-55.2%) US$ 179 US$ 54
US$ 38 US$ 32 US$ 32 US$ 31
US$ 44 (-79.1%) (-74.4%) (-77.1%) (-70.6%)
US$ 1,765
(-86.4%) (-39.5%)
Czech Republic Korea, (-6.9%) Sweden Sri
US$ 68 Cyprus
Republic of Lanka
(-8.4%) US$ 1,085 (-18.6%) US$ 53 US$ 41
Latvia
(+42.6%)
(+167.2%) (-20.1%)
Greece
US$ 494 US$ 228 US$ 174 Armenia Singapore North
(-9.1%) (+152.3%) (+6.9%) (-2.4%)
US$ 57 US$ 53 Mace.
US$ 38
(-49.4%) (+127.3%) (-66.5%)
Change in %
-50%< >50%
Other minerals Wood and
wood products
US$ 2,509 US$ 1,715
(-59.2%) (-2.7%)
Domestic Other
Meat appliances manufactures
US$ 599 US$ 541 US$ 451
(+32.4%) (-4.6%) (+41.4%)
Cereals Electrical
Clothing
General
purpose Inorganic
US$ 5,405 machinery machinery chemicals Dairy
US$ 315 US$ 275 US$ 227 US$ 222
US$ 1,208 Unspecified
(-11%) (-8.5%) (-49.0%) (+67.4%)
(-14.9%) (-7.0%) Special Non- Other
US$ 438 purpose alcoholic chemical Non-ferrous
(-40.4%) Plastics machinery beverages products metals
US$ 213 US$ 190 US$ 184 US$ 178 US$ 170
Residues of (-61.0%) (-24.0%) (-34.8%) (-16.6%) (-49.0%)
Pulp, paper
processing Non-metallic
Food
preparations
and printed
Tobacco
Railway
and ships
Oilseeds,
matter
mineral
industry Fruits and products
US$ 168
(-34.9%)
US$ 146
(-41.6%)
US$ 144
(-70.6%)
US$ 129
(-25.1%)
US$ 209
US$ 813 vegetables (-39.4%)
Other products
Organic
US$ 432
fats and oils
Footwear Pharma. chemicals
(-35.7%) of animal origin
Iron and steel
Fertilizers US$ 100 US$ 94 US$ 92
(-15.9%) US$ 167 US$ 117 (-16.1%) (-36.4%) (-56.3%)
Other textile (+28.1%) (-76.8%)
Coffee, tea,
products
Mineral fuels
US$ 7,810
cocoa and
US$ 203
US$ 3,046
spices
Metal US$ 86
Sugar
other than (-28.9%)
US$ 165
products
US$ 115
(-42.5%)
(+13.9%) Alcoholic
petroleum oils (+2.8%)
beverages
(+30.4%)
Furniture Telecom.
(-71.2%)
US$ 74
Power
US$ 661 US$ 410
equipement
US$ 197
generating
machinery
Recreational
and sports
products
(-7.7%)
Motor
(+31.1%)
vehicles
(-25.2%) (-32.0%) US$ 156
(-7.7%)
US$ 103
(+29.2%)
US$ 67
(+33.1%)
Note: The colour variation represents the change in US dollar value of products imported from Ukraine by individual economies.
The darker the colour, the greater the year-on-year change in import value from Ukraine.
Source: WTO estimates based on monthly data compiled by Trade Data Monitor. Exports from Ukraine and Russia are calculated
based on mirror imports statistics from the same 90 different economies.
9ON E YEAR OF WAR I N U KRAI N E: ASSESSI NG TH E I M PACT ON G LOBAL TRADE AN D DEVE LOPM E NT
The war has stopped commercial traffic
on the Dnipro, the longest river in Ukraine.
On the import side, Russia and Ukraine both saw a wheat, maize, sunflower products, fertilizers, fuels and
substantial decrease in the March to November period palladium, suggesting that the war could cause severe
2022 relative to 2021. Russia’s imports declined by shortages in the supply of these products.
28.9 per cent and the response of individual products This shortage scenario has not materialized, as an
and exporters appears to reflect the sanctions in place. examination of price and volume trends in the trade of
For instance, imports of motor vehicles and other these goods over the past year illustrates. In contrast,
high-tech equipment, such as electrical machinery and Figures 4 and 5 show that trade values have sharply
telecommunication equipment, incurred the largest increased. A closer look at the data reveals, however,
reduction in import values. that this increase is driven largely by price hikes, as
captured by changes in unit values. Between January
At the country level, the relative decline was largest for and October 2022, prices for the selected commodities
Germany, the United States, Poland and France, while increased between 4.4 per cent (palladium) and
a number of countries increased exports to Russia, 24.2 per cent (maize).
predominantly China and Türkiye. Ukraine’s imports
fell by 32.6 per cent, with imports of oil, arms and While these price increases are substantial, they are
ammunition being the exception at the product level. significantly lower than some scenarios had predicted
At the country level, exports to Ukraine increased for at the onset of the war, partly due to the restraint in
only a small set of countries, including Poland, Slovakia the imposition of export restrictions. Simulations run
and Romania. by WTO economists highlighted that in the case of
cascading export restrictions on food, prices for wheat
Developments in the trade of countries could have increased by up to 85 per cent in some
and products highly dependent on regions (WTO, 2022). Hence, the impact of the war on
supply from Russia and Ukraine prices has been comparably minor so far. However, the
increases add to already high price levels on account of
Russia and Ukraine play a relatively minor role in the the pandemic. Relative to the 2019 average, prices have
global economy, with important exceptions in certain increased between 46.7 per cent (palladium) and 175
agricultural and industrial goods. WTO (2022) identified per cent (sunflower oil, fertilizers) (see Table 1).5
10ANALYTICAL ASSESSM E NT OF TH E TRADE AN D ECONOM IC E FFECTS
FIGURE 4
Estimated value and volume of world trade in selected agriculture-related products,
January 2019 to October 2022 (Indices, 2019 average = 1.0)
Wheat Maize
2.6 2.6
2.4 2.4
2.2 2.2
2.0 2.0
1.8 1.8
1.6 1.6
1.4 1.4
1.2 1.2
1.0 1.0
0.8 0.8
0.6 0.6
0.4 0.4
Sep
Sep
Sep
Sep
Sep
Sep
Sep
Sep
May
May
May
May
May
May
May
May
Mar
Mar
Mar
Mar
Mar
Mar
Mar
Mar
Jan
Jan
Jan
Jan
Jan
Jan
Jan
Jan
Nov
Nov
Nov
Nov
Nov
Nov
Jul
Jul
Jul
Jul
Jul
Jul
Jul
Jul
2019 2020 2021 2022 2019 2020 2021 2022
Sunflower oil Rapeseed oil
3.2 3.2
3.0 3.0
2.8 2.8
2.6 2.6
2.4 2.4
2.2 2.2
2.0 2.0
1.8 1.8
1.6 1.6
1.4 1.4
1.2 1.2
1.0 1.0
0.8 0.8
0.6 0.6
0.4 0.4
Mar
Mar
Mar
Mar
Sep
Sep
Sep
Sep
Sep
Sep
Sep
Sep
Jan
Jan
Jan
Jan
May
May
May
May
May
May
May
May
Nov
Nov
Nov
Mar
Mar
Mar
Mar
Jan
Jan
Jan
Jan
Jul
Jul
Jul
Jul
Nov
Nov
Nov
Jul
Jul
Jul
Jul
2019 2020 2021 2022 2019 2020 2021 2022
Fertilizers Rice
3.2 1.6
3.0 1.5
2.8
2.6 1.4
2.4 1.3
2.2 1.2
2.0
1.1
1.8
1.6 1.0
1.4 0.9
1.2
0.8
1.0
0.8 0.7
0.6 0.6
Sep
Sep
Sep
Sep
May
May
May
May
Mar
Mar
Mar
Mar
Mar
Mar
Mar
Mar
Sep
Sep
Jan
Sep
Sep
Jan
Jan
Jan
Jan
Jan
Jan
Jan
May
May
May
May
Nov
Nov
Nov
Jul
Jul
Jul
Jul
Jul
Jul
Jul
Jul
Nov
Nov
Nov
2019 2020 2021 2022 2019 2020 2021 2022
Value Unit value Volume
Source: WTO estimates. Trade value indices are estimated based on national customs statistics compiled by Trade Data Monitor. Unit value
indices are based on World Bank commodity prices. Volume indices are calculated by deflating the value indices by the unit value indices.
11ON E YEAR OF WAR I N U KRAI N E: ASSESSI NG TH E I M PACT ON G LOBAL TRADE AN D DEVE LOPM E NT
FIGURE 5
Estimated value and volume of world trade in industrial inputs, January 2019 to October 2022
(Indices, 2019 average= 1.0)
Fuels Palladium
2.4 2.4
2.2 2.2
2.0 2.0
1.8 1.8
1.6
1.6
1.4
1.4
1.2
1.2
1.0
0.8 1.0
0.6 0.8
0.4 0.6
0.2 0.4
May
May
May
May
Nov
Nov
Nov
Mar
Mar
Mar
Mar
Jan
Jan
Jan
Jan
Jul
Jul
Jul
Jul
Sep
Sep
Sep
Sep
May
May
May
May
Nov
Nov
Nov
Mar
Mar
Mar
Mar
Jan
Jan
Jan
Jan
Jul
Jul
Jul
Jul
Sep
Sep
Sep
Sep
2019 2020 2021 2022 2019 2020 2021 2022
Value Unit value Volume
Source: WTO estimates. Trade value indices are estimated based on national customs statistics compiled by Trade Data Monitor. Unit value
indices are based on World Bank commodity prices. Volume indices are calculated by deflating the value indices by the unit value indices.
Despite higher prices, trade volumes have remained
fairly stable. That said, the effect across the six Egypt’s imports of wheat from
commodities has been heterogenous, which is
suggestive of different margins of adjustment. Ukraine plunged 81% in the
Importantly, the data are consistent with relevant first eight months of the war.
substitution patterns across suppliers and products.
This highlights the importance of an open trading
system to the resilience of economies, as it facilitates
switching between different sources of supply. the country’s imports of rice jumped 53 per cent in terms
of volume, illustrating substitution across food products
Trade volumes for wheat and maize, for instance, fell by in response to changes in supply.
18.7 per cent and 2.4 per cent, respectively, between
March and October 2022 compared to the 2019 Egypt was the fifth largest wheat importer in 2019,
average. However, this decline corresponds roughly sourcing 48 per cent of its imports from Russia and
to increases in the trade of rice (up by 34.8 per cent), 26 per cent from Ukraine (WTO, 2022). Based on data
which is a suitable substitute. This could indicate from the first eleven months of 2022, Egypt looks set to
that countries replaced imports of wheat and maize be the world’s largest importer of wheat, which it needs
with comparable products to make up for the supply to feed its fast-growing population. The value of Egypt’s
disruptions. This highlights the importance of alternative wheat imports rose 90 per cent from March to November
suppliers being available. Analysing the import trends 2022. The 42 per cent price increase over this period
of countries highly dependent on wheat imports from suggests that the volume of imports rose 34 per cent.
Russia and Ukraine is instructive in this context.
However, Egypt’s imports of wheat from Ukraine
For example, Türkiye sourced 75 per cent of its wheat plunged an estimated 81 per cent in volume terms in the
imports from Russia and Ukraine in 2019 (WTO, 2022). first eight months of the war. While increased imports
From March to December 2022, the value of Türkiye’s from Russia make up for some of this decline, Egypt also
wheat imports actually rose by 31 per cent compared increased its sourcing from other suppliers, including
to the previous year. However, since the price of wheat the European Union (imports rose by 128 per cent)
increased by 37 per cent, the estimated volume of and the United States (a nine-fold increase, albeit from
imports fell around 4.5 per cent. Over the same period, a low base).
12ANALYTICAL ASSESSM E NT OF TH E TRADE AN D ECONOM IC E FFECTS
TABLE 1
Changes in value and volume of world trade by product, January 2019 to October 2022
Mar-Oct year-on-year Mar-Oct change vs 2019 Change between January 2022
change (in %) average (in %) and October 2022 (in %)
Wheat
Value -0.2 79.3 24.0
Unit value 11.9 122.2 17.0
Volume -27.7 -18.7 5.9
Maize
Value -2.8 88.7 -12.3
Unit value -0.1 93.4 24.2
Volume -22.2 -2.4 -29.4
Sunflower oil
Value 5.0 112.9 -13.2
Unit value 27.6 175.0 6.9
Volume -37.2 -22.4 -18.8
Rapeseed oil
Value -11.5 112.9 27.9
Unit value 0.8 141.5 -3.7
Volume -26.8 -7.5 32.8
Fertilizers
Value 23.2 130.7 20.1
Unit value 27.6 175.0 6.9
Volume -23.8 -15.7 12.4
Rice
Value 5.0 41.7 10.9
Unit value -20.5 4.8 1.1
Volume 4.9 34.8 9.7
Fuels
Value 28.0 88.7 11.4
Unit value 31.3 108.6 20.5
Volume -21.9 -9.6 -7.6
Palladium
Value -31.9 34.7 0.4
Unit value -28.1 46.7 4.4
Volume -24.8 -8.4 -3.8
Source: WTO estimates. Trade value indices are estimated based on national customs statistics compiled by Trade Data Monitor. Unit value
indices are based on World Bank commodity prices. Volume indices are calculated by deflating the value indices by the unit value indices.
Farmer applies fertilizer to the winter crop
in 2022 in Steniatyn, Ukraine.
13ON E YEAR OF WAR I N U KRAI N E: ASSESSI NG TH E I M PACT ON G LOBAL TRADE AN D DEVE LOPM E NT
Ethiopia relied on Russia and Ukraine for 14 per cent of 5 per cent. Hence, substitution across suppliers
and 31 per cent of its wheat imports in 2019, respectively. is substantially harder. Substitution across products,
The total value of Ethiopia’s imports rose 39 per cent however, is still possible. In line with this, trade volumes
in the initial ten months of the Ukraine conflict. This in rapeseed oil and other vegetable oils increased by
increase is nearly identical to the 37 per cent rise in the 32.8 per cent between January and October 2022.
price of wheat during this period, suggesting that the
volume of imports was stable, growing just over 1 per
cent. Imports from Russia in quantity terms are estimated
to have fallen around 75 per cent, while the quantity of The quantity of Ethiopia’s
imports from Ukraine dropped 99.9 per cent, nearly to
zero. This loss of supply was mostly made up for by imports of wheat from Ukraine
increased shipments from the United States (up 21 per dropped 99.9%.
cent) and Argentina, for which growth is undefined
because the quantity imported in 2021 was zero.
Argentina supplied roughly 20 per cent of Ethiopia’s
imported wheat in 2022. These examples underscore There are, however, products for which substitution is
the importance of having market access to a range of more complicated because neither alternative suppliers
producing countries. nor easily substitutable products are available in the short
run; as is the case for fertilizers and palladium. Trade
The situation differs for sunflower oil, where trade is volumes in these products are down by 15.7 per cent
highly concentrated and alternative suppliers are not and 8.4 per cent, respectively, compared to the 2019
available. This could explain a steep fall in its global trade average. WTO research on concentration and potential
volume by 18.8 per cent. As shown in WTO (2022), bottlenecks in trade highlights that an increasing share in
Russia and Ukraine had a combined global market international trade suffers from concentration which could
share of 45 per cent for sunflower products in 2019, limit the potential for geographical substitution in the
including a 73 per cent share of crude sunflower oil. future and emphasizes the need for a more diversified
The next largest exporters barely reached market shares trading system (see Figure 6).
A grain sorting machine in operation, Egypt.
14ANALYTICAL ASSESSM E NT OF TH E TRADE AN D ECONOM IC E FFECTS
FIGURE 6
Share of global trade with high concentration of exporters, 2000-2021 (In per cent)
20
18
Share in trade (%)
16
14
12
10
8
2000
2001
2002
2003
2004
2005
2006
2007
2008
2009
2010
2011
2012
2013
2014
2015
2016
2017
2018
2019
2020
2021
Note: Harmonized System six-digit trade flows are considered concentrated if (i) trade value exceeds a threshold value to capture product
relevance and (ii) the Herfindahl–Hirschman index of concentration reaches at least 0.25, indicating on average a maximum of four major suppliers.
Source: See the forthcoming WTO staff working paper by S. Majune and V. Stolzenburg, “Potential Bottlenecks in International Trade”.
For fuels, the data indicate a decline in trade volumes of The role of trade policy in the past
7.6 per cent. This is consistent with reports of energy year and in the longer term
savings by industry and households. The International
Energy Agency reports a record US$ 560 billion Price increases for grains observed during 2022 have
investment in energy efficiency measures in the past been relatively limited. Simulations performed early
year, and that the global economy used energy 2 per during the war included scenarios with much more
cent more efficiently than it did in 2021 (IEA, 2022). substantial increases. An important assumption of
Survey evidence from Germany finds that out of the these pessimistic scenarios was a rapid propagation
industrial companies that rely on gas for production, of export restrictions by net food exporters similar to
75 per cent were able to reduce gas usage without developments observed during the world food price
cutting production.6 In line with this, a 2022 study crisis in 2007 and 2008. This, however, has not occurred.
reports that industrial and small users reduced gas
consumption by up to 19 and 36 per cent, respectively, The WTO’s Trade Monitoring Exercise reports that WTO
in September 2022 compared to the previous year members showed relative restraint in the imposition of
(Ruhnau et al., 2022). trade-restrictive measures during the first months of the
war, despite the early spike of such measures amidst
Overall, the data show that trade in products and by economic uncertainty.7 It finds that during the review
countries highly dependent on supply from Russia and period covering mid-October 2021 to mid-October
Ukraine was remarkably resilient. An important part of 2022, the estimated trade coverage of the regular
this seems to be importers sourcing products from other (non-COVID-related) import-facilitating measures
suppliers. Countries either switched suppliers for the introduced by WTO members (US$ 1,038.4 billion)
same product or replaced products with substitutes, far exceeded the trade coverage of import-restrictive
which also required establishing trading relationships measures (US$ 163.5 billion).
with new partners. This underscores the substantial
flexibility and adaptability of the multilateral trading The WTO Trade Monitoring Exercise, which started
system. Even in the short run and for unexpected amid the financial crisis in 2008 and 2009, has played
disruptions, alternative suppliers can fill in the gaps, at a valuable role in providing transparency around and
least for the majority of products affected by the conflict. fostering restraint in the use of protectionist measures.
15ON E YEAR OF WAR I N U KRAI N E: ASSESSI NG TH E I M PACT ON G LOBAL TRADE AN D DEVE LOPM E NT
This has likely contributed towards keeping price
increases in check. Monitoring and reporting on trade The opportunity costs of
measures taken in relation to the current crisis will
assist members gain a broader understanding of the foregoing further multilateral
trade response and subsequently adjust policies to liberalization would be
better reflect requirements. It is an important tool of
the multilateral trading system in providing regular more than 11.3% for least-
information on trends in trade policymaking to further developed countries.
predictability and transparency in international markets.
This has proved particularly important in times of crises
when domestic incentives to implement restrictive trade
policies is high and, at the same time, their negative
spill-over effects are likely to be large. restrictions taken related to the war in Ukraine. As of
17 February 2023, 95 export-restrictive measures on
In this context, the success of the WTO’s 12th Ministerial food, feed and fertilizers had been introduced since the
Conference, in June 2022, was central. In the Ministerial start of the war, and 67 are still in place, covering roughly
Declaration on the Emergency Response to Food US$ 85 billion of trade.9 These numbers have increased
Insecurity, WTO members committed to taking concrete since mid-October 2022 but are still well below the level
steps to facilitate trade and to improve the functioning of restrictions seen during the food price crisis in 2007
and long-term resilience of global markets for food and 2008. Moreover, during the review period for the report,
and agriculture, including cereals, fertilizers and other the point still holds that WTO members introduced more
agriculture production inputs.8 In addition, they ensured trade-facilitating than trade-restrictive measures on goods,
that any emergency measures introduced to address with the average number of trade-facilitating measures
food security concerns shall minimize trade distortions per month at its highest since 2012 (see Figure 7).
as far as possible. The restraint by WTO members Nevertheless, the war-related increase observed since the
reported by the WTO Trade Monitoring Exercise shows end of February 2022 should be a cause of concern.
that the declaration had a meaningful impact on reducing
food insecurity. Simulations
That said, the pressure to impose new restrictions will Turning to the longer-term outlook, simulations run
remain as long as the war continues. In fact, the by WTO economists highlight the importance of
monitoring report has observed an increase of export open trade policies and securing an open multilateral
trading system. Expanding on work presented in WTO
(2022) that examined how incomes would respond
FIGURE 7 to a fragmentation of the world economy into two
blocs, Métivier et al. (2023) analyse different scenarios
Number of trade policy measures,
for future trade cooperation, including a revival of
2021-2022 (Mid-October to mid-October)
multilateralism and geopolitical rivalry. In this new work,
there is a more detailed underpinning of the decoupling
scenarios with potential tariff and non-tariff measure
increases varying by country based on econometric
Measures estimates from the literature. Furthermore, a division
restricting
trade into three blocs is also studied, with some developing
214 countries and least-developed countries remaining
Measures neutral and able to access both blocs.
facilitating trade
376
The reglobalization scenario involves reducing tariffs and
non-tariff measures on a most-favoured-nation basis at the
multilateral level. In the decoupling scenario, trade costs
would go up between a Western and an Eastern bloc, with
Source: Overview of Developments in the International Trading tariffs increasing to trade conflict levels between countries
Environment: Annual Report by the Director-General, WTO in the different blocs. In contrast to the previous study, the
document WT/TPR/OV/25, 22 November 2022.
simulations distinguish between full rivalry, under which all
16ANALYTICAL ASSESSM E NT OF TH E TRADE AN D ECONOM IC E FFECTS
FIGURE 8
Real GDP impact of different trade policy scenarios (Cumulative impact 2020-2050, in per cent)
6.0
4.8
4.0 3.6
3.2
2.4
1.9
2.0
0.0
-2.0
-2.7 -3.1
-4.0 -3.5
-4.0
-6.0 -5.4
-6.6 -6.5
-8.0
Reglobalization
Reglobalization
Reglobalization
Reglobalization
Partial rivalry
Partial rivalry
Partial rivalry
Partial rivalry
Full rivalry
Full rivalry
Full rivalry
Full rivalry
Global Developed economies Developing economies Least-developed economies
Note: Impact on real GDP is relative to a baseline with no trade policy change.
Source: Métivier et al. (2023).
countries are part of a bloc, and partial rivalry, with some for developed countries, 10.1 per cent for developing
least-developed countries and developing countries countries and more than 11.3 per cent for least-developed
remaining outside the conflict, thus not increasing trade countries. As in the earlier work on decoupling, the
costs vis-à-vis countries of the two blocs. stakes are highest for low-income countries, because
they stand to benefit most from the positive technology
A revival of multilateralism would lead to a global spill-overs generated by international trade.
increase in real income of more than 3.0 per cent in the
long run (until 2050), with the largest increases in low-
income regions (see Figure 8). Geopolitical rivalry would
have a negative impact on real income, with global Endnotes
losses exceeding 5.0 per cent under full rivalry. Partial 1
See https://www.wto.org/english/news_e/pres21_e/pr889_e.htm.
rivalry is better for low-income regions not part of a bloc, 2
See https://www.wto.org/english/news_e/pres22_e/pr902_e.htm.
conditional on the assumption that both blocs would 3
See https://www.wto.org/english/news_e/pres22_e/pr909_e.htm.
remain open to them. The projections show that under 4
See https://www.wto.org/english/res_e/statis_e/miwi_e/info_
partial rivalry the regions staying outside the conflict note_2022q2_e.pdf.
would gain. The share of global trade between countries 5
2022 trade volumes up to October were averaged and compared
in the two different blocs would fall from 46.0 per cent with the 2019 average, as trade in 2020 and 2021 was distorted
by the COVID-19 pandemic.
without decoupling to 25.0 per cent with decoupling, a
reduction of 21.0 percentage points.
6
See https://www.ifo.de/pressemitteilung/2022-11-22/viele-
industriefirmensenken-gasverbrauch-ohne-produktion-zu-drosseln.
7
See Overview of Developments in the International Trading
The opportunity costs of foregoing further multilateral
Environment: Annual Report by the Director-General, WTO
liberalization and moving to geopolitical rivalry instead document WT/TPR/OV/25, 22 November 2022.
are very large. The simulations indicate that the 8
See https://www.wto.org/english/news_e/news22_e/mc12_
opportunity costs would be about 8.7 per cent of real 17jun22_e.htm.
GDP at the global level, varying between 6.4 per cent 9
For WTO trade monitoring data, see https://tmdb.wto.org.
17ON E YEAR OF WAR I N U KRAI N E: ASSESSI NG TH E I M PACT ON G LOBAL TRADE AN D DEVE LOPM E NT
3 Way forward and policy
implications
The war in Ukraine is causing immense human suffering. products surges unexpectedly, even purely domestic
At the same time, it has delivered another major supply chains will struggle to respond. Reglobalization
challenge to the global economy already strained by the is crucial because it maximizes the number of available
impact of the COVID-19 pandemic. This series of crises suppliers and prevents, in contrast to fragmentation,
has given rise to a move for reshoring, nearshoring an artificial cap being established on the number of
and for “friend-shoring” – either making strategically suppliers to which countries have access.
important goods at home or procuring them from allies.
This note highlights that a widespread push to
reconsolidate global supply chains based on
Trade is a critical means
geopolitical considerations would come at a high cost of adaptation to crises.
for all economies in terms of diminished growth and
reduced innovation.
Reduced growth prospects could be particularly The current multilateral trading system the WTO
large for many developing countries, especially least- embodies, which allows countries to choose freely
developed countries, which are dependent on inputs between available suppliers, has held up well in the
and knowledge from more advanced economies to fight current polycrises, in particular in managing the
poverty and escape growth traps. Their opportunity spill-overs of the war. Global trade flows were up in
costs of foregoing further multilateral liberalization 2022, including trade in supply chains.
and moving to geopolitical rivalry instead amount to a
staggering 11.3 per cent of real GDP. This would place The worst scenarios foreseen at the onset of the war
further strain on an already fragile situation triggered for food prices and security have so far not materialized.
by the pandemic. Instead, the initial impacts have been contained
thanks in part due to the openness of the multilateral
Importantly, the issue of decoupling versus trading system and the transparency and commitments
reglobalization is not only about income gains but also it requires from its members. This shows that that
resilience and security of supply – topics of particular resilience will ultimately be best served by fostering
concern to advanced economies. In crises such as the deeper and more diverse international markets, anchored
current one, importers need to respond by adapting their in open and predictable trade rules.
ways of sourcing goods quickly – as Egypt did.
Concentrating sourcing and production at home would
create new vulnerabilities to localized natural disasters
or outbreaks of disease. When hurricanes hit, crops fail
and factories are forced to shut down. Trade is a critical
means of adaptation to crises. If demand for certain
18Wheat harvest in Krasne, Ukraine.
19ON E YEAR OF WAR I N U KRAI N E: ASSESSI NG TH E I M PACT ON G LOBAL TRADE AN D DEVE LOPM E NT BIBLIOGRAPHY International Energy Agency (2022), Energy Efficiency 2022, Paris: IEA. International Monetary Fund (2022a), World Economic Outlook Update: Rising Caseloads, a Disrupted Recovery, and Higher Inflation, Washington, D.C.: IMF. International Monetary Fund (2022b), World Economic Outlook: Countering the Cost-of-Living Crisis, Washington, D.C.: IMF. International Monetary Fund (2023), World Economic Outlook Update: Inflation Peaking Amid Low Growth, Washington, D.C.: IMF. Métivier, J., Bacchetta, M., Bekkers, E. and Koopman, R. (2023), “International Trade Cooperation’s Impact on the World Economy”, WTO Staff Working Paper ERSD- 2023-02, Geneva: WTO. Ruhnau, O., Stiewe, C., Muessel, J. and Hirth, L. (2022), Gas Demand in Times of Crisis: Energy Savings by Consumer Group in Germany, Kiel: ZBW – Leibniz Information Centre for Economics. WTO (2022), The Crisis in Ukraine: Implications of the War for Global Trade and Development, Geneva: WTO. 20
Image credits
     Cover: © Elena Larina/Shutterstock.
Pages 2 and 3: © Rastenberger/NEFCO.
           Page 5: © donvictorio/iStock.
  Page 10: © Aleksandr Mokshyn/iStock.
Page 13: © IMF Photo/Brendan Hoffman.
           Page 14: © FAO/Jordi Vaque.
     Page 19: © FAO/Anatolii Stepanov.

       Print ISBN 978-92-870-7516-1
       Web ISBN 978-92-870-7515-4

               WTO Online Bookshop
           http://onlinebookshop.wto.org

            World Trade Organization
                  154, rue de Lausanne
                   CH-1211 Geneva 2
                            Switzerland
             Tel: +41 (0)22 739 51 11

                     WTO Publications
             Email: publications@wto.org
                             www.wto.org

 Printed by the World Trade Organization.
       © World Trade Organization 2023.
       Report designed by Triptik, Annecy.
This note examines how the war in Ukraine has affected global trade. It looks at how exports from Russia and Ukraine have evolved over the past year. It then analyses how countries highly dependent on Russian or Ukrainian exports of agricultural and primary goods have responded to the crisis, and how prices and trade in goods greatly affected by the war have developed. These impacts reveal the repercussions of the war for developing economies and demonstrate the resilience of the multilateral trading system. This note highlights that a widespread push to reconsolidate global supply chains based on geopolitical considerations would come at a high cost. Reduced growth prospects could be particularly large for many developing countries, especially least-developed countries. Their opportunity costs of foregoing further multilateral liberalization and moving to geopolitical rivalry instead could amount to 11.3 per cent of real GDP – placing further strain on the fragile situation triggered by the COVID-19 pandemic.
You can also read