Unexpected Role of Physiological Estrogen in Acute Stress-Induced Memory Deficits
←
→
Page content transcription
If your browser does not render page correctly, please read the page content below
648 • The Journal of Neuroscience, January 27, 2021 • 41(4):648–662

Systems/Circuits

Unexpected Role of Physiological Estrogen in Acute
Stress-Induced Memory Deficits
    Rachael E. Hokenson,1† Annabel K. Short,2† Yuncai Chen,2 Aidan L. Pham,2 Emily T. Adams,1
    Jessica L. Bolton,2 Vivek Swarup,3 Christine M. Gall,1,3 and Tallie Z. Baram1,2,4*
1
 Departments of Anatomy and Neurobiology, 2Pediatrics, 3Neurobiology and Behavior, and 4Neurology, University of California-Irvine, Irvine,
California 92697

Stress may promote emotional and cognitive disturbances, which differ by sex. Adverse outcomes, including memory disturbances,
are typically observed following chronic stress, but are now being recognized also after short events, including mass shootings,
assault, or natural disasters, events that consist of concurrent multiple acute stresses (MAS). Prior work has established profound
and enduring effects of MAS on memory in males. Here we examined the effects of MAS on female mice and probed the role of
hormonal fluctuations during the estrous cycle on MAS-induced memory problems and the underlying brain network and cellular
mechanisms. Female mice were impacted by MAS in an estrous cycle-dependent manner: MAS impaired hippocampus-dependent
spatial memory in early-proestrous mice, characterized by high levels of estradiol, whereas memory of mice stressed during estrus
(low estradiol) was spared. As spatial memory requires an intact dorsal hippocampal CA1, we examined synaptic integrity in mice
stressed at different cycle phases and found a congruence of dendritic spine density and spatial memory deficits, with reduced
spine density only in mice stressed during high estradiol cycle phases. Assessing MAS-induced activation of brain networks inter-
connected with hippocampus, we identified differential estrous cycle-dependent activation of memory- and stress-related regions,
including the amygdala. Network analyses of the cross-correlation of fos expression among these regions uncovered functional con-
nectivity that differentiated impaired mice from those not impaired by MAS. In conclusion, the estrous cycle modulates the impact
of MAS on spatial memory, and fluctuating physiological levels of sex hormones may contribute to this effect.
Key words: estrogen; hippocampus; memory; sex differences; stress; synapses

     Significance Statement:
     Effects of stress on brain functions, including memory, are profound and sex-dependent. Acute stressors occurring simultane-
     ously result in spatial memory impairments in males, but effects on females are unknown. Here we identified estrous cycle-de-
     pendent effects of such stresses on memory in females. Surprisingly, females with higher physiological estradiol experienced
     stress-induced memory impairment and a loss of underlying synapses. Memory- and stress-responsive brain regions intercon-
     nected with hippocampus were differentially activated across high and low estradiol mice, and predicted memory impairment.
     Thus, at functional, network, and cellular levels, physiological estradiol influences the effects of stress on memory in females,
     providing insight into mechanisms of prominent sex differences in stress-related memory disorders, such as post-traumatic
     stress disorder.

Received Aug. 14, 2020; revised Nov. 16, 2020; accepted Nov. 18, 2020.                                             Introduction
   Author contributions: R.E.H., A.K.S., Y.C., C.M.G, and T.Z.B. designed research; R.E.H., A.K.S., Y.C., A.L.P,   Chronic stress (lasting days to weeks) disrupts hippocampus-de-
E.T.A., and J.L.B. performed research; R.E.H., A.K.S., V.S., and T.Z.B. analyzed data; R.E.H., A.K.S., and T.Z.B
                                                                                                                   pendent spatial memory (Sunanda et al., 2000; Kleen et al.,
wrote and edited the paper; V.S. contributed unpublished reagents/analytical tools.
   †
    R.E.H. and A.K.S. contributed equally to this work.                                                            2006). Conversely, acute stress (lasting minutes to hours) can
   This work was supported by National Institutes of Health R01 MH073136 to T.Z.B., P50 MH096889                   enhance memory and promote survival (Sandi et al., 1997; Uysal
to T.Z.B., and T32 MH119049-02 to R.E.H. We thank Dr. Autumn S. Ivy for lending us equipment;                      et al., 2012; Brivio et al., 2020). Surprisingly, we have previously
Dr. Christina Mo for offering methods insight for the Y-maze; and Dr. Anton Palma for helpful insight
                                                                                                                   discovered that, as opposed to a single acute stress, several short
on statistical analyses.
   The authors declare no competing financial interests.                                                           stressors imposed simultaneously (multiple concurrent acute
   Correspondence should be addressed to Tallie Z. Baram at tallie@uci.edu.                                        stresses [MAS]) impair spatial memory in male rats and mice
   https://doi.org/10.1523/JNEUROSCI.2146-20.2020                                                                  enduringly (Chen et al., 2010, 2016; Maras et al., 2014). This is
Copyright © 2021 Hokenson et al.
   This is an open-access article distributed under the terms of the Creative Commons Attribution 4.0
                                                                                                                   important because such acute traumatic events, consisting of
International license, which permits unrestricted use, distribution and reproduction in any medium provided        combined and simultaneous physical, emotional, and social
that the original work is properly attributed.                                                                     stresses, are increasingly recognized to provoke memory-related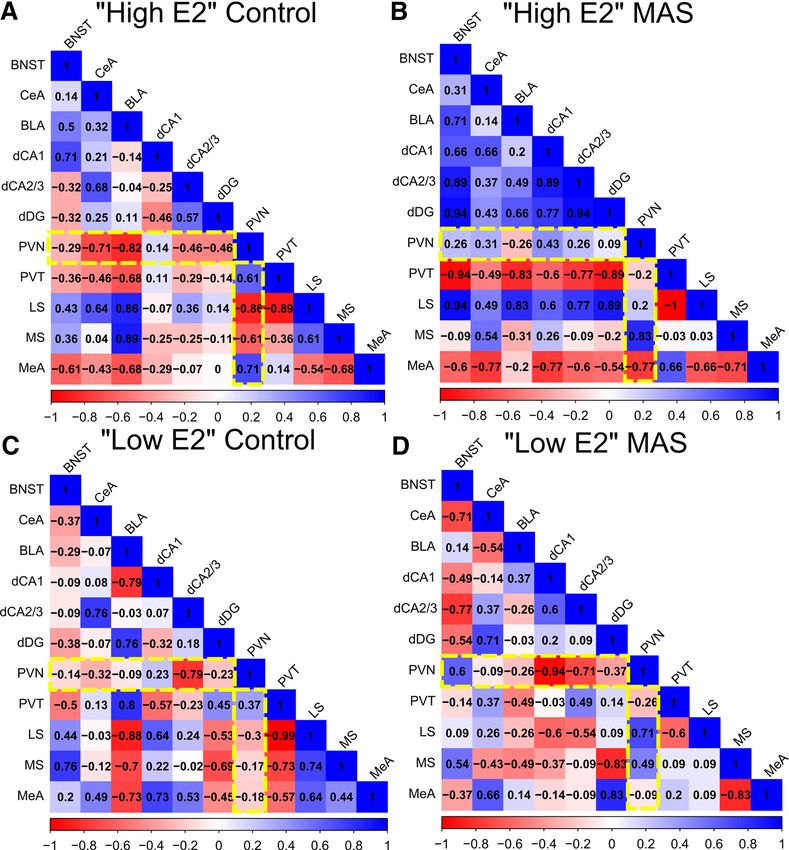
Hokenson et al. · Estrogen in Stress-Induced Memory Deficits                                               J. Neurosci., January 27, 2021 • 41(4):648–662 • 649

problems, including post-traumatic stress disorder (North et al.,        promoter (Thy1-YFP), were received from The Jackson Laboratory or
1994; Tempesta et al., 2012; Lowe and Galea, 2017; Musazzi et            bred in house. Mice were group-housed 2–5 mice per cage in a quiet,
al., 2017; Novotney, 2018).                                              uncrowded facility on a 12 h light/dark cycle (lights on at 6:30 A.M.)
     Stress and memory processes, and their interactions, differ         with ad libitum access to water and food (Envigo Teklad, 2020x, global
across sexes. Males and females generally excel in different types       soy protein-free extruded). Female mice were housed with same-sex
                                                                         cage mates in individually ventilated cages with Envigo 7092-7097
of memory, and sex can influence the cognitive strategies an ani-
                                                                         Teklad corncob bedding and iso-BLOX nesting material. Temperature
mal uses to solve a task (Qiu et al., 2013). Some of these differen-     was maintained between 22°C and 24°C. The number of animals used is
ces are hormone-independent, whereas others are strongly                 detailed in each respective methods subsection.
influenced by the estrous cycle and associated fluctuations in
the sex steroid hormones estrogen and progesterone. For hip-             Estrous cycle monitoring
pocampus-dependent spatial memory, high estrogen levels,                 Estrous cycle phases were monitored daily via vaginal cytology. Briefly, a
whether exogenous or naturally occurring, often facilitate               PBS-moistened small cotton-tipped applicator (Puritan 890-PC DBL)
memory (Gresack and Frick, 2006; Tuscher et al., 2019; Luine             was inserted into the vagina, and the walls of the vagina were scraped for
                                                                         cells. These cells were then smeared across a gelatin-coated microscope
and Frankfurt, 2020), potentially by increasing synapse-bearing
                                                                         slide (Fisherbrand 12-552-3). After drying, slides were stained with
dendritic spines (Gould et al., 1990; Woolley et al., 1990; Vierk et     methylene blue using the Shandon Kwik-Diff Kit (Thermo Fisher
al., 2014). However, high estrogen levels, whether endogenous or         Scientific, 9990700), and cell types were identified under a microscope to
experimentally induced, may also worsen hippocampus-dependent            classify cycle phases (Caligioni, 2009; Byers et al., 2012). Vaginal smears
memory and plasticity (Warren and Juraska, 1997; Snihur et al.,          were collected within the first four hours of the light cycle, except on the
2008; Barha et al., 2010; Tanaka and Sokabe, 2013; Sabaliauskas et       day of MAS (or control), where they were collected up to an hour before
al., 2015). Notably, estrogen effects on hippocampal memory are          lights on. Cycles were monitored for at least two complete cycles before
highly sex-specific, with the estrogen requirement generally thought     behavioral or histologic assessments. Mice were selected to be in early
to be more pronounced in females (Vierk et al., 2012; Frick et al.,      proestrus/high estradiol (E2) or estrus/low estradiol (E2) at the time of
2015; Wang et al., 2018).                                                MAS. For cases in which the mouse was not killed on the day of MAS,
     Sex differences are prominent in the mechanisms and conse-          estrous cycle smears were collected for at least one more day to ensure
                                                                         accurate cycling. Specifically, mice classified as estrus/low E2 on the day
quences of stress. Compared with male rodents, females mount a
                                                                         of MAS were either still in estrus or beginning metestrus by the next day
greater neuroendocrine response to stress (Heck and Handa, 2019;         depending on cycle length. Mice classified as early proestrus/high E2 for
Zuloaga et al., 2020). This response may be hormone-dependent,           MAS were late proestrus to early estrus the next day. If these cycle classi-
as higher estrogen levels are associated with greater stress responses   fication conditions were not met, the mouse was excluded from behav-
(Viau and Meaney, 1991; Lund et al., 2006; Liu et al., 2011).            ioral analysis. Mice that were not cycling were not used or experiments
Furthermore, female rodents can be affected by stresses that may         were postponed until normal cycling was reestablished. We limited our
have the opposite effects in males (Bowman et al., 2001; Luine,          proestrus groups to early proestrus, when estradiol levels are high and
2002; Conrad et al., 2003; Ortiz et al., 2015; Peay et al., 2020).       before the progesterone surge (Becker et al., 2005), although we did not
     Memory deficits are a common and understudied component             measure progesterone and cannot exclude its potential effects. To quan-
of stress-related disorders, and susceptibility can differ between       tify vaginal smear cell type composition, images of the smears were taken
                                                                         under 4 magnification. Cell types were manually classified by a trained
sexes (Christiansen and Hansen, 2015; Olff, 2017). Therefore, it
                                                                         observer and counted by overlaying a grid over the image through
is imperative that studies probing the biological substrates of          ImageJ. Cell types were expressed as percentage of smear.
stress-related memory deficits be expanded to include females
and analyzed with respect to sex hormones. We have previously            Multiple concurrent acute stresses (MAS)
shown that MAS impairs hippocampus-dependent memory and                  Mice from both cycle phases were assigned to the MAS group or to the
dendritic spine integrity in male mice. Here we tested whether           home-cage control group. The MAS paradigm involves exposing mice to
MAS affects hippocampus-dependent memory in female mice                  simultaneous physical, emotional, and social stresses. Briefly, mice were
and determined the impact of sex hormone fluctuations across             individually restrained in a ventilated 50 ml plastic tube. Two to six mice
                                                                         were placed in a cage atop a laboratory shaker in a room bathed with
the estrous cycle on protection or vulnerability to MAS. Spatial
                                                                         loud (90 dB) rap music and bright lights for 2 h. This protocol is
memory, assessed using two independent memory tasks, was                 described in detail at Bio-protocol (Hokenson et al., 2020) and has been
impaired following MAS in female mice with high physiological            used in other studies (Maras et al., 2014; Chen et al., 2016; Libovner et
levels of estradiol (entering proestrus), and spared in females          al., 2020). MAS started within the first 2 h of the light cycle. For behav-
stressed during estrus, when estradiol levels are at their nadir.        ioral assessments, mice underwent MAS for 2 h, were returned to the
Dendritic spine density in dorsal CA1, thought to be a proxy for         homeroom for 1 h, then moved to the behavioral testing suite to accli-
excitatory synapses, was reduced in high estradiol females follow-       mate for 1 h before tests. For spine and fos experiments, mice underwent
ing MAS. Fos expression, a marker of neuronal activation, was            MAS for 2 h and then were immediately anesthetized for perfusions.
differentially distributed in high- and low-estrogen stressed            Home-cage control (unstressed) mice were taken from their home cage,
females, delineating functional networks across salient brain            immediately injected with a lethal dose of a 1:10 dilution of Euthasol
regions that differentiated these groups.                                (488 mg/kg pentobarbital sodium and 63 mg/kg phenytoin sodium, in-
                                                                         traperitoneally) in the vivarium, and transported to the laboratory for
                                                                         perfusion.
Materials and Methods
All experiments were conducted according to National Institute of        Learning and memory tests
Health guidelines on laboratory animal welfare and approved by the           Object location memory (OLM) task. The OLM task is hippocam-
Institutional Animal Care and Use Committee at the University of         pus-dependent (Vogel-Ciernia et al., 2013). OLM was performed as
California-Irvine.                                                       illustrated in Figure 1A (adapted from Vogel-Ciernia and Wood, 2014).
                                                                         Mice were handled for at least 2 min a day for at least 6 d, first in the
Animals                                                                  housing room and then in the behavioral suite for the last few days.
Two- to 4-month-old female virgin C57BL/6J or B6.Cg-Tg(Thy1-YFP)         After handling, mice were habituated to an empty experimental appara-
16Jrs/J transgenic mice, expressing YFP under control of the Thy1        tus for 10 min a day for 5–11 d. If the mouse was not in a proper cycle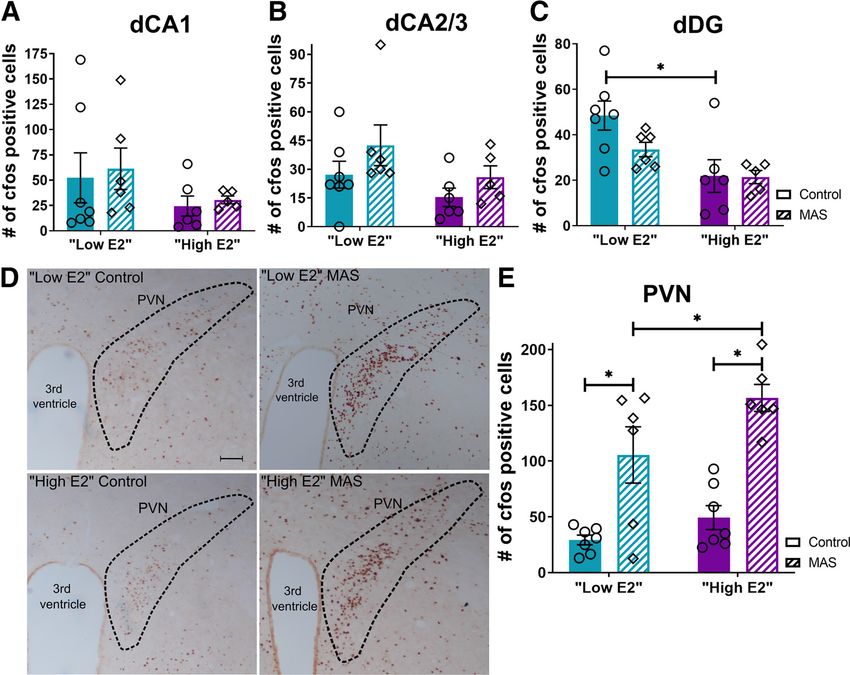
650 • J. Neurosci., January 27, 2021 • 41(4):648–662                                                                      Hokenson et al. · Estrogen in Stress-Induced Memory Deficits

phase on the sixth day, habituation continued
until the mouse was in an appropriate phase. In
the training portion of the OLM task, two identi-
cal objects were presented to the mouse for 10
min. This training session took place 2 h after the
cessation of MAS. Twenty-four hours later, one
object (counterbalanced) was moved and explora-
tion was recorded for 5 min. Object exploration
was scored by observers unaware of the experi-
mental groups using BORIS version 6 (Friard
and Gamba, 2016). Investigation was defined
as the mouse’s nose being pointed toward the
object within 1 cm distance; time climbing or
biting an object was not included. Object pref-
erence was defined as the amount of time
exploring the displaced object divided by time
exploring the unmoved object, with a ratio of 1
indicating no preference. Total exploration
time was calculated and compared across
groups. Mice were excluded if they explored
for ,10 s total during training, ,5 s total dur-
ing testing, or ,1 s exploration for a single
object. No mice had an object bias during
training (ratio ,0.5 or .2.0) that would war-
rant exclusion. Nine to 11 mice were used per            Figure 1. Spatial memory impairment following MAS is limited to mice entering proestrus. A, For the Objection
group. Four mice were excluded from analyses             Location Memory (OLM) task, mice were habituated to the apparatus several days before MAS. At 2 h after MAS, mice
for under exploration (one per group), and 2             were trained and then memory was tested 24 h later. B, Estrus control, estrus MAS, and early proestrus control mice
mice were excluded because of incorrect cycle            preferentially explored the object in a novel location, whereas early proestrus MAS mice explored both objects equiva-
determinations (one in each early proestrus              lently (n = 9-11/group). C, For the spatial Y-maze task, 2 h after MAS, mice were trained in the apparatus with one arm
group).                                                  closed. After 1 h, mice were reintroduced to the maze with the previously closed arm (the novel arm) now open. D,
    Spatial Y-maze task. The spatial Y-maze is a         Most mice of both control groups and most estrus MAS mice entered the novel arm as their first choice, whereas
hippocampus-dependent task (Conrad et al.,               the first entry being the novel arm for MAS early proestrus mice was below chance. E, Estrus control, estrus MAS,
1996; Sarnyai et al., 2000) that offers the              and early proestrus control mice entered the novel arm more frequently than the familiar arm, whereas early pro-
advantage of a short training-to-testing inter-          estrus MAS mice entered the novel and familiar arms equally (n = 7–9 per group). pp , 0.05 (post-test). Points
val, such that both are accomplished within the          represent scores of individual animals. Connected points are matched samples within an animal. Error bars indicate
same day. The Y-maze was performed as illus-             6 SEM.
trated in Figure 1C (adapted from Mo et al.,
2014) in a separate cohort of mice. Mice were
handled for at least 2 min a day for at least 6 d,                                    Brain processing and analyses
first in the housing room and then in the behavioral suite. Distal cues               Analyses of dendritic spines and fos expression were conducted immedi-
were arranged around the Y-maze. In the training portion, one arm                     ately after MAS or in unstressed controls. Immediately after being
(counterbalanced) was closed off with a divider. For 10 min, the mouse                removed from MAS, mice were anesthetized with a lethal dose of a 1:10
was permitted to explore the home arm (the arm into which they were                   dilution of Euthasol (488 mg/kg pentobarbital sodium and 63 mg/kg
initially placed) and the familiar or open arm. The mouse was then                    phenytoin sodium, intraperitoneally) and perfused intracardially with
returned to their cage for a 1 h intertrial interval. The divider was then            freshly prepared 4% PFA in 0.1 M sodium PB, pH 7.4, 4°C. Brains were
removed; and in the 5 min testing phase, the mouse was permitted to                   cryoprotected and sectioned into 20 mm slices.
explore all three arms of the Y-maze. Whether the mouse’s first entry
was into the novel or familiar arm during the testing phase was
recorded. The number of entries into the novel arm were compared                      Imaging and quantification of hippocampal dendritic spines
with entries into the familiar arm as an assessment of location prefer-               Using the Thy1-YFP mice, which allow for clear visualization of axon
ence. Total arm entries were calculated for the training phase (home                  terminals, neurons were chosen using systematic unbiased sampling
and familiar) and the testing phase (home, familiar, and novel) to com-               from the dorsal hippocampus (Chen et al., 2001). CA1 pyramidal
pare general exploration between groups. Furthermore, distance trav-                  neurons were selected for analyses to include equal representation of
eled during training and testing was used to compare general activity                 long- and short-shaft populations. z-stack images were captured, recon-
between groups. Video tracking software (Noldus Ethovision 15) was                    structed, and drawn using a Carl Zeiss 510 confocal microscope with
used to compute distance traveled and arm entries. Seven to nine mice                 63 objective, ImageJ (version 2), and Adobe Photoshop (version 5).
were used per group, and no mice were excluded from these analyses.                   The second to fourth apical dendritic branches of CA1 pyramidal neu-
                                                                                      rons were collected at 0.2 mm focal steps through the entire depth of
Uterus dissection                                                                     each dendrite. Six neurons from six sections per animal, and 4 or 5 ani-
Uterine indices were determined by standardizing the uterus wet weight                mals per group were evaluated.
with the animal’s body weight ((uterine weight (g)/body weight (g))                       The number of spines (spine density) was quantified comparing den-
100). The mouse was weighed, and vaginal smears were taken before                     dritic branches of the same order. Reconstructed spines were identified
death. Animals were killed via rapid decapitation (10:00 AM to 12:00                  and characterized (Chen et al., 2013); mushroom-type and thin spines
PM) and the uterus was removed. All surrounding tissues, including fal-               were compared (mushroom and thin spines were combined to compute
lopian tubes, were removed and uterine wet weight measurements were                   total spines), and filopodia were excluded. Spine density was expressed
taken. Uteri were harvested without knowledge of cycle phase, thus                    as the number of spines per 10 mm of dendrite length. No correction fac-
resulting in uneven group sizes (eight uteri were from mice in low E2                 tors were applied to the spine counts because high-magnification neuro-
and 17 uteri were from mice in high E2). No mice were excluded from                   nal reconstruction permitted all spines of a given dendritic segment to
these analyses.                                                                       be visualized. All analyses were performed without knowledge of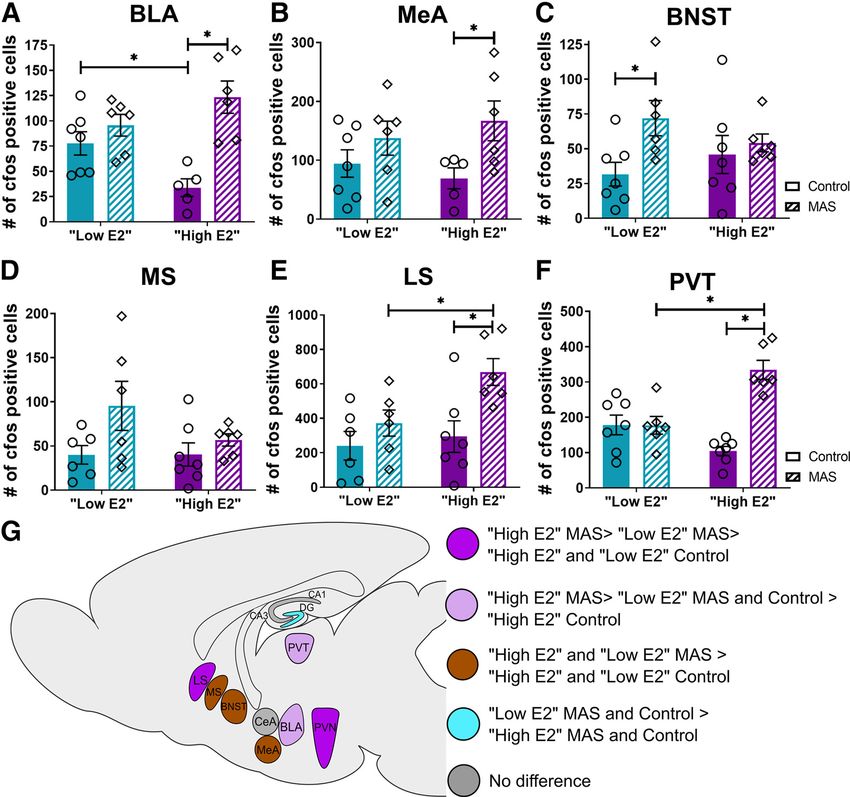
Hokenson et al. · Estrogen in Stress-Induced Memory Deficits                                                        J. Neurosci., January 27, 2021 • 41(4):648–662 • 651

treatment group, and 2 mice (1 from each high E2 group) were excluded            Experimental design and statistical analyses
for improper cycle categorization.                                               Statistical analyses were performed using GraphPad Prism version 8.4.2
                                                                                 for Windows (GraphPad software) or R, including packages: igraph,
Imaging and fos expression analyses                                              impute, qgraph, DescTools, Hmisc, and corrplot (Csardi and Nepusz,
An avidin-biotin complex, DAB reaction was used to visualize Fos protein         2006; Epskamp et al., 2012; Wei and Simko, 2017; Harrell, 2020; Hastie
in the anterior paraventricular thalamus (PVT), paraventricular nucleus of       et al., 2020; R Core Team, 2020; Signorell et al., 2020). Two- or three-
the hypothalamus (PVN), dorsal hippocampus (cornu ammonis, dentate               way ANOVAs were used for behavioral, spine, and fos data when two or
gyrus: CA1, CA2/3, DG), amygdala (central, basolateral, medial: CeA,             three factors were analyzed (factors identified in the respective Results
BLA, MeA), anterior division of the bed nucleus of the stria terminalis          sections). Sidak’s multiple comparisons post-tests were run when a main
(BNST), and septum (lateral [LS], medial [MS]) for each mouse. Sections          effect or interaction was found to be statistically significant (a = 0.05) or
were washed with PBS with 0.3% Triton X-100, quenched with 0.09%                 if a specific comparison was planned (cases identified in Results).
H2O2, then blocked with 2% normal goat serum and 1% BSA. Sections                Uterine indices were compared across the two groups with an unpaired t
were incubated overnight at room temperature in rabbit anti c-Fos primary        test. Estradiol levels and vaginal smear cell types were found to be not
antibody (1:10,000, Sigma Millipore, ABE457, lot #3088370), washed, then         normally distributed by Anderson-Darling test for normality. A non-
incubated for 40 min in biotinylated goat anti-rabbit IgG (1:400, Vector         parametric, Mann–Whitney test was used to compare estradiol levels
Laboratories, BA-1000). Sections were stained with Vectastain Elite avi-         between the two groups. Correlations between estradiol and estrous cell
din-biotin complex peroxidase kit for 3 h, stained for DAB (Vector               types were computed using nonparametric Spearman Rank-Order
DAB peroxidase substrate kit), then mounted and coverslipped with                Correlations. Pearson product-moment correlations were also computed
Permount mounting medium.                                                        to generate a best fit line. Correlation matrices for regional fos expression
    Images of sections were taken at 4 magnification (Nikon Eclipse             were computed using Spearman Rank-Order Correlations. To compare
E400, Nikon DS-Fi3, NIS-Elements F version 4.60.00). One section per             fos activity networks between groups, correlation coefficients were con-
region was analyzed, and borders of the entire region were delineated            verted to z scores, and the difference in z scores was plotted using the R
with reference to a mouse brain atlas (Sidman and Pierce, 1971; Paxinos          package qgraph, which represents an increase or decrease in correlation
and Franklin, 2001). Anterior-posterior bregma coordinates of each ana-          (color) and intensity of the difference (line thickness). Differences
lyzed region were as follows: LS and MS 1.18 mm, BNST 0.38 mm, PVT               between z scores were computed by calculating the zobserved (Zobs = (Z1 –
and PVN 0.56 mm, MeA 1.06 mm, CeA and BLA 1.46 mm, and                           Z2)/(H[(1/n1 – 3)1(1/n2 – 3))), and these values are presented in Table
CA1, CA2/3, and DG 2.5 mm. The BNST regions included constitute                  1. Data point exclusions are elaborated on for each section of Materials
                                                                                 and Methods. The results are reported as mean 6 SEM unless noted
the anterior division, including the anterolateral and anteromedial areas
                                                                                 otherwise.
according to the Allen Mouse Brain Atlas (Lein et al., 2007). A single,
4 magnified image was analyzed for all regions except the dorsal hip-
pocampus, in which two images were combined. Counts represent uni-               Results
lateral regions except for midline regions (PVT and septal) that were            Spatial memory deficits provoked by multiple acute
counted as a single structure (bilateral). Fos1 cells were identified in         simultaneous stresses (MAS) differ across the estrous cycle
ImageJ using the analyze particle function (Schneider et al., 2012).
                                                                                 In order to test the potential role of the estrous cycle in the effects
Images were first converted to 16-bit black and white, the background
                                                                                 of MAS on spatial memory, female mice underwent MAS either
was subtracted, and the hole fill feature was used. Fos staining was not
dense enough to warrant any corrections for overlapping particles, and           on entering proestrus or during estrus, phases associated with
automated counts were highly correlated with manual fos1 cell identifi-          high and low physiological levels of estradiol, respectively, and
cation. All analyses were performed without knowledge of treatment               were then tested for spatial memory. In the OLM task (Fig. 1A),
group. All available regions were analyzed in each mouse for 6 or 7 mice         control mice at both cycle phases performed well. Mice experi-
per group, and no mice were excluded from these analyses. Raw fos                encing MAS during early proestrus had poor spatial memory
counts were scaled (mean normalization) across all brain regions and             whereas those exposed to MAS during estrus were protected. We
groups before computing correlation matrices. Correlation matrices               found an interaction of cycle phase  MAS on OLM perform-
were used to construct comparative network maps.                                 ance (F(1,35) = 5.78, p = 0.02) and no main effects of cycle phase
                                                                                 (F(1,35) = 2.24, p = 0.14) or MAS (F(1,35) = 1.66, p = 0.21; Fig. 1B).
Estradiol ELISA                                                                  Post hoc testing indicated a difference in performance between
Blood serum estradiol concentration was quantified using a Mouse/Rat             MAS and control in the early proestrus group (t(35) = 2.58, p = 0.03)
Estradiol ELISA kit (Calbiotech, ES180S-100). The Calbiotech kit has a           but not the estrus group (t(35) = 0.80, p = 0.68). Furthermore, the
3 pg/ml functional sensitivity, 3.1% intraassay precision, and 9.9% interassay
                                                                                 early proestrus MAS group had significantly impaired performance
precision, as provided by the manufacturer (Haisenleder et al., 2011). Blood
was collected from the mouse after rapid decapitation (9:00 AM to 11:00
                                                                                 compared with the estrus MAS group (t(35) = 2.87, p = 0.01), while
AM) and clotted at room temperature for ;30 min. Samples were centri-            there were no differences in between control mice of both phases
fuged at 1100 rcf for 15 min. The clear supernatant was collected, stored at     (t(25) = 0.62, p = 0.79).
   20°C, and the pellet discarded. Samples were thawed and run in duplicates         Notably, differences in OLM were not attributable to differen-
according to the manufacturer’s instructions. Absorbances were read within       ces in exploration or object bias. During the training session, the
15 min at 450 nm with a microplate reader (BioTek Synergy HTX). Data of          ratio of time spent exploring the object moved during testing
three separate ELISAs were analyzed together, but concentrations per sam-        over the object that stayed in place did not differ among groups
ple were computed using the standard curve generated during each respec-         (estrus control 1.05 6 0.04, proestrus control 1.09 6 0.08, estrus
tive run. Estradiol was quantified in 12 low E2 and 18 high E2 mice,             MAS 1.03 6 0.05, and proestrus MAS 0.99 6 0.07), with no
classified by matched vaginal smear data. One mouse from the high E2             cycle  MAS interaction (F(1,35) = 0.42, p = 0.52), main effect of
group was excluded for poor cycling, and 1 mouse from the low E2 group
                                                                                 cycle phase (F(1,35) = 0.004, p = 0.95), or MAS (F(1,35) = 0.79,
was excluded because of an error on the ELISA plate. Estrogen levels in the
majority of the estrus group samples fell below the 3 pg/ml sensitivity of the
                                                                                 p = 0.38). Similarly, total object exploration times during training
kit and were extrapolated. This approach enabled drawing correlations            (estrus control 21.51 6 1.27 s, proestrus control 24.40 6 2.54 s,
between cytology and hormone levels across the cycle phases. We also used        estrus MAS 23.66 6 1.21 s, proestrus MAS 20.65 6 1.24 s) did
the alternative approach, setting values under the limit at zero (undetect-      not distinguish the groups, with no cycle  MAS interaction
able). This approach also yielded robust differences in mean estradiol levels    (F(1,35) = 3.35, p = 0.08), main effect of cycle phase (F(1,35) = 0.001,
between high E2 and low E2 and vaginal cytology cell types.                      p = 0.97), or MAS (F(1,35) = 0.24, p = 0.63). The testing phase was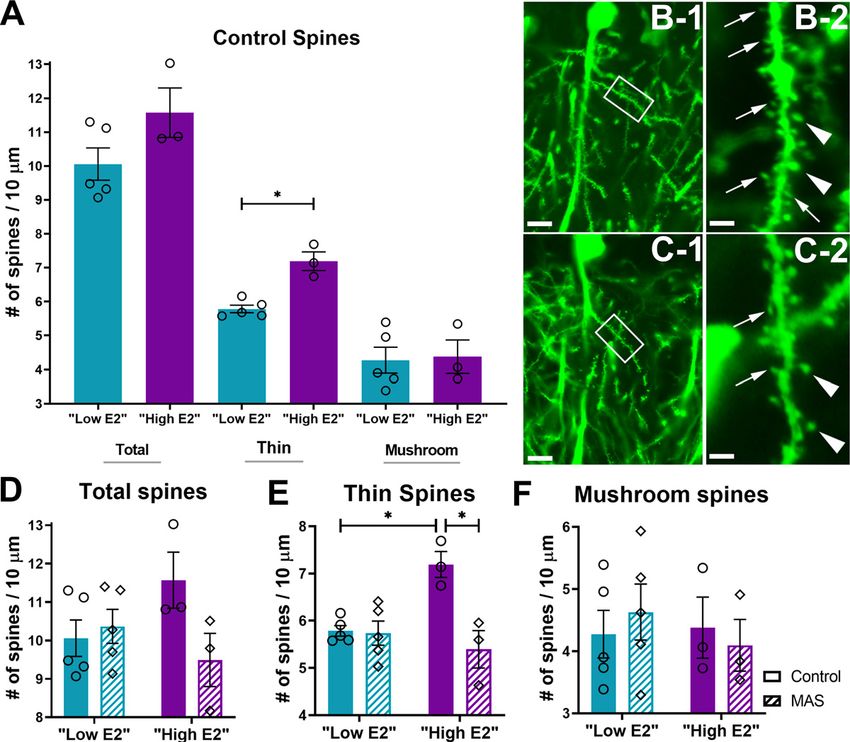
652 • J. Neurosci., January 27, 2021 • 41(4):648–662                                                                  Hokenson et al. · Estrogen in Stress-Induced Memory Deficits

Table 1. Difference between correlation coefficients (Zobs) across conditions                   The design of the OLM test involves training the females on
                        Control: high      High E2:         Low E2:          MAS: high      the day of stress (early proestrus or estrus), and testing 24 h later,
                        E2 vs low          MAS vs           MAS vs           E2 vs low E2   when cycle phase and associated estrogen levels might differ.
Region                  E2 (Zobs)          control (Zobs)   control (Zobs)   (Zobs)         Therefore, to determine with greater precision the contribution
CeA and BNST              0.61                0.20            0.67             1.50         of specific cycle phases to the effects of MAS on memory, in a
BLA and BNST              0.98                0.38            0.58             0.92         separate cohort of female mice we conducted a second, inde-
BLA and CeA               0.46                0.21            0.71             0.92         pendent test of spatial memory in which both training and test-
dCA1 and BNST             1.30                0.12            0.57             1.44         ing take place on the same day. During the testing phase of the
dCA1 and CeA              0.16                0.57            0.29             1.02         spatial Y-maze task (Fig. 1C), 87.5% of control estrus mice and
dCA1 and BLA              1.07                0.35            1.91             0.21         75% of control early proestrus mice entered the novel arm first
dCA2/3 and BNST           0.31                1.90            1.22             2.66         from the home arm of the apparatus. Of the MAS groups,
dCA2/3 and CeA            0.21                0.44            0.81             0.00         71.4% of estrus MAS mice versus 33.3% of early proestrus MAS
dCA2/3 and BLA            0.01                0.57            0.30             0.87         mice entered the novel arm first (Fig. 1D). Both control groups
dCA2/3 and dCA1           0.42                1.82            0.82             0.78
                                                                                            and the estrus MAS group, but not the early proestrus MAS
dDG and BNST              0.09                2.30            0.27             2.60
dDG and CeA               0.37                0.20            1.26             0.48         group entered the novel arm significantly more often than the
dDG and BLA               1.04                0.68            1.35             0.89         familiar arm. A three-way ANOVA indicated a significant main
dDG and dCA1              0.23                1.67            0.69             0.90         effect of arm (F(1,28) = 33.32, p , 0.0001; Fig. 1E). There were
dDG and dCA2/3            0.61                1.22            0.13             1.84         no interactions of arm  MAS  cycle phase (F(1,28) = 3.20,
PVN and BNST              0.21                0.73            1.10             0.53         p = 0.08), arm  MAS (F(1,28) = 0.52, p = 0.48), MAS  cycle
PVN and CeA               0.66                1.34            0.32             0.50         phase (F(1,28) = 2.74, p = 0.11), or arm  cycle phase (F(1,28) =
PVN and BLA               1.23                0.98            0.22             0.00         0.41, p = 0.53), and no main effects of cycle phase (F(1,28) = 0.31,
PVN and dCA1              0.12                0.34            2.61             2.43         p = 0.58) or MAS (F(1,28) = 2.64, p = 0.12). Post hoc testing indi-
PVN and dCA2/3            0.74                0.84            0.23             1.27         cated a significant preference for entries into the novel versus
PVN and dDG               0.35                0.64            0.20             0.52
                                                                                            the familiar arm in both control groups: estrus (t(28) = 2.69,
PVT and BNST              0.25                1.82            0.54             1.98
PVT and CeA               0.73                0.03            0.34             1.13         p = 0.047) and early proestrus (t(28) = 3.84, p = 0.003), as well as
PVT and BLA               2.23                0.39            2.14             0.80         the estrus MAS group (t(28) = 3.51, p = 0.006) but not in the pro-
PVT and dCA1              0.98                0.88            0.80             0.73         estrus MAS group (t(28) = 1.40, p = 0.53). Thus, as found for the
PVT and dCA2/3            0.08                0.80            1.00             1.70         OLM, MAS selectively impaired spatial memory in early proes-
PVT and dDG               0.83                1.38            0.45             1.69         trous female mice in the Y-maze, while sparing mice in estrus.
PVT and PVN               0.45                1.19            0.85             0.07             These spatial Y-maze memory impairments were not attrib-
LS and BNST               0.02                1.71            0.47             2.05         utable to differences in exploration of the apparatus or overall
LS and CeA                0.87                0.25            0.36             0.33         locomotion during the training or testing sessions of the task.
LS and BLA                2.89                0.11            1.34             1.77
                                                                                            Total entries into the open and home arms during training
LS and dCA1               1.02                0.84            1.78             1.52
LS and dCA2/3             0.15                0.71            1.05             1.79
                                                                                            were equivalent: estrus control 70.63 6 11.54, proestrus con-
LS and dDG                0.90                1.38            0.82             1.44         trol 79.13 6 14.44, estrus MAS 87.71 6 6.86, and proestrus
LS and PVN                1.27                1.94            1.48             0.85         MAS 93.00 6 7.03, with no cycle phase  MAS interaction
LS and PVT                1.44                1.59            2.26             2.39         (F(1,28) = 0.02, p = 0.88), main effect of cycle phase (F(1,28) =
MS and BNST               0.83                0.60            0.49             0.85         0.43, p = 0.52), or MAS (F(1,28) = 2.16, p = 0.15). Distance
MS and CeA                0.17                0.63            0.42             1.31         traveled during the training phase was equivalent across all
MS and BLA                2.53                1.93            0.42             0.25         groups (estrus control 3500 6 250.0 cm, proestrus control
MS and dCA1               0.58                0.57            0.75             0.72         3395 6 235.7 cm, estrus MAS 3435 6 179.8 cm, and proestrus
MS and dCA2/3             0.29                0.19            0.08             0.00         MAS 3807 6 177.0 cm), with no cycle phase  MAS interac-
MS and dDG                0.91                0.10            0.41             1.07
                                                                                            tion (F(1,28) = 1.24, p = 0.28), effect of MAS (F(1,28) = 0.65,
MS and PVN                0.70                2.47            0.86             0.80
MS and PVT                0.72                0.45            1.23             0.14
                                                                                            p = 0.43), or of cycle phase (F(1,28) = 0.39, p = 0.54). During
MS and LS                 0.32                0.88            1.06             0.07         the testing session, there was an effect of MAS on total
MeA and BNST              1.05                0.01            0.78             0.37         entries (into the novel, familiar, and home arms: estrus con-
MeA and CeA               1.15                0.62            0.33             2.22         trol 34.38 6 4.76, proestrus control 40.25 6 5.33, estrus MAS
MeA and BLA               0.11                0.68            1.40             0.42         49.71 6 3.79, and proestrus MAS 43.22 6 1.77, F(1,28) = 5.05,
MeA and dCA1              1.40                0.73            1.40             0.96         p = 0.03), but no cycle phase  MAS interaction (F(1,28) =
MeA and dCA2/3            0.76                0.62            0.88             0.67         2.30, p = 0.14) or effect of cycle phase (F(1,28) = 0.006,
MeA and dDG               0.56                0.61            2.19             1.96         p = 0.94). The effect of MAS was significant in the estrus
MeA and PVN               1.24                2.10            0.13             1.15         group (t(28) = 2.58, p = 0.03) but not in proestrus (t(28) = 0.53,
MeA and PVT               0.91                0.71            1.10             0.72
                                                                                            p = 0.84). However, the total number of entries did not differ
MeA and LS                1.49                0.21            0.82             1.07
MeA and MS                1.42                0.08            2.03             0.35
                                                                                            between the estrus MAS and the proestrus MAS groups
                                                                                            (t(28) = 1.12, p = 0.47) and is thus unlikely to explain the dis-
                                                                                            crepancy in memory performance between these two groups.
also not confounded by total object exploration times (estrus con-                          During the testing session, there were no differences in dis-
trol 12.55 6 0.62 s, proestrus control 16.32 6 1.58 s, estrus MAS                           tance traveled (estrus control 2014 6 181.8 cm, proestrus
15.10 6 1.24 s, proestrus MAS 14.71 6 1.60 s), with no cycle                                control 2235 6 269.5 cm, estrus MAS 2358 6 92.91 cm, and
phase  MAS interaction (F(1,35) = 2.41, p = 0.13), main effect of                          proestrus MAS 2165 6 75.48 cm) with no cycle phase  MAS
cycle phase (F(1,35) = 1.60, p = 0.21), or MAS (F(1,35) = 0.13,                             interaction (F(1,28) = 2.51, p = 0.12), effects of cycle phase
p = 0.72). Therefore, we concluded that MAS selectively impaired                            (F(1,28) = 0.12, p = 0.73), or MAS (F(1,28) = 0.29, p = 0.59).
OLM of female mice during early proestrus but not during estrus.                            Together, these data dismiss the likelihood that reduced
Hokenson et al. · Estrogen in Stress-Induced Memory Deficits                                                                    J. Neurosci., January 27, 2021 • 41(4):648–662 • 653

                                                                                                                                 phase smears consisted predominantly
                                                                                                                                 of cornified cells. Early proestrous phase
                                                                                                                                 smears had a large proportion of nu-
                                                                                                                                 cleated cells with some leukocytes and
                                                                                                                                 some cornified cells. There was an inter-
                                                                                                                                 action of cycle phase  cell type (F(2,54) =
                                                                                                                                 57.91, p , 0.0001) and an effect of cell
                                                                                                                                 type (F(1.737,46.91) = 34.26, p , 0.0001), but
                                                                                                                                 no effect of cycle (F(1,27) = 0.5237,
                                                                                                                                 p = 0.48; Fig. 2A). Post hoc tests indicated
                                                                                                                                 that the numbers of nucleated (t(17.25) =
                                                                                                                                 8.92, p , 0.0001), cornified cells (t(17.75) =
                                                                                                                                 16.98, p , 0.0001), and leukocytes (t(17.28)
                                                                                                                                 = 3.69, p = 0.005) differed between estrous
                                                                                                                                 and early proestrous mice. Because stress
                                                                                                                                 can alter the duration of the estrous cycle
                                                                                                                                 (Breen et al., 2012), we assessed this pa-
                                                                                                                                 rameter in MAS mice: we monitored each
                                                                                                                                 female for 3 or 4 cycles before and after
                                                                                                                                 MAS in a preliminary experiment. The
                                                                                                                                 average cycle length did not change from
                                                                                                                                 before to after MAS (pre: 5.19 6 0.07 d,
                                                                                                                                 post: 5.23 6 0.23 d) and did not differ
                                                                                                                                 from a control group (pre: 5.00 6 0.13 d,
                                                                                                                                 post: 4.81 6 0.17 d). Time point  MAS
Figure 2. Early proestrous mice (those with impaired memory following MAS) have higher levels of circulating estradiol.
Estrous cycles were monitored via vaginal cytology and at the time of the experiment mice were divided into groups that
                                                                                                                                 interaction (F(1,27) = 0.53, p = 0.47), effect
were early proestrus or estrus. A, Vaginal cytology classifications were done according to relative presence of nucleated epi-   of time point (F(1,27) = 0.27, p = 0.61), and
thelial, cornified epithelial, or leukocytes in the sample. High E2 mice had a majority nucleated cells, whereas low E2 mice     effect of MAS (F(1,27) = 2.87, p = 0.10)
had smears consisting of almost entirely cornified cells (n = 11-18/group). B, Mice classified as early proestrus according to   were not statistically significant. There-
their vaginal smears had higher average estradiol in serum samples as measured by an estradiol ELISA compared with estrus        fore, we concluded that MAS did not alter
mice (n = 11-18 mice/group). C, High E2 mice had higher average uterine indices (uterus weight/body weight  100)                the length of the estrous cycle.
(n = 8-17 mice per group). D, The amount of estradiol within a sample had a significant positive correlation with the per-           We then measured serum estradiol in
centage of the smear that consisted of nucleated epithelial cells. E, Estradiol had a negative correlation with cornified cells. regularly  cycling female mice. Early pro-
From this point on, early proestrus mice were classified as high E2 and estrus mice were classified as low E2. #p , 0.05,        estrous mice had higher concentrations
main effect. Points represent scores of individual animals. Error bars indicate 6 SEM.
                                                                                                                                 of serum estradiol than those in estrus
                                                                                                                                 (U = 35, p = 0.002; Fig. 2B). Further, se-
exploration explains the impaired performance in the Y-                                                                          rum estradiol levels correlated with the
maze of early proestrous mice subjected to MAS.                                                     vaginal smear cell type composition across both phases of the
     Together, the results of the two independent measures of spa-                                  estrous cycle: estradiol levels of an individual mouse were posi-
tial memory demonstrated impaired spatial memory in mice                                            tively correlated with the percentage of nucleated epithelial cells
exposed to MAS during early proestrus but not during estrus.                                        in vaginal smears from the same mouse (Spearman: rs = 0.55,
                                                                                                    p = 0.002, Pearson: R2 = 0.30, p = 0.002; Fig. 2D) and negatively
Physiologic estradiol levels are high in early-proestrous mice                                      correlated with percentage of cornified cells (Spearman: rs =
that have impaired memory following MAS                                                                0.37, p = 0.046, Pearson: R2 = 0.21, p = 0.014; Fig. 2E). Seeking a
The results above, in which mice in a cycle phase when estrogen                                     second, independent biological marker of estradiol levels, we
levels are high (early proestrus) had impaired spatial memory                                       determined uterine weights, which have been shown to fluctuate
following MAS, were unexpected. Indeed, we chose to test female                                     across the estrous cycle and depend on systemic estrogen levels
mice in these two cycle phases with the expectation that higher                                     (Balmain et al., 1956; Galloa et al., 1986; Lemini et al., 2015).
estrogen levels might protect memory in female mice from the                                        Uterine indices (uterus weight (g)/body weight (g)  100) of
impact of MAS, given that estrogen has been shown to enhance                                        mice entering proestrus were greater than those in estrus (t(23) =
memory processes and the structure and function of hippocam-                                        7.52, p , 0.0001; Fig. 2C). Thus, using vaginal cytology matched
pal neurons (Vierk et al., 2014; Wang et al., 2018) and protect                                     with serum estradiol or uterine weights, we categorized female
against stress-induced memory impairments (Wei et al., 2014).                                       mice in estrus as low estradiol (E2) and mice in early proestrus
Female mice in estrus, however, had no MAS-induced memory                                           as high estradiol (E2).
disturbances. To verify the congruence of our categorization and
estrogen levels, we measured serum estradiol in independent                                         MAS-provoked loss of hippocampal dendritic spines aligns
cohorts of mice which were carefully classified for cycle phase                                     with spatial memory impairment
based on daily vaginal smears for a minimum of two cycles. To                                       In male mice, in which hippocampal estrogen levels are higher
further establish the cyclic physiological functions of estradiol, we                               than in proestrous females (Hojo et al., 2004; Kato et al., 2013),
harvested uteri and determined the estrogen-dependent uterine                                       MAS-induced spatial memory deficits strongly correlate with
weight and uterine index.                                                                           loss of apical dendritic spines in dorsal hippocampal CA1 fields.
     First, we established consistent and rigorous cycle phases by                                  In addition, the spine loss is most prominent for thin spines,
quantifying the cell type composition in vaginal smears. Estrous                                    considered to undergo plasticity during memory acquisition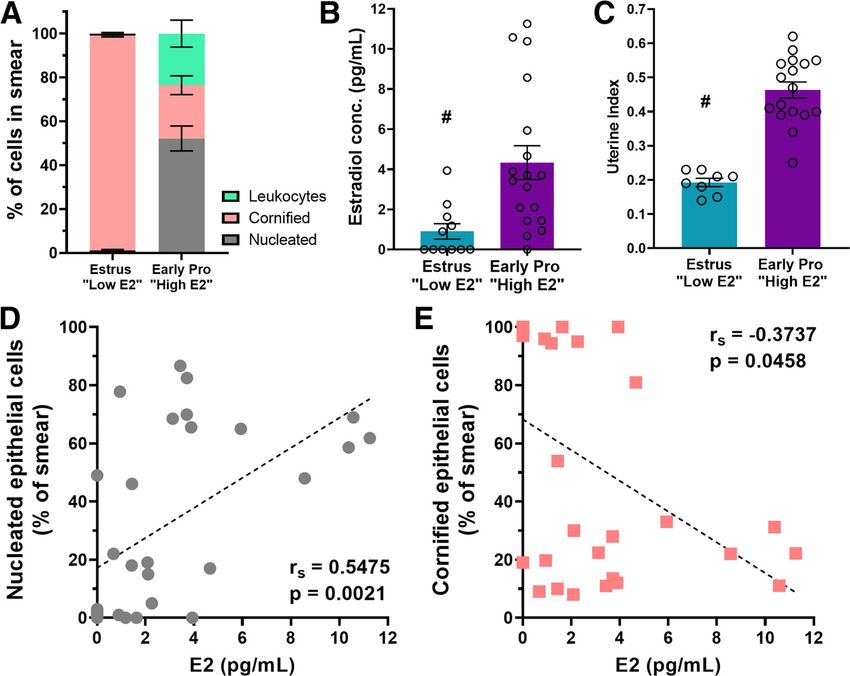
654 • J. Neurosci., January 27, 2021 • 41(4):648–662                                                                     Hokenson et al. · Estrogen in Stress-Induced Memory Deficits

(Bourne and Harris, 2007; Kasai et al., 2010;
Maras et al., 2014; Chen et al., 2016). Spine
density is thought to be a proxy for the den-
sity of excitatory synapses. Therefore, we
tested the effects of MAS on apical dendritic
spine densities in low E2 and high E2 female
mice.
    First, we examined whether estrous cycle
phases themselves influenced dendritic spine
density in female mice. In rats, hippocampal
dendritic spine density has been found to
fluctuate across the estrous cycle peaking
during proestrus (Gould et al., 1990;
Woolley et al., 1990). Therefore, we com-
pared spine densities with regards to estrous
cycle phase in unstressed female mice using
planned comparison post-tests for the
ANOVAs of each spine subtype. Mean den-
sities of total or mushroom spines did not
differ between low E2 and high E2 control
mice (total: t(12) = 1.882, p = 0.16; mush-
room: t(12) = 0.16, p = 0.98). However, den-
sities of thin spines were significantly higher
in high E2 versus low E2 mice (t(12) = 3.88,
p = 0.004; Fig. 3A). We then determined the           Figure 3. Dendritic spine loss in CA1 of the dorsal hippocampus is induced by MAS in high E2 but not low E2 female
                                                      mice. Dendritic spines were visualized in mice expressing YFP in pyramidal cells under the control of the Thy1 promoter.
effects of MAS on the same dendritic spine
                                                      A, Under control conditions, mice with higher levels of estrogen had more thin spines but no difference in mushroom or
subtypes in low and high E2 female mice.              total (thin 1 mushroom) spines. B, High E2 control mice had thin (thin arrows) and mushroom spines (thick arrows) in
    MAS reduced spine densities in apical             the stratum radiatum of CA1. C, After MAS, high E2 mice selectively lost thin spines. Framed areas are enlarged in B-2
dendrites from dorsal CA1 of high E2 mice.            and C-2. Scale bars: B-1, C-1, 10 mm; B-2, C-2, 2 mm. D, Following 2 h MAS, there was no significant difference in total
Whereas cycle phase  MAS interaction                 number of spines between control or MAS mice in either cycle phase. E, Thin spines were greater in high E2 control
(F(1,12) = 4.41, p = 0.058) and main effects of       mice than low E2 control mice, but these spines were selectively reduced following MAS in the high E2 phase. F,
cycle phase (F(1,12) = 0.32, p = 0.58) and of         Mushroom spines remained intact following MAS in either cycle phase (n = 3-5 mice/group). pp , 0.05 (post-test).
MAS (F(1,12) = 2.43, p = 0.15; Fig. 3D) were          Points represent scores of individual animals. Error bars indicate 6 SEM.
not significantly different for total spine
counts, thin spines were significantly                                             cycle phases on fos expression were examined across subregions
affected. For thin spines, a significant cycle phase  MAS inter-                  of the dorsal hippocampus. In CA1, a field critical for spatial
action was identified (F(1,12) = 11.65, p = 0.005) as well as a main               memory and the site of spine loss following MAS in high E2
effect of MAS (F(1,12) = 12.99, p = 0.004), but not for cycle phase                female mice, there were no effects of MAS, cycle, or any interac-
(F(1,12) = 4.32, p = 0.06). The difference in thin spine densities                 tions (cycle  MAS interaction: F(1,20) = 0.006, p = 0.94; cycle:
between the control and MAS groups was confined to the high                        F(1,20) = 2.45, p = 0.13; MAS: F(1,20) = 0.16, p = 0.69; Fig. 4A).
E2 mice (t(12) = 4.44, p = 0.002; Fig. 3B,C), and not observed in                  Similarly, the number of fos1 cells in combined CA2 and CA3
low E2 mice (t(12) = 0.16, p . 0.99; Fig. 3E). MAS reduced thin                    did not differ in regards to cycle phase or MAS (cycle  MAS
spines in high E2 mice compared with control density; however,                     interaction: F(1,20) = 0.10, p = 0.75; cycle: F(1,20) = 3.51, p = 0.08;
thin spine density did not differ between low E2 MAS and high                      MAS: F(1,20) = 2.88, p = 0.11; Fig. 4B). Finally, in the DG, there
E2 MAS mice (t(12) = 0.94, p = 0.94). Mushroom spines were                         were more fos1 cells in low E2 mice than high E2 mice at base-
unaffected (cycle  MAS interaction: F(1,12) = 0.48, p = 0.50;                     line, with an effect of cycle (F(1,20) = 11.88, p = 0.003), but no
cycle: F(1,12) = 0.22, p = 0.65; or MAS: F(1,12) = 0.006, p = 0.94; Fig.           cycle  MAS interaction (F(1,20) = 1.67, p = 0.21) and no effect
3F). Thus, in accord with the findings in male mice, in which                      of MAS (F(1,20) = 1.87, p = 0.19; Fig. 4C). Fos cell counts differed
hippocampal estradiol is high and MAS impair memory, thin                          in the DG between low high E2 mice in control (t(20) = 3.50,
dendritic spines were reduced after MAS only in high E2 female                     p = 0.005) but not MAS (t(20) = 1.46, p = 0.29) mice.
mice in which memory was compromised by MAS.                                            To determine whether the MAS protocol used here indeed
                                                                                   led to significant neuronal activation measurable by fos expres-
Differential hippocampal activation during MAS does not                            sion levels, we quantified MAS-induced fos1 cells in the hypo-
explain estrous cycle-dependent memory impairment                                  thalamic PVN, an established stress-responsive brain region. The
The estrous cycle has been shown to influence responses to stress                  number of fos1 cells in PVN of MAS experiencing mice was sig-
in female rodents (Heck and Handa, 2019). As both spatial mem-                     nificantly higher than that in control mice (Fig. 4D). The number
ory deficits and thin spine loss provoked by MAS involved the                      of fos1 cells in the PVN demonstrated main effects of cycle
dorsal hippocampus, we tested whether MAS led to augmented                         (F(1,22) = 6.21, p = 0.02) and of MAS (F(1,22) = 41.26, p , 0.0001;
activation of hippocampal neurons in high E2 compared with                         Fig. 4E), without cycle  MAS interaction (F(1,22) = 1.18,
low E2 female mice.                                                                p = 0.29). Specifically, the number of fos1 cells was higher in
    Neuronal activation immediately following MAS was                              MAS versus control mice in both cycle phases (low E2: t(22) =
assessed using levels of the activity-regulated gene product fos                   3.77, p = 0.002; high E2: t(22) = 5.31, p , 0.0001). Additionally,
as in index of neuronal activity. The effects of MAS and estrous                   the number of fos1 cells following MAS was higher in high E2
Hokenson et al. · Estrogen in Stress-Induced Memory Deficits J. Neurosci., January 27, 2021 • 41(4):648–662 • 655
Figure 4. MAS-induced memory impairments are not explained by differential activation of the dorsal hippocampus. Activation of the dorsal hippocampus and hypothalamic paraventricular
nucleus (PVN) was assessed by quantifying fos1 cells in control or MAS mice in either cycle phase. A, fos1 cells did not differ with cycle phase or MAS in the CA1 region. B, Numbers of fos1
cells also did not differ with cycle phase or MAS in the CA2 and CA3 regions. C, In the DG, there was an effect of cycle on fos1 cells, with cell number distinguishing low E2 and high E2 in con-
trol but not MAS mice. D, E, fos1 cells in the hypothalamic PVN were more abundant following MAS in both groups, with a greater increase in activation in the high E2 group (n = 5-7 mice
per group). Scale bar, 100 mm. pp , 0.05 (post-test). Points represent scores of individual animals. Error bars indicate 6 SEM.
compared with low E2 mice (t(22) = 2.44, p = 0.046). This cycle quantified in select nuclei of the amygdala and the extended
difference was not observed in unstressed controls (t(22) = 1.03, amygdala in control and MAS-experiencing mice at both high
p = 0.53). Thus, these data demonstrated that MAS leads to neu- and low E2 cycle phases. The CeA plays a key role in stress
ronal activation within salient brain regions; and, for the PVN responses. Analyzing the number of fos1 cells in this nucleus, we
but not for the hippocampus, high E2 mice have enhanced MAS- identified a significant cycle MAS interaction (F(1,20) = 4.48,
driven neuronal activation. p = 0.047), but no effect of cycle (F(1,20) = 0.81, p = 0.38) or MAS
Importantly, these analyses demonstrated that, although hip- (F(1,20) = 0.01, p = 0.91). Despite the significant interaction of
pocampal memory impairment and dendritic spine loss were MAS and cycle, fos cell number did not differ in the CeA
observed preferentially in high E2 mice experiencing MAS, these between control and MAS in either cycle phase (high E2: t(20) =
effects were not a result of differential hippocampal activation 1.52, p = 0.27; low E2: t(20) = 1.48, p = 0.29). The number of fos1
patterns. cells for the CeA were as follows: low E2 control 26.71 6 5.38,
high E2 control 20.80 6 5.85, low E2 MAS 17.00 6 2.77, and
Estrous cycle phase influences neuronal activation in salient high E2 MAS 31.67 6 4.71. We then analyzed fos expression as a
brain regions, and modulates stress-induced activation function of cycle phase and MAS in the BLA, which projects
Stress-induced dendritic spine loss requires glutamate receptor- robustly to both ventral and dorsal hippocampus (Pikkarainen et
mediated neuronal activation (Andres et al., 2013). Given that al., 1999; Petrovich et al., 2001; Beyeler et al., 2018). In the BLA,
hippocampal activation did not explain the behavioral memory there was a significant cycle phase MAS interaction (F(1,20) =
impairments and dendritic spine loss observed, we examined 8.34, p = 0.009), a main effect of MAS (F(1,20) = 18.78, p = 0.0003),
activation in salient brain regions, defined as those afferent to, or but no effect of cycle (F(1,20) = 0.42, p = 0.52; Fig. 5A), on the
interconnected with, the hippocampus that might be differen- number of fos1 cells. The numbers of fos1 cells were significantly
tially affected by MAS or estrous cycle phase and thus drive func- increased by MAS in the BLA of high E2 female mice (t(20) =
tional hippocampal impairment. We chose a priori brain regions 4.90, p = 0.0002), but not in low E2 mice (t(20) = 1.07, p = 0.51).
involved in stress and memory which are interconnected with the Notably, the number of fos1 cells was higher in control low E2
hippocampus and determined fos expression in several regions than high E2 mice (t(20) = 2.48, p = 0.04). fos1 cell number in the
from the same mouse. We identified a significant brain region BLA was not different between high E2 MAS and low E2 MAS
MAS cycle interaction (F(10 206) = 3.071, p = 0.001) in a three- mice (t(20) = 1.60, p = 0.24).
way ANOVA, and therefore analyzed each region independently. In the MeA, there was a significant main effect of MAS
The amygdala is a key node of emotional processing and is (F(1,20) = 6.65, p = 0.02) but no cycle MAS interaction (F(1,20) =
highly susceptible to stress (Zhang et al., 2018). fos1 cells were 1.00, p = 0.33), or effect of cycle (F(1,20) = 0.007, p = 0.94; Fig. 5B).656 • J. Neurosci., January 27, 2021 • 41(4):648–662 Hokenson et al. · Estrogen in Stress-Induced Memory Deficits
Figure 5. Neuronal activation across the brain varies with cycle phase and in response to MAS. fos1 cells were quantified in the BLA, MeA, BNST, MS, LS, and the PVT. A, Whereas there
were fewer fos1 cells in BLA at baseline in the high E2 group, MAS resulted in a significant increase in fos1 cells in this group only. B, In the MeA, MAS increased the number of fos1 cells sig-
nificantly in high E2 mice but not in low E2 mice. C, In the BNST, MAS increased fos1 cell numbers in the low E2 group only. D, In the MS, there was a main effect of MAS that did not differ
between mice at different cycle phases. E, In the LS, there was an increase in fos1 cells following MAS in the high E2 group, but not the low E2 group. F, In the PVT, the number of fos1 cells
was augmented by MAS in the high E2 group only. G, Graphic summary of differences in fos counts across brain regions (n = 5-7 mice per group). pp , 0.05 (post-test). Points represent scores
of individual animals. Error bars indicate 6 SEM.
Fos cells were significantly increased by MAS in the MeA of high p = 0.057). For fos cells in the LS, there was an effect of cycle
E2 mice (t(20) = 2.43, p = 0.049) but not in low E2 mice (t(20) = (F(1,21) = 4.37, p = 0.049) and of MAS (F(1,21) = 9.18, p = 0.006)
1.17, p = 0.45). The anterior division of the BNST, a component but no cycle MAS interaction (F(1,21) = 2.11, p = 0.16; Fig.
of the extended amygdala, may play a role in inhibiting the neu- 5E). The increase in fos1 cells following MAS was significant in
roendocrine stress response by inhibiting the PVN (Radley et al., the high E2 group (t(21) = 3.23, p = 0.008) but not the low E2
2009; Radley and Sawchenko, 2011). In the anterior BNST, there group (t(21) = 1.10, p = 0.49). The number of fos1 cells was
was an effect of MAS (F(1,22) = 4.95, p = 0.04) but no cycle higher in high E2 MAS mice than in low E2 MAS mice (t(21) =
MAS interaction (F(1,22) = 2.14, p = 0.16), or effect of cycle 2.46, p = 0.04). Notably, there was no difference between con-
(F(1,22) = 0.03, p = 0.87; Fig. 5C). MAS increased fos cell number trols at either cycle phase (t(21) = 0.46, p = 0.88).
in the low E2 group (t(22) = 2.61, p = 0.03) but not the high E2 Arousing conditions including stress can activate the PVT,
group (t(22) = 0.54, p = 0.84). which is interconnected with the hippocampus (Kirouac, 2015).
Septal nuclei, especially the medial septum (MS), are The number of fos1 cells in the PVT was significantly affected by
involved in the generation of the theta rhythm of the hippo- MAS (F(1,22) = 23.05, p , 0.0001) with no cycle MAS interac-
campus, which supports memory processing (Courtin et al., tion (F(1,22) = 23.50, p , 0.0001), and no effect of cycle (F(1,22) =
2014). The MS has bidirectional connectivity with the hippo- 3.06, p = 0.09; Fig. 5F). The MAS-induced increase in fos was sig-
campus, whereas the lateral septum (LS) only receives unidi- nificant in the high E2 group (t(22) = 6.82, p , 0.0001) but not
rectional afferents from the hippocampus, but the two septal the low E2 group (t(22) = 0.03, p = 0.999). There were more fos1
subregions are interconnected (Tsanov, 2018; Agostinelli et al., cells in high E2 MAS than low E2 MAS mice (t(22) = 4.49,
2019). The number of Fos cells in the MS was influenced by p = 0.0004), but there was no difference between the control
MAS (F(1,21) = 4.82, p = 0.04), without cycle MAS interaction groups of either phase (t(22) = 2.28, p = 0.06).
(F(1,21) = 1.41, p = 0.25) or effect of cycle (F(1,21) = 1.37, p = 0.26; In summary, regions comprising nodes of the hippocampal
Fig. 5D). Despite an effect of MAS on fos in the MS, there were network and those involved in stress processing responded to
no significant differences following MAS in mice from either MAS in a region-specific and estrous cycle-dependent manner
cycle phase (high E2: t(21) = 0.73, p = 0.72; low E2: t(21) = 2.35, (data summarized graphically in Fig. 5G). Because theHokenson et al. · Estrogen in Stress-Induced Memory Deficits J. Neurosci., January 27, 2021 • 41(4):648–662 • 657
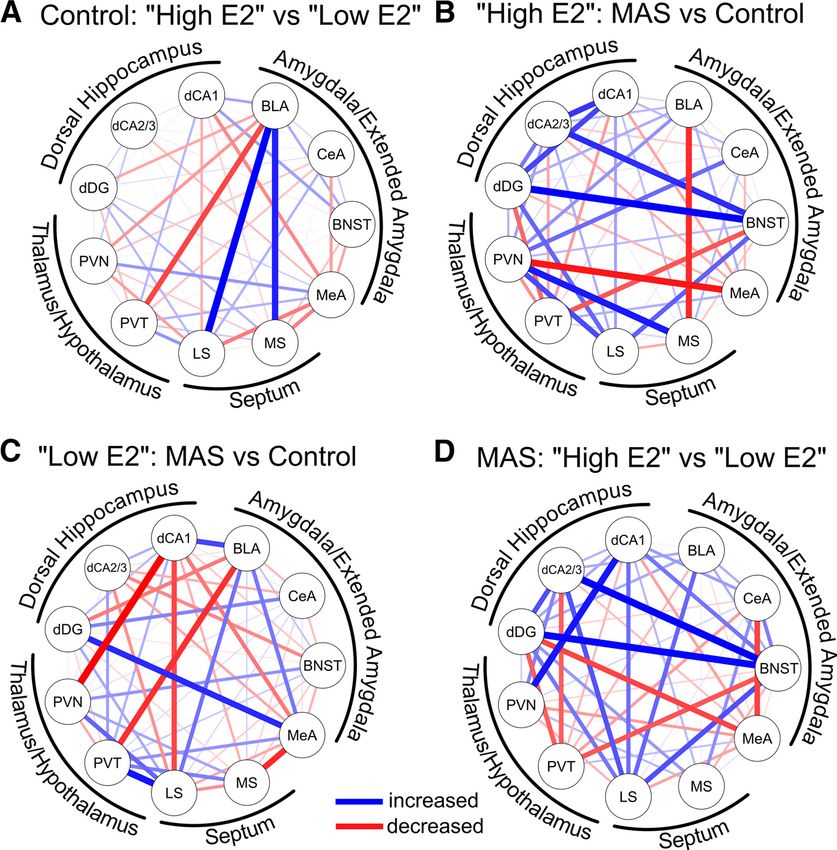
combinatorial activity of these regions and their projections to (Zobs = 1.93). In contrast, the effects of MAS on patterns of
the hippocampus might predict or contribute to MAS-related coactivation in low E2 mice, which did not lose spatial memory
loss of dendritic spines and spatial memory, we examined the following MAS, were distinct (Fig. 7C). Following MAS, there
functional connectivity of these regions, and determined func- was an attenuation of coactivation between PVN and CA1
tional network changes across cycle phases and as a result of (Zobs = 2.61), PVT and BLA (Zobs = 2.14), and MeA and MS
MAS. (Zobs = 2.03). Coactivation of LS and PVT (Zobs = 2.26) and
MeA and DG (Zobs = 2.19) was amplified after MAS. Notably,
Differential effects of cycle phase and MAS on functional there was no alteration in correlation between BLA and MS
networks among brain regions involved in stress and (Zobs = 0.42) following MAS in the low E2 mice.
memory These differential effects of MAS on high E2 versus low E2
Complex behaviors, including learning and memory, result from mice culminated in disparate network connectivity patterns
functional brain networks (Pattwell et al., 2016). Therefore, using observed when comparing high and low E2 mice after MAS (Fig.
fos expression as a marker of neuronal activity, we examined the 7D): The high E2 mice (with impaired spatial memory following
presence of functional connections among the brain regions MAS) had amplified coactivation between CA2/3 and BNST
identified above. We used Spearman correlation matrices of fos1 (Zobs = 2.66), DG and BNST (Zobs = 2.60), PVN and CA1 (Zobs =
cell numbers across all measured regions to identify coactivation 2.43), and LS and BNST (Zobs = 2.05). Amplified coactivation
between two given regions. Spearman correlation coefficients between BNST and DG, the first node in the hippocampal trisy-
close to 1 indicated a positive relationship of activation between naptic pathway, and BNST and CA2/3, might indicate tight
the two regions whereas values near 1 identified negative (anti- relation of salience/fear networks and the hippocampus, poten-
correlated) relations (Maras et al., 2014; Wiersielis et al., 2016; tially intruding on and disrupting normal memory processes.
Salvatore et al., 2018; Ruiz et al., 2020). Correlation matrices Furthermore, there was attenuated coactivation between PVT
were computed for each condition (high E2 control, high E2 and BNST (Zobs = 1.98), LS and PVT (Zobs = 2.39), MeA
MAS, low E2 control, and low E2 MAS; Fig. 6A–D). These corre- and CeA (Zobs = 2.22), and MeA and DG (Zobs = 1.96).
lation matrices provided evidence of coactivated regions
associated with each individual condition. Importantly,
they provided a method to compare the direction and
Discussion
strength of interregional coactivation as a function of MAS The principal findings of these experiments are as follows:
and estrous cycle phase. For example, correlations with the (1) MAS impair spatial memory in female mice, as previously
PVN (Fig. 6, yellow rectangle) are negative in high E2 con- found for males, and this impairment depends on the phase of
trol but shift to positive with MAS, whereas such a change the estrous cycle. (2) Spatial memory is impaired by MAS in pro-
is not evident among low E2 conditions. estrous females, when physiological estradiol levels are high,
We next examined the influence of cycle phase/estrogen levels but not during estrus, when estradiol levels are low. (3) Loss of
and MAS on these putative functional networks. To compare hippocampus-dependent memory is accompanied by loss of
two networks, correlation coefficients were converted to z scores dendritic spines, a proxy for excitatory synapses, in hippocam-
(Fisher’s r to z transformation), and the difference between these pal CA1 of high-estrogen females only. (4) Activation of brain
scores were calculated. A positive difference between the two z regions interconnected with the hippocampus, at basal condi-
scores (indicating that the first group had a stronger functional tions and following MAS, is modulated in a cycle-phase-de-
relationship between the two regions than the second), is pendent manner, suggesting a role for augmented network
denoted in blue. A negative difference (the first group had a connectivity in the MAS-provoked memory disruption of high
weaker relation), is denoted in red. In the absence of a difference, E2 females.
no connection is displayed. All differences in correlation coeffi- The present findings that higher levels of systemic estradiol in
cients (Zobs) are detailed in Table 1, and notable differences are a female mouse predict stress-induced memory impairment
elaborated on below. were unexpected (Fig. 1). Estradiol is thought to be neuroprotec-
Comparing control mice at high E2 versus low E2 cycle tive following stress or other neurologic disorders (Azcoitia et al.,
phases (Fig. 7A), we identified the BLA as a strongly connected 2019). For example, repeated restraint stress impaired temporal
hub in high E2 mice. Specifically, correlated expression of fos1 order recognition memory in male rats, whereas female rats were
cells between the BLA and MS (Zobs = 2.53) as well as between protected. These differences were estrogen-dependent because
the BLA and LS (Zobs = 2.89) was greater in high E2 versus low blocking estrogen production or receptors during stress rendered
E2 controls (indicated in blue). In contrast, correlations of the females vulnerable and activating estrogen receptors in males
BLA and the PVT, a region involved in processing the experience protected their memory (Wei et al., 2014; Luine, 2016). In vitro,
of a prior stress (Bhatnagar and Dallman, 1998; Bhatnagar et al., corticosterone may rapidly suppress NMDA-derived excitatory
2003; Hsu et al., 2014) was reduced (Zobs = 2.23, indicated in postsynaptic potentials in male hippocampal slices, but this sup-
red). pression is abolished by estradiol (Ooishi et al., 2012). Notably,
Looking at the consequences of MAS on neuronal coactiva- deleterious effects of higher estrogen levels during stress have
tion in high E2 mice (Fig. 7B) there was an increase in correlated been reported: high estrogen levels accelerated the acquisition of
fos expression between the BNST and the DG (Zobs = 2.30), indi- a conditioned response, but also provoked a more severe impair-
cating altered coactivation of components of the extended amyg- ment following tail shock (Shors et al., 1998). Ovariectomy
dala and the hippocampal network. Coactivation was also resulted in greater fear conditioning freezing behavior in females,
increased between the MS and PVN (Zobs = 2.47) and decreased and estradiol treatment reduced both contextual fear condition-
between the MeA and PVN (Zobs = 2.10) following MAS. ing and hippocampal LTP (Gupta et al., 2001). Female rats in
Compared with the correlation of BLA and MS in high E2 con- proestrus were more sensitive to an acute stress that impaired
trols compared with low E2 control mice (Fig. 7A), correlation PFC-mediated spatial delayed alternation task compared with
between these two regions was reduced in high E2 MAS mice those in estrus (Shansky et al., 2006). Estradiol replacement inYou can also read