Unlocking weather observations from the Societas Meteorologica Palatina (1781-1792) - CP
←
→
Page content transcription
If your browser does not render page correctly, please read the page content below

Clim. Past, 17, 2361–2379, 2021
https://doi.org/10.5194/cp-17-2361-2021
© Author(s) 2021. This work is distributed under
the Creative Commons Attribution 4.0 License.

Unlocking weather observations from the Societas
Meteorologica Palatina (1781–1792)
Duncan Pappert1,2 , Yuri Brugnara1,2 , Sylvie Jourdain3 , Aleksandra Pospieszyńska4,5 , Rajmund Przybylak4,5 ,
Christian Rohr2,6 , and Stefan Brönnimann1,2
1 Institute of Geography, University of Bern, Bern, Switzerland
2 Oeschger   Centre for Climate Research, University of Bern, Bern, Switzerland
3 Direction de la Climatologie et des Service Climatiques, Météo-France, Toulouse, France
4 Faculty of Earth Sciences and Spatial Management, Nicolaus Copernicus University, Toruń, Poland
5 Centre for Climate Change Research, Nicolaus Copernicus University, Toruń, Poland
6 Institute of History, University of Bern, Bern, Switzerland

Correspondence: Stefan Brönnimann (stefan.broennimann@giub.unibe.ch)

Received: 18 May 2021 – Discussion started: 28 May 2021
Revised: 1 October 2021 – Accepted: 8 October 2021 – Published: 15 November 2021

Abstract. In recent years, instrumental observations have         Even the shorter series could be ingested into reanalyses and
become increasingly important in climate research, allow-         improve the quality of large-scale reconstructions.
ing past daily-to-decadal climate variability and weather ex-
tremes to be explored in greater detail. The 18th century saw
the formation of several short-lived meteorological networks
of which the one organised by the Societas Meteorologica          1   Introduction
Palatina is arguably the most well known. This network stood
out as one of the few that efficiently managed to control its     For some decades now, early instrumental observations have
members, integrating, refining, and publishing measurements       increasingly played an important role in climate research
taken from numerous stations around Europe and beyond.            (see Jones, 2001, and Brönnimann et al., 2019). Not only
Although much has been written about the network in both          have they shown enormous potential in reconstructing past
history, science, and individual prominent series used for cli-   changes in temperature, pressure, and precipitation, but they
matological studies, the actual measurements have not yet         also allow for daily-to-decadal variability and extremes to be
been digitised and published in extenso. This paper repre-        studied in great detail, particularly in 18th- and early 19th-
sents an important step towards filling this perceived gap in     century Europe (e.g. Brázdil et al., 2010; Camuffo et al.,
research. Here, we provide an inventory listing the availabil-    2010; Csernus-Molnár et al., 2014; Pfister et al., 2019, 2020).
ity of observed variables for the 37 stations that belonged       The observations made by the extensive network of the Soci-
to the society’s network and discuss their historical context.    etas Meteorologica Palatina (henceforth referred to as SMP),
Most of these observations have been digitised, and a con-        or Palatine Meteorological Society, represent a major source
siderable fraction has been converted and formatted. In this      for this research.
paper, we focus on the temperature and pressure measure-             Although it enjoys relatively great fame among historical
ments, which have been corrected and homogenised. We then         climatologists, the abundant weather information published
demonstrate their potential for climate research by analysing     by the society has yet to be understood in more depth. A lot
two cases of extreme weather. The recovered series will have      of research has followed a historical approach, focusing on
wide applications and could contribute to a better under-         the origins of the society and its members as well as its con-
standing of the mechanisms behind climatic variations and         tributions to the development of meteorology (Traumüller,
extremes as well as the societal reactions to adverse weather.    1885; Kington, 1974; Feldman, 1983; Cassidy, 1985; Wege
                                                                  and Winkler, 2004; Lüdecke, 2004, 2010; Vinther et al.,

Published by Copernicus Publications on behalf of the European Geosciences Union.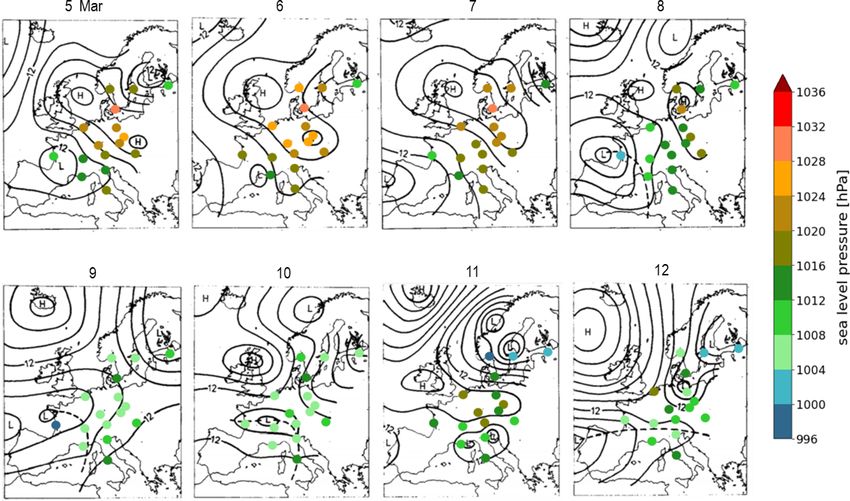
2362                           D. Pappert et al.: Unlocking weather observations from the Societas Meteorologica Palatina

2006). Data from the society have been used for climatolog-        yearly publications; we then provide a detailed explanation
ical analysis, although mostly making use of single stations       of the data rescue procedure and the corrections applied to
(Przybylak et al., 2014; Raicich et al., 2015; Camuffo et al.,     the temperature and pressure observations, including meth-
2017; Häderli et al., 2020) and rarely looking at more than a      ods of comparison to explore their potential. In Sect. 3 we
couple (Brázdil et al., 2010; Yiou et al., 2014). Aspaas and       present the findings from the analysis of SMP data for con-
Hansen (2012) analysed occurrences of the aurora borealis          sistency and availability, results from quality tests of the tem-
recorded by the different stations as well as the phenologi-       perature and pressure data, and results from the analysis of
cal comments in the SMP’s annual reports. In his book The          two case studies. Their implications are interpreted and dis-
Weather of the 1780s over Europe, Kington (1988) used the          cussed in Sect. 4, after which we make our concluding re-
available station data from this decade – including several        marks.
stations from the SMP – to create hand-drawn daily syn-
optic weather maps, showing that prevailing weather situa-
                                                                   2     Source and methods
tions over Europe at the time (with regard to moving pres-
sure systems) could be reconstructed and analysed. More re-        2.1    The SMP network and the Ephemerides
cently, various data rescue projects, such as IMPROVE (Ca-
muffo and Jones, 2002), HISTALP (Auer et al., 2007), the           The Enlightenment movement of the 18th century saw scien-
ANR project (CHEdaR, 2014), and CHIMES (Brugnara et                tists make substantial contributions to the design of precise
al., 2020b), have incorporated larger portions of the data for     instruments of physics. More and more members of the sci-
reconstructing long high-quality series.                           entific community were calling for the improved quantifica-
   Despite these important efforts, work on SMP data has           tion and standardisation of weather observations as well as
been scattered and only a small fraction of the overall mea-       a more rigorous discipline in recording this information in
surements has been used in modern climate research; much           a consistent manner that would allow for a cohesive char-
of the data had yet to be digitised or published in extenso.       acterisation of climate. The late 18th century witnessed a
There is more to be done with regard to unlocking the full         greater synthetic vision among meteorologists, marking a de-
potential of the data gathered by the SMP over 230 years           parture from the chaotic data gathering style that had char-
ago. This study takes an important step toward filling this        acterised the preceding decades (Feldman, 1983). A num-
perceived gap in research by making many of the SMP’s ob-          ber of short-lived national and international networks were
servations available for future climate research. We provide       zealously pursuing a more organised form of meteorology. In
an inventory of all meteorological observations made by the        1776, 2 years after publishing his influential Treaty on Me-
stations belonging to the network to assess data availability.     teorology, Père Louis Cotte began compiling data from sev-
Most of these measurements have been digitised and are pub-        eral locations in France for the Société royale de médecine,
lished with this paper. We also add converted and corrected        based in Paris (Cotte, 1774). In Padua, the Director of the
temperature and pressure measurements from all SMP sta-            Astronomical Observatory, Giuseppe Toaldo, whose prize-
tions, which are here assessed for their quality, to this new      winning work on the physical influence of weather on agri-
dataset. Finally, we explore the potential of the recovered se-    culture would spur the optimism of other networks (Toaldo,
ries for climate research by analysing two historical cases of     1775), had been taking meteorological measurements since
extreme weather.                                                   1766. Additionally, Toaldo set up a network of precipitation
   Our work restates the importance of the society and its es-     measurements in Italy during the 1780s that functioned for
tablished role in the history of meteorology with regard to        nearly 30 years. Another meteorological programme was or-
its methods of measuring and compiling weather observa-            ganised by the Oekonomische Gesellschaft Bern, which had
tions. Following in the steps of previous data rescue projects,    distributed instruments to a number of stations in the then Re-
this project establishes a useful new historical climatologi-      public of Bern (OeGB, 1762; Pfister, 1975). Other networks
cal database, although it stands out from previous efforts due     included the early Dutch meteorological society, Natuur-
to the sheer quantity of digitised observations and processed      en Geneeskundige Correspondentie-Sociëteit (1779–1802),
series being published. These observations will be important       led by Jan Hendrik van Swinden, and the Spanish network,
for studying past climatic variations and weather variability;     Real Academia de Médica Matritense (1780–1825), based in
they will also hold value for the improvement of reanalysis        Madrid.
products that extend to the pre-industrial period. In fact, one       The SMP is commonly regarded as the most successful
of the main added values of this database in comparison with       and prolific among these organisations, whose work, accord-
existing products is its sub-daily resolution; as such, it could   ing to Theodore S. Feldman, “was not surpassed for three-
contribute to research on high-resolution reconstructions and      quarters of a century” (Feldman, 1990, p. 154). Founded in
lead to increased knowledge about historical weather.              1780 by the Elector Palatine of Bavaria, Karl Theodor, and
   To better explore the value of the database, this paper is      directed by his secretary, Johannes Jakob Hemmer, the SMP
organised as follows. In Sect. 2 we give some historical con-      stood out as one of the few networks that efficiently managed
text to the society’s network and explore the contents of its      to control its members, integrating, refining, and publishing

Clim. Past, 17, 2361–2379, 2021                                                       https://doi.org/10.5194/cp-17-2361-2021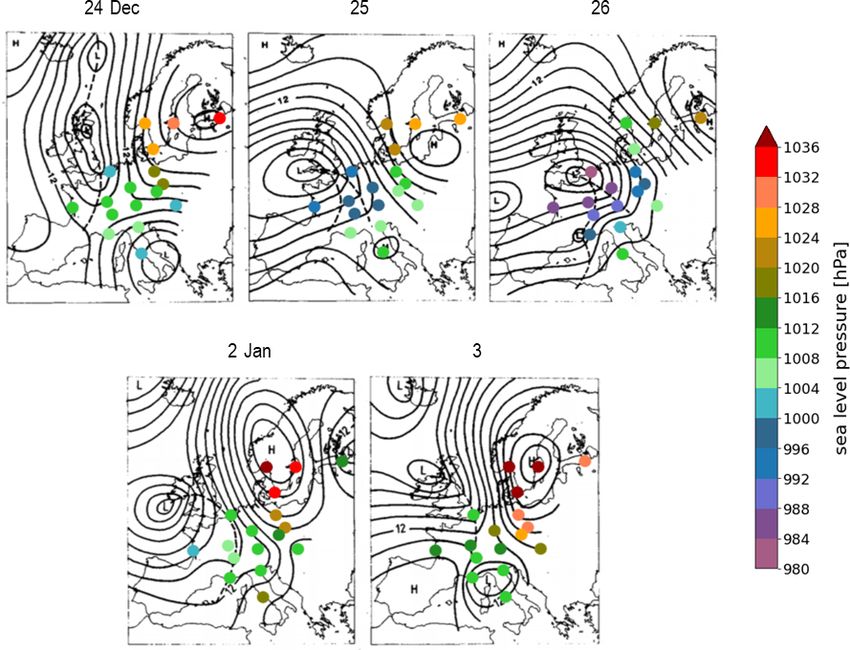
D. Pappert et al.: Unlocking weather observations from the Societas Meteorologica Palatina                                      2363

measurements taken from numerous stations around Europe             can be found – among other places – online on the website
and beyond (Kington, 1974; Cassidy, 1985). Eventually, the          of the library website of the Ludwig Maximilian University
society’s increasing financial difficulties along with the polit-   of Munich. The Ephemerides are structured in two parts; the
ical confusion and social turmoil caused by the French Rev-         main portion being the observationes integrae (extended ob-
olution brought about the collapse of the society in 1795 –         servations), containing the sub-daily measurements and ob-
which had already been in decline after the death of Hem-           servations, and the appendix or observationes meteorolog-
mer in 1790 – and brought a swift decline to meteorology;           icae in compendium redactae (synopsis), which comprises
this slump would last until the start of continuous measure-        the monthly means and other summary statistics. The publi-
ments by national networks in the 1830s. Nevertheless, what         cations for 1781 and 1792 only contain the extended obser-
the SMP and its members achieved in the late 18th century           vations. For 1787–1788, the format was temporarily changed
in terms of coordination and discipline of observations meant       to comprise a pars prior and a pars posterior containing a re-
that researchers today have a wealth of more detailed and or-       spective smaller sub-daily section and an extended appendix
ganised information about the weather of the time.                  with both daily means and monthly summaries (see Sect. 3).
   In the period from 1781 to 1792, a total of 37 stations con-     In some volumes, there is an additamentum (addition) to in-
tributed to Hemmer’s project (see Table 1). The stations cov-       clude observations that had not made it to print for the previ-
ered a wide area of mainland Europe, stretching from Rome           ous publications.
in the south, La Rochelle in the west, and reaching as far             Figure 2 shows an example of the typical arrangement
north-east as St. Petersburg and Moscow (Fig. 1). As such,          of sub-daily data in the publications. The table is clear and
the data of the SMP are well placed for an extensive study to       straightforward: above the table, the station, the name of the
be made of Europe’s climate variability and extreme events          observer, the observation times, and the month in question
during that decade. Notably, there was a number of stations         are given; for each day, the table itself contains measure-
beyond mainland Europe that were also part of the SMP,              ments from the barometer (pressure), indoor thermometer
which included Cambridge, Massachusetts in North Amer-              (room temperature), outdoor thermometer (air shade temper-
ica, Godthaab in Greenland, and Pyshminsk in Siberia.               ature), hygrometer (humidity), declinometer (magnetic dec-
   In 1780, working in Mannheim, Carlo Artaria began to             lination), wind vane (wind direction and force), rain gauge
manufacture the meteorological instruments that were to be          (rainfall), and an atmidometer (evaporation). Water level
distributed to the measuring sites of the network. These            measurements of rivers and lakes were also taken where pos-
instruments were a mercury barometer, two mercury ther-             sible (in the example of Budapest in Fig. 2, for the river
mometers, a hygrometer, and for some selected sites, a mag-         Danube). Additionally, the SMP adopted a common symbol-
netic declinometer (Grenon, 2010), all of which had been            ogy to describe the phase of the moon, the state of the sky,
standardised, gauged, and calibrated to be almost identical,        and significant weather and special phenomena, including
so that comparing measurements at a later time would be             rain, hail, snow, frost, fog, and thunderstorms. An illustration
more straightforward. Other instruments, such as the plu-           of these symbols can be found in Kington (1988, p. 24).
viometer and wind vane, were to be constructed locally by              The protocol and instructions set out by the SMP were
the observers; these instruments did not require any cali-          mostly followed, although not without the odd departure. The
bration and only needed to be placed according to Hem-              Russian stations and Cambridge (US) initially used their old
mer’s instructions. The instruments are described in great          instruments and did not receive their Réaumur thermome-
detail in their first publication (Ephemerides, 1795, 1783,         ters until years later; in fact, delivering the instruments intact
pp. 59–90). Using scientific Latin to overcome language dif-        to these remote locations represented an enormous logistical
ferences, the SMP specified how to work with the instru-            hurdle. That these stations used different instruments with
ments, where to place them, when to take the measurements,          different scales may at first seem to go against the idea of
and in what style the observations should be written down.          having a robust network of comparable standardised instru-
They were instructed to take measurements of pressure, tem-         ments, but variation was not prohibited. The perfection and
perature, precipitation, magnetic declination, wind direction       improved construction of instruments was of the utmost im-
and force, evaporation, height of rivers and lakes, clouds and      portance to observers. Stationed in Marseille, Guillaume de
state of the sky, three times a day, ideally at 07:00, 14:00,       Saint-Jacques de Silvabelle was keen to warn readers that the
and 21:00 LT (local time), using common units and symbol-           barometer initially sent to him by the SMP did not contain
ogy. The data were then dispatched to the headquarters in           enough mercury, and as a result, 1782–1783 pressure mea-
Mannheim, where it was assembled and published in the an-           surements were three lines too high; this issue was fixed in
nual Ephemerides Societatis Meteorologicae Palatinae. It is         1784 (Ephemerides, 1795, 1785, p. 498). Thus, as long as the
these yearly publications that form the basis for the data res-     observers’ own instruments were in very good accord with
cue project presented in this paper.                                those of the SMP, they could be used. This practice is known
   There are a total of 12 volumes published from 1783 to           to have been the case for Dijon and St. Petersburg, which also
1795, containing observations for the period from 1781 to           sent data measured with their own old devices (Euler, 1782;
1792. The original volumes have already been scanned and            Maret, 1783).

https://doi.org/10.5194/cp-17-2361-2021                                                         Clim. Past, 17, 2361–2379, 2021
2364                              D. Pappert et al.: Unlocking weather observations from the Societas Meteorologica Palatina

Table 1. List of stations that belonged to the SMP network, including information about height above sea level (estimations based on
available information), latitude (ϕ), longitude (λ), and period for which data are available in the Ephemerides. This is loosely based on a list
by Cassidy (1985, pp. 23–24), which does not specify the resolution of the observations.

                       Station                Abbreviation              z       ϕ            λ            Period covered
                                                               (m a.s.l.)      (◦ )        (◦ )
                       Andechs                AND                   710     47.97        11.18                1781–1792
                       Berlin                 BRL                     45    52.52        13.40                1781–1788
                       Bologna                BOL                     74    44.49        11.34     1782–1784, 1787–1792
                       Brussels               BRU                     60    50.85         4.35                1782–1792
                       Budapest               BUD                   168     47.50        19.04                1781–1792
                       Cambridge (US)         CAM                      9    42.37       −71.11                1782–1787
                       Copenhagen             COP                     40    55.68        12.57                1782–1788
                       Delft                  DEL                      2    52.10         5.19                1784, 1786
                       Den Haag               HAG                      2    52.07         4.30                1782–1783
                       Dijon                  DIJ                   250     47.32         5.04                1783–1784
                       Düsseldorf             DUS                     30    51.23         6.77                1782–1784
                       Eidsberg               EDS                     70    59.54        11.36                      1787
                       Erfurt                 ERF                   202     50.98        11.03                1781–1788
                       Geneva                 GEN                   380     46.20         6.14                1782–1789
                       Godthaab (GL)          GDH                      –    64.17       −51.70                1786–1787
                       Gotthard               GOT                  2093     46.55         8.57                1781–1792
                       Göttingen              GTN                   150     51.53         9.93          1783–1785, 1787
                       Hohenpeissenberg       HOH                    977    47.80        11.01                1781–1792
                       Ingolstadt             ING                   369     48.75        11.43                1781–1782
                       La Rochelle            ROC                     19    46.16        -1.15                1782–1790
                       Mannheim               MAN                    112    49.49         8.47                1781–1792
                       Marseille              MAR                     44    43.30         5.36                1782–1792
                       Middelburg             MID                     15    51.49         3.61                1782–1788
                       Moscow                 MOS                    130    55.76        37.62     1783–1789, 1791–1792
                       Munich                 MUN                    525    48.13        11.58                1781–1792
                       Padua                  PAD                     18    45.41        11.88                1781–1792
                       Prague                 PRA                    200    50.07        14.44     1781–1787, 1789–1791
                       Pyshminsk (RU)         PYS                      –    56.98        60.59                1789–1790
                       Regensburg             REG                    346    49.01        12.10                1781–1791
                       Rome                   ROM                     56    41.90        12.50                1782–1792
                       Spydeberg              SPY                    110    59.62        11.08                1783–1786
                       St. Petersburg         PET                     15    59.93        30.36                1783–1792
                       St. Zeno               ZEN                   480     47.73        12.88                      1781
                       Stockholm              STO                   44.4    59.34        18.06                1783–1792
                       Tegernsee              TEG                   740     47.72        11.77                1781–1789
                       Würzburg               WUR                   200     49.79         9.93                1781–1788
                       Żagań                ZAG                   116     51.37        15.19                1781–1792

   Clearly, the scientific dedication and participation of like-            2.2       The new SMP database
minded people was crucial to the project. The observers had
been carefully selected by the SMP from academies, monas-                   2.2.1      Inventory
teries, and universities across Europe to ensure that observa-
tions would be taken even after the death of initial observers              The Ephemerides entailed a lot of patching work by Hem-
(Cassidy, 1985). Indeed, it was Hemmer’s decision to target                 mer’s team in Mannheim, who were clearly interested in
organisations rather than individuals that contributed to the               including as much information as was reasonably possible.
SMP’s collaborative success. Despite the guaranteed conti-                  They included a lot of information loosely related to meteo-
nuity of the observations, the gathered measurements were                   rology but not limited to it, always serving the interest of eco-
still a product of the specific observer and, therefore, suscep-            nomic and cultural betterment; these included reports about
tible to heterogeneity.                                                     agriculture and medicine as well as occasional material con-
                                                                            cerning plant and human geography. Therefore, to enable a
                                                                            more systematic understanding of the weather information

Clim. Past, 17, 2361–2379, 2021                                                                    https://doi.org/10.5194/cp-17-2361-2021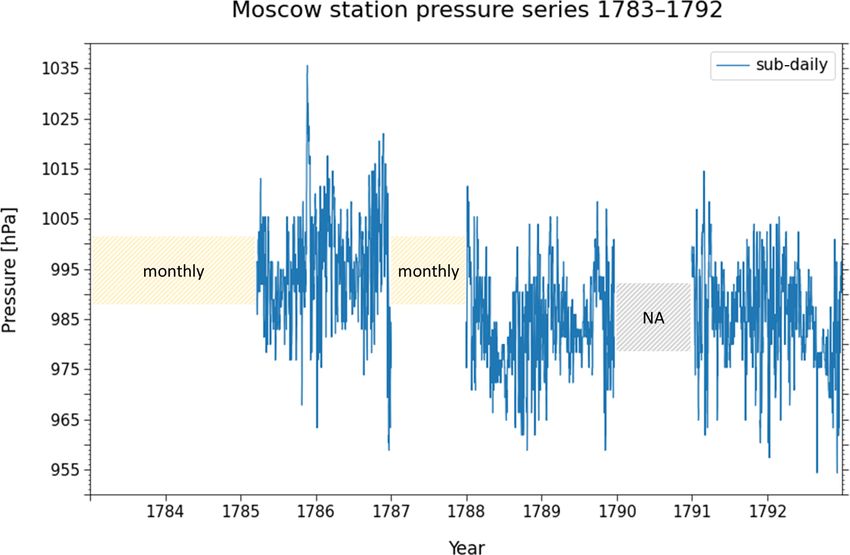
D. Pappert et al.: Unlocking weather observations from the Societas Meteorologica Palatina                                          2365

Figure 1. Network of stations that contributed to the Ephemerides of the Societas Meteorologica Palatina – see Table 1 for abbreviations.
Dots represent those stations that contributed for 7 or more years of the total 12-year period from 1781 to 1792; locations with a cross
are stations that sent measurements for fewer than 7 years. This distinction is made to broadly convey the varying extent of the stations’
participation. Not shown on the map are the stations at Cambridge (US), Godthaab (GL), and Pyshminsk (RU).

that these publications provide to historical climatologists,          sents an important step in the systematic rescue and evalua-
this study presents the meteorological observations in a way           tion of the SMP’s observations, and it can be found as a .csv
that is easier to visualise and analyse. We created a straight-        file in the Supplement.
forward inventory focusing mainly on instrumental observa-
tions. The aim is to display the availability of observations          2.2.2    Data processing
for most parameters: we excluded descriptions of the state
of sky and form of clouds as well as any astronomical, phe-            In the context of this study, almost all variables from the 37
nological, and demographic observations. Thus, it contains             stations listed in the inventory were digitised by key entry on
basic information about the availability of measurements for           spreadsheets, including the observations about the state of
the 37 stations that participated in the SMP project.                  the sky, and are available in the Supplement to this paper. Of
   For each station of the network and for each year of the 12-        these variables, temperature and pressure underwent conver-
year periods, our inventory lists the years for which they re-         sions and corrections necessary for later scientific use. The
ported measurements and which parameters were being mea-               choice to focus on these two variables is based on – besides
sured (see Fig. 2); if data are available, the cell was marked         their primary value in climate reconstruction – the advantage
with an “X”. The last four columns contain information about           of being measured with carefully calibrated and standard-
the resolution of the data (sub-daily, daily, or monthly), the         ised instruments, which ensures a more precise quantification
observer or correspondent who took/oversaw the observa-                and, thus, less effort to process. Converting and correcting
tions, any relevant comments, and the page range from the              the other digitised variables would require significantly more
corresponding Ephemerides volume where the observations                time, care, and effort. For instance, the SMP hygrometer that
in the inventory can be found. In some cases, a variable will          measured humidity had also been standardised and supplied
be available at a sub-daily resolution and as monthly sum-             free of charge, but it is unclear what the exact units being
maries; here, the highest available resolution is reported. The        used are (although Camuffo et al., 2013, offers some sug-
main patterns revealed by the inventory with regard to data            gestions to convert such arbitrary units); the rain gauges that
coverage and consistency are presented in Sect. 3.1. This in-          quantified precipitation were designed locally and, hence,
ventory can be maintained as a living document and updated             come in several different units, some of which are based on
by future researchers who study the Ephemerides, it repre-             specific regional subdivisions of weight units. Conversely,
                                                                       we know that the thermometers and barometers provided by

https://doi.org/10.5194/cp-17-2361-2021                                                             Clim. Past, 17, 2361–2379, 2021
2366 D. Pappert et al.: Unlocking weather observations from the Societas Meteorologica Palatina
cally usable values begins with the unit conversion; for tem-
perature observations the conversion from Réaumur to Cel-
sius is straightforward:
TC = TR × 1.25. (1)
At times, the SMP’s Russian stations used thermometers in
the Delisle scale, and the station in Cambridge (US) initially
sent observations taken with a Fahrenheit thermometer. For
these units, the conversion to Celsius is done as follows:
TC = 100 − TD × 2/3 (2)
TC = (TF − 32)/1.8. (3)
In a second step, temperature values were corrected for a pos-
itive freezing-point bias due to the tendency of the freezing
point of thermometers to gradually rise (Winkler, 2009). One
postulated explanation for this phenomenon was the rapid
cooling of the glass walls of the thermometer after the manu-
facturing process; this would cause a realignment of the glass
molecules over several years as the glass was being slowly
compressed by external air pressure (Bellani, 1808; Yelin,
1824). The rise of the 0 ◦ C point can be corrected easily by
assuming that the correction used in Winkler (2009) can be
applied to all stations; that is, a stepwise −0.1 ◦ C yr−1 ex-
tended over the first 6 years of observations. This correction
was applied to all series with the exception of Cambridge
Figure 2. Example of a typical table of sub-daily measurements for
(US), Dijon, Middelburg, Moscow, Stockholm, and St. Pe-
the period from 1 to 15 January 1789, in this case showing observa-
tersburg, which are known to have used instruments of their
tions for Budapest, recorded by Ferenc Xavér Bruna (Ephemerides,
1795, 1791, p. 278). own, as well as the few stations that began sending data after
1785. Another known problem of the SMP thermometer is
that it was only graduated until −16 ◦ Ré, meaning that when
the mercury dipped below this mark, the observers estimated
the Palatine Metrological Society for their network reflected
the value by visual extrapolation, which makes lower temper-
the standard of the time and were already rather accurate (see
atures less accurate. The correction of any larger, non-linear
e.g. the literature from the IMPROVE project – Camuffo and
errors is mainly related to the exposure of the thermometer;
Jones, 2002). In fact, reliable international calibration stan-
these strongly depend on each station’s specific configuration
dards were already in place by the time the society was estab-
and are beyond the scope of this paper.
lished (Cavendish et al., 1777), meaning that the observations
For pressure measured with a mercury barometer, the full
require few corrections beyond the ones described in this sec-
conversion requires more steps. The first is a temperature cor-
tion. It should be noted that we did not analyse the specific
rection to take the thermal expansion of the mercury into ac-
surroundings of the sites of the observatories themselves, as
count:
has been done in some studies for Hohenpeissenberg (Wege
and Winkler, 2004; Winkler, 2009) and Żagań (Przybylak et L0 = (1 − γ T )Lmm , (4)
al., 2014), but we rely instead to a certain degree on the ad-
herence of the stations to the recommendations given by the where γ is the thermal expansion coefficient of mercury at
SMP on the positioning of the instruments. 0 ◦ C (1.82 × 10⁻⁴ K−1 ), T is the temperature of the barom-
The pressure readings were taken from a cistern barome- eter (or room temperature) in degrees Celsius, and Lmm is
ter, filled with mercury, graduated in Paris inches and pro- the original observation in millimetres – for Paris inches
vided with a Vernier scale. The thermometers were of the the conversion factor is 27.07 mm. It should be noted that
mercury-in-glass type, in degrees Réaumur: one was to be some observers at the time would reduce their observations
mounted indoors, affixed to the barometer, to aid in the cor- to other temperatures, with 10 ◦ Ré being a common standard
rection of the pressure readings, and the second was to be (Brugnara et al., 2015); this is assumed to be the case for
mounted outside, facing north, sheltered from direct sun- pressure values sent to Mannheim by the Russian stations.
shine, but allowing the free passage of air. The transforma- For the daily means presented in the appendices of each
tion of the digitised data from raw observations to scientifi- Ephemerides volume, no barometer temperatures are given.
Clim. Past, 17, 2361–2379, 2021 https://doi.org/10.5194/cp-17-2361-2021D. Pappert et al.: Unlocking weather observations from the Societas Meteorologica Palatina 2367
Differences with the corrected pressure series of neighbour- and longer were tested for homogeneity visually by apply-
ing stations show a seasonal cycle – one that reflects the cycle ing the Craddock test (Craddock, 1979). This involves test-
of the (room) temperature of the barometer – indicating that ing each series against other series based on their monthly
these averages in the appendices were likely not reduced to cumulative differences according to the following equation:
0 ◦ C. Thus, in order to get a good estimate of the room tem-
c (ti ) = c (ti−1 ) + x c − x r + xr (ti ) − xc (ti ) , (7)
perature climatology corresponding to the daily mean pres-
sure in the tables, these values were extrapolated from the where c(t0 ) is equal to zero, the candidate series to be tested
outdoor temperature for each station using a linear regres- is xc (t1 . . .tn ), and the reference series is xr (t1 . . .tn ). If ei-
sion based on the strong linear relationship between indoor ther series is inhomogeneous – i.e. their mean has a sudden
and outdoor temperature in the available sub-daily observa- change – c will exhibit a sharp change in slope. It is use-
tions of other years. ful to plot c several times against multiple well-correlated
The next step is a unit conversion of the mercury column reference series in order to better detect the inhomogeneity
from millimetres to hectopascals (hPa) and the application (or break point) and to avoid making bad corrections (see
of a gravity correction that takes the latitudinal and height- Fessehaye et al., 2019). According to Venema et al. (2012),
dependent variation of gravity acceleration into account: the Craddock test allows for good accuracy compared with
other break point detection tests, although the manual effort
P0 = ρgϕ,h L0 × 10−5 , (5) involved is higher, meaning that it is better suited to smaller
datasets such as the one in this study. Furthermore, there is
where P0 is the absolute pressure (in hPa), ρ is the density some subjectivity in the selection of break points: the choice
of mercury at 0 ◦ C (1.35951 × 10⁴ kg m−3 ), gϕ,h is the lo- to homogenise or not is linked to the specific approach of the
cal gravity acceleration (estimated from latitude ϕ and alti- researcher (Brunetti et al., 2006).
tude h; see Brugnara et al., 2015), and L0 is the temperature- Series with inhomogeneities were adjusted using a con-
corrected barometric reading (in mm) calculated in Eq. (4). stant correction. These corrections were computed by calcu-
Finally, a reduction of the measurements to mean sea level is lating the mean difference between the candidate series and
performed for use in the synoptic analysis: the reference series before and after the break point. For in-
gϕ,h stance, if the difference of a given pressure series with re-
R ×h spect to the reference is on average 3 hPa before the break
PSLP = P0 × exp , (6)
Text + a × h2 point and 7 hPa after, the correction is to be 4 hPa. The more
reference series that are available to calculate this mean dif-
where R is the gas constant for dry air, a is the standard lapse ference, the more accurate the estimated correction will be.
rate of the fictitious air column below the station, and Text is Where possible, corrections were applied at the sub-daily
the outside temperature of the station in question. level, and QC tests were performed again to ensure no fur-
Following the unit conversion, we performed quality con- ther errors were being introduced. The results from the ho-
trol tests to detect any errors present in the series. Many mogeneity tests as well as those from the quality control are
outliers are typically due to mistypes that occurred during presented in Sect. 3.2.
the digitisation, although several could be due to transcrip- The corrected temperature and pressure series in our
tion errors made by the original observer, or even during the database are not only presented in their original resolution:
printing process. When possible and deemed reasonable, af- daily mean values were computed from the sub-dailies and
ter careful inspection of the original source, the values were concatenated to daily means published by the SMP. For tem-
corrected, otherwise they were flagged as suspicious. To aid perature, the calculation of daily means from sub-daily mea-
in their detection, the Copernicus Climate Change Service surements was weighted considering the known observation
(C3S) Quality Control (QC) software provides R functions times to represent the true means with respect to the Coordi-
that identify climatic outliers (values outside the interquartile nated Universal Time (UTC) day. The SMP daily means of
range), occurrences of equal consecutive values, and records 1787–1788 were also adjusted using the known observation
where the observations exceed the tolerances suggested for times from the closest year for which these are available. This
temperature and pressure time consistencies from the World adjustment was done using monthly mean diurnal cycles of
Meteorological Organization (WMO), among other quality 2 m temperature at the nearest grid point in the ERA5-Land
tests (Brugnara et al., 2020a). Visual plots were also used to reanalysis (Muñoz-Sabater, 2019; Hersbach et al., 2020), cal-
inspect the data as an alternative test for erroneous values. culated over the period from 2001 to 2018. The choice of the
Homogenisation is a final step typically performed to iden- type and length of the reference diurnal cycle can have dif-
tify and remove systematic biases – i.e. non-climatic influ- ferent effects on the adjustment of daily means. Thus, for
ences – that may have arisen in the climate time series. This comparative purposes, a corrected version of the Żagań tem-
can be due to a change in the local environment, the instru- perature series from Przybylak et al. (2014) is available in
ment, the observer, or perhaps even a change in observational the Supplement, which used hourly temperature data from
procedures. Thus, temperature and pressure series of 7 years Wrocław for the period from 1999 to 2003. The conversion
https://doi.org/10.5194/cp-17-2361-2021 Clim. Past, 17, 2361–2379, 20212368 D. Pappert et al.: Unlocking weather observations from the Societas Meteorologica Palatina Figure 3. Bar charts showing (a) the number of stations for each year in the period from 1781 to 1792 and (b) the number of stations based on the length of available records. from local time to UTC was done assuming mean solar lo- ally ingested into the Global Land and Marine Observations cal time (i.e. the UTC offset is linearly proportional to lon- Database (GLAMOD). gitude). We discard the seasonal fluctuations related to the apparent local solar time (as measured by a sundial), as these 2.2.3 Exploring potential have a negligible effect on the daily means (see Camuffo et al., 2021). For pressure, the average of the available observa- Following the analysis of data availability and quality, we ex- tions for a given day was calculated, with no correction for plored the potential of the corrected SMP temperature and the diurnal cycle. Values that were flagged by the QC tests pressure series with respect to two historical cases of ex- are ignored in the computation. treme weather – namely, two devastating storms around the From the daily series, monthly averages were calculated new year 1783–1784 and the anomalously cold March of and concatenated to the monthly data in the Ephemerides. 1785. The SMP data were used in combination with ad- Months with more than 5 missing days were excluded. The ditional synoptic information from existing studies of pre- monthly “means” in the Ephemerides are arithmetic means industrial weather and climate. We used the CAP7 weather of all sub-daily measurements until around 1784, after which type reconstructions by Schwander et al. (2017), which ex- mid-range values between maxima and minima were used. It tend the MeteoSwiss CAP9 classifications back to the year would seem that editors in Mannheim could not keep up with 1763 (Weusthoff, 2011), a catalogue of recurrent dynamical the vast quantity of observations. Thus, published monthly weather patterns over central Europe (overall seven types) data after 1784 were not included in the final monthly series. that can provide important information on the state of the All the data are stored in the so-called “Station Exchange atmosphere during these years. Additionally, we used John Format” (SEF), a novel output for the transcription of cli- Kington’s hand-drawn synoptic maps (Kington, 1988), a mate data and metadata developed by the Copernicus Cli- unique source that allow insight into the daily progression mate Change Service (C3S) (Brönnimann et al., 2018). SEF and distribution of surface pressure features over Europe dur- files have a .tsv (tab-separated values) extension and follow ing these extreme events. Monthly reanalyses such as the a straightforward structure, listing basic metadata regarding EKF400v2 (Franke et al., 2017; Valler et al., 2021) can also the station and the series in a header. Each line of the data contextualise anomalies on broader timescales than those of table represents one observation time for which the follow- the SMP observations, which on average only cover the best ing information is specified: year, month, day, hour, minute, part of a decade. Finally, documentary sources are a vital period (time period of observations), value, and meta. This archive of weather information that provide important envi- last column contains any metadata that are of interest to the ronmental and socio-economic dimensions to natural disas- specific value, including flags that specify if the value has ters (Pfister et al., 2002). Taking all these materials together, failed any QC test. The common format is designed to allow these case studies serve to demonstrate the value of the SMP people rescuing instrumental measurements to present them data for weather and climate reconstruction. for widespread use in an uncomplicated format that is recog- nisable by software. The final aim is for such SEF files to be easily ingested into global repositories (Brunet et al., 2020). The historical series presented in this study will be eventu- Clim. Past, 17, 2361–2379, 2021 https://doi.org/10.5194/cp-17-2361-2021
D. Pappert et al.: Unlocking weather observations from the Societas Meteorologica Palatina                                      2369

3     Results

3.1    Data coverage

The inventory reveals important information regarding
the availability of meteorological observations in the
Ephemerides. The coverage and consistency of the SMP ob-
servations are more variegated than initially meets the eye;
some of these aspects are summarised in Fig. 3. Station par-
ticipation in the network fluctuated significantly over the
years (Fig. 3a). The years with most participants are 1783
and 1784, which is fortunate for climate research as these
years coincide with the Laki eruptions in Iceland, whereas
the final years are those with the fewest participating sta-        Figure 4. Bar chart showing the resolution for each data series
tions. Indeed, 1788 marks the last year when a number of sta-       marked by an “X” in the inventory. The different formatting of
tions sent data to the society, including dedicated stations that   the years 1787 and 1788 meant many records were printed as daily
had provided observations for many years up until then, such        means and monthly summaries instead of the usual sub-daily tables.
as Berlin, Copenhagen, Erfurt, Middelburg, and Würzburg
(see Table 1). A year later in 1789, Geneva and Tegernsee
also stopped sending data. The last Ephemerides volume, for         eter in English inches and eventually started reporting obser-
1792, appeared in 1795, and it contained data recorded at 14        vations in Paris inches, although it is unclear whether a SMP
persevering stations. Overall, more than half of the 37 sta-        barometer was used. St. Petersburg switched back and forth
tions in the network sent data to Mannheim for longer than          between Réaumur and Delisle thermometers. All these cases
7 years; 12 of these, mostly stationed in central Europe, had       show why inconsistencies could arise.
their data published in almost every Ephemerides issue. A              As the inventory shows, it is also often the case that ob-
total of 11 stations provided observations for 4 years or less      servations are only available for portions of the year or that
(Fig. 3b).                                                          measurements of some parameters are interrupted or miss-
   Lists such as the one in Table 1 or the one provided in          ing. In some cases, measurements are printed in the next edi-
Cassidy’s article (Cassidy, 1985) give a rough idea of which        tion of the Ephemerides as an additamentum, most likely due
location participated in which year; however, they do not           to the data not arriving in Mannheim in time to be organised,
distinguish between the type, resolution, or quantity of data       collated, and printed. For instance, Stockholm’s sub-daily ta-
recorded for each location. A station that contributed only         bles from 1788 to 1791 are published together in the addi-
sub-daily wind force observations in a specific year but sub-       tamentum of the Ephemerides published in 1793 (covering
mitted sub-daily measurements for every parameter in an-            1791 data).
other year has a different value to a researcher. While the sta-       One particular pattern that emerges in the inventory is
tion did participate in both years, the weight of the contribu-     a “thinning out” of measurements available for 1787 and
tion is different. Table 2 shows an extract from the inventory      1788. The data received from each location for these 2 years
to illustrate this point.                                           was not printed in extenso, as they had been in the other
   Although there is a clear overarching framework that             Ephemerides. Wind direction and force observations are sub-
guided the collection of observations for the SMP, there are        daily, but the rest of the data appear in the appendices as daily
a number of lacunae and inconsistencies. Sometimes mea-             or monthly means – one need only glance at Mannheim or
surements were not taken as instructed by the SMP. For ex-          Rome in the inventory to see this. Figure 4 illustrates this
ample, in the case of Żagań, measurements were not taken          pattern very clearly. After these diluted editions in the late
at regular intervals. In the case of St. Petersburg, tempera-       1780s, the old extensive publication style resumes until the
ture and pressure were even observed at different times. Fur-       last volume, containing data for 1792, although by this time
thermore, not all observers used the instruments provided           the size of the network is notably smaller.
by the society; for instance, the station in Cambridge, Mas-
sachusetts, used a Fahrenheit thermometer until 1784. In fact,      3.2   Data quality
the Russian stations seemed to follow a protocol of their own:
Moscow and St. Petersburg only provided pressure (likely            The most common type of error reported for sub-daily values
already reduced to a standard temperature), outdoor temper-         by the QC software was the wmo_time_consistency, which
ature, and wind observations. Moreover, there is clear evi-         flags observations that exceed the WMO-suggested toler-
dence that they switched instruments throughout the 12-year         ances for the temperature and pressure tendency as a function
period. Moscow used a Delisle scale thermometer until 1787,         of time. The Munich sub-daily temperature series, covering
then began reporting in Réaumur units; it also used a barom-        1781–1786, 1788, and 1790–1792, had as many as 82 of its

https://doi.org/10.5194/cp-17-2361-2021                                                         Clim. Past, 17, 2361–2379, 2021
2370                             D. Pappert et al.: Unlocking weather observations from the Societas Meteorologica Palatina

Table 2. Extract from the inventory for the station in Budapest for the years 1786–1788, showing how distinguishing between available
parameter observations is both useful and informative.

                         Budapest                        1786       1787                   1788
                         Barometer                        X                                  X
                         Thermometer (indoor)             X
                         Thermometer (outdoor)            X                                  X
                         Hygrometer                       X                                  X
                         Declinometer                     X                                  X
                         Wind direction and force         X          X                       X
                         Rainfall                         X                                  X
                         Evaporation
                         River height                     X                                  X
                         Resolution                  Sub-daily   Sub-daily                   Daily
                                                                                       (wind: sub-daily;
                                                                             rainfall and river height: monthly)

observations flagged with this error, most of them in the last        grometer measurements resembling a plausible range of tem-
3 years of observation. This hints at the possibility that the        perature values.
thermometer was partially exposed to sunlight for some peri-             On the lower end of the quality “spectrum” of the re-
ods at a time and did not actually measure air shade tempera-         covered series is the Moscow pressure series (Fig. 6). The
ture. This led to several afternoon observations being overes-        availability of data is patchy to begin with: observations
timated, thereby creating unrealistic jumps in the measured           started being taken in 1783 until 1792, except for 1790;
temperature diurnal cycle.                                            1783–1784 and 1787 are available in the form of monthly
   On the whole, however, the wmo_time_consistency flags              summaries; and the rest are in sub-daily form. About 13 %
in a given series are relatively few. Some of these errors may        of the total available sub-daily values were flagged as sub-
have been due to misprints in the publications, or they were          daily_repetitions, i.e. occurrences of equal consecutive val-
probably misread by compilers in Mannheim. Figure 5 illus-            ues. This hints at the poor quality of the barometer that
trates this example with Żagań pressure readings. The high-         was being used. For the Moscow station, 1785 marks both
lighted barometer lines are erroneous and not in line with            a change in observer, from Heinrich Gottlieb Engel to Jo-
the expected pressure tendency for a 6 or 7.5 h time interval.        hann Gotthilf Stritter, and a change from noting observations
One could hypothesise that the first value “0.2” was meant as         in English to Paris inches. It is unclear whether there was a
“10.2”, but the real measured value cannot be known and so            change in instrument: it may not have been a SMP barom-
should ideally be left as a flagged value. That said, the cor-        eter, as lines were still being reported in 1/100 instead of
rection of a suspected printing error is at the discretion of the     1/12; alternatively, it could be that readings from the old En-
researcher and, whenever applied, a note should be made in            glish barometer were simply being converted to Paris inches
the digitised table.                                                  in the editing process. Furthermore, as can be seen in the time
   A number of winter values in the temperature series were           series, the pressure series likely needs to be homogenised,
flagged as subdaily_out_of_range for exceeding the default            a task which could not be carried out, given the paucity of
threshold (−30 ◦ C) of the QC function. These were mostly             nearby reference series.
ignored as they seemed reasonable given the internal vari-               Overall, the correlations in the Craddock test showed good
ability of temperature during the 1780s. Indeed, for extreme          agreement for both variables between stations in central Eu-
meteorological conditions, it could be that values are flagged        rope, meaning that for most candidate series there was a suf-
as suspect, although they are correct (WMO, 1993).                    ficient number of reference series. The SMP temperature se-
   A closer look at the Brussels temperature series revealed          ries did not manifest any significant break points, although
suspicious values in December 1788. It would seem that                the Craddock test allowed for the detection of other system-
daily hygrometer observations for this month were mis-                atic quality problems: series such as Rome and Regensburg
takenly copied into the temperature column (Ephemerides,              showed evidence of an annual cycle in the test, indicating
1795, 1790, pars posterior, pp. 38–39). The error became              that the thermometers may have been measuring indoor or
apparent when comparing temperature values with those of              at least in conditions of poor exposure; additionally, the An-
Middelburg, located just over 100 km from Brussels. The QC            dechs series seems to overestimate temperature after spring
software did not recognise this inconsistency due to the hy-          1791. A number of break points were detected in the pressure
                                                                      series, although, as a criteria, only those with a mean differ-

Clim. Past, 17, 2361–2379, 2021                                                           https://doi.org/10.5194/cp-17-2361-2021
D. Pappert et al.: Unlocking weather observations from the Societas Meteorologica Palatina 2371
Figure 6. Station pressure series of Moscow for the period from
1783 to 1792. Shown are sub-daily values in hectopascals (blue) and
shade areas that represent the availability of monthly data (yellow)
or no available data (grey).
– in terms of destructive winds – occurred in the British Isles,
the severe flooding that ensued in parts of mainland Europe
during this season have been well documented (Demarée,
2006; Brázdil et al., 2010). There was considerable material
damage in wide regions north of the Alps that exacerbated
the already harsh socio-economic conditions caused by the
severe winter.
The storms occurred following a long spell of extreme
weather. Europe had been experiencing bitter cold temper-
atures, the result of persistent high-pressure systems (type 5)
that had lingered over central Europe from 26 November
to 16 December, which were then followed by successive
northerly and easterly winds (types 1, 4, and 6). All of this
was acting to prevent milder temperatures from the Atlantic
Ocean moving eastwards over the continent. With the storm
around Christmas and again in the first days of the new year
Figure 5. Barometer readings at Żagań for 1–17 July 1781 came an upswing in temperatures: the daily mean temper-
(Ephemerides, 1795, 1783, pp. 373–374). The columns represent ature in Brussels, for instance, changed from −12.5 ◦ C on
the days, observations times, and Paris inches and lines. The high-
31 December to 4.6 and 2.1 ◦ C in the following 2 days. With
lighted values are likely printing errors and are flagged in the SEF
these milder temperatures came heavy rainfall and snowmelt,
file as wmo_time_consistency errors.
which caused the first floods. This was the case for the
Dijle and Demer catchments of the Scheldt Basin in Bel-
ence between before and after the break point(s) greater than gium. The Gete River also flooded at Orp-le-Grand on 2 Jan-
1 hPa were adjusted. Constant corrections were applied to the uary and at Tienen on 4 January 1784 (Demarée, 2006). In
following SMP pressure series: Andechs, Bologna, Brussels, Mannheim, Hemmer noted how the rivers “swelled greatly”,
Erfurt, Gotthard, Hohenpeissenberg, Prague, and Rome (see the thick ice that had constrained the Neckar tributary of the
Table 3). Rhine rose and broke, and the river flooded at Feudenheim
around 18:00 LT, inundating the bridge and breaking parts of
it off, which flowed all the way downtown towards the station
3.3 Case studies (Ephemerides, 1795, 1786, p. 53).
3.3.1 Storms during the winter 1783–1784 Not surprisingly, the SMP data fit very well with Kington’s
daily sea level pressure (SLP) fields. Figure 7 shows SMP
Around 24–26 December and the first days of January 1784 pressure data reduced to sea level (using Eq. 6) plotted onto
two violent storms hit Europe from the northwest (see Lamb, Kington’s maps. By 24 December, a depression had arrived
2005, pp. 87–88). While the greatest impacts from the storms from the northwest and soon developed an intense centre that
https://doi.org/10.5194/cp-17-2361-2021 Clim. Past, 17, 2361–2379, 20212372 D. Pappert et al.: Unlocking weather observations from the Societas Meteorologica Palatina
Table 3. Station pressure series for which break points were detected, showing the location in the series where the break point is, the extent
of the correction, and where in the series this was applied.
Series Break point(s) Correction (hPa) Application
Jun 1782 −1.2 1 Jan 1781–30 Jun 1782
Andechs
Mar 1787 +2.4 1 Jul 1786–31 Mar 1787
Aug 1783 +8.6 14 Jan 1782–23 Aug 1783
Bologna
Dec 1784 +3.9 16 Jan 1784–31 Dec 1784
Jul 1782 +3 1 Jan 1782–31 Jul 1782
Brussels
Dec 1783 −2.5 1 Dec 1783–31 Dec 1785
Dec 1782 +3.2 1 Jan 1781–31 Dec 1782
Erfurt
Jan 1788 +2.4 1 Jan 1788–31 Dec 1788
Gotthard Mar 1782 +5.9 1 Jun 1781–31 Mar 1782
Hohenpeissenberg Dec 1788 +2.7 1 Jan 1788–31 Dec 1788
Prague Jul 1784 +4.3 1 Aug 1781–31 Jul 1784
Dec 1783 +6 1 Jan 1782–31 Dec 1783
Rome
Oct 1788 +3.8 1 Oct 1788–31 Dec 1792
Figure 7. Kington’s hand-drawn synoptic maps showing the storms as they moved over Europe covering the days from 23 to 26 Decem-
ber 1783 and from 2 to 3 January 1784. Isobars are drawn at 4 hPa intervals, and “12” denotes the 1012 hPa isobar; dashed lines indicate
fronts. Coloured points represent SMP pressure observations in hectopascals reduced to sea level from 17 selected stations. The figure is
adapted from Kington (1988, pp. 99–100) and reproduced with permission from Cambridge University Press through PLSclear.
had moved over the English Channel within days. As the low over Scandinavia, creating a strong pressure gradient over
expanded, all sites recorded a drop in pressure, with Middel- the North Sea that blew gusts of Arctic air over Denmark,
burg and Mannheim at 984 and 986.2 hPa respectively. On Germany, and the Low Countries. According to SMP mea-
2–3 January, another frontal system arrived in from the At- surements, the tight gradient ranged from 1000.2 hPa in La
lantic, pushing against a large high-pressure system centred Rochelle to 1037.2 hPa in Spydeberg on 2 January.
Clim. Past, 17, 2361–2379, 2021 https://doi.org/10.5194/cp-17-2361-2021D. Pappert et al.: Unlocking weather observations from the Societas Meteorologica Palatina 2373
Table 4. Monthly anomalies for March 1785 at four stations in cen-
tral Europe: Mannheim, Padua, Budapest, and Żagań. The first col-
umn is calculated with respect to monthly climatologies from the
SMP instrumental measurements, whereas the other three columns
are calculated with respect to the climatologies of the EKF400v2
reanalysis grid boxes closest to the location of the four stations.
Anomalies [◦ C]
Stations 1781–1792 1781–1792 1751–1800 1951–2000
SMP EKF400v2 EKF400v2 EKF400v2
Mannheim −4.8 −5.3 −6 −6.5
Padua −5.1 −4.4 −5.2 −4.7
Budapest −5.6∗ −3.6∗ −3.6 −4.1
Żagań −6.7 −6 −6.5 −6.8
∗ Anomalies computed excluding 1781 and 1787.
Figure 8. Daily mean temperature from February to April 1785
at six SMP locations: Mannheim, Padua, Budapest, Żagań, Prague,
and Regensburg. The bottom bar indicates the CAP7 weather type
classifications by Schwander et al. (2017).
3.3.2 The coldest March: 1785
In central Europe, March 1785 may well have been the cold- ries have very good agreement, displaying mutual correla-
est March in over 300 years. According to the EKF400v2 re- tions between 0.78 and 0.91. Two features are immediately
analysis (Franke et al., 2017; Valler et al., 2021), this was apparent. The first is the severe cold snap from 27 Febru-
the coldest March since 1701 for the regions surrounding ary to 2 March, with Żagań and Prague reaching tempera-
Mannheim and Padua, the second coldest for the region in tures below −20 ◦ C. This was likely due to the strong north-
and around Żagań, and it remains in the top 10 coldest east winds – type 1 weather type according to Schwander
for Budapest. Table 4 shows the extent of these anomalies: et al. (2017) – bringing freezing continental air into central
for Żagań, March 1785 was over 6 ◦ C colder than the av- Europe and was soon reversed by milder west–south-west
erage during the period of the SMP’s activity, and it was winds (type 2). The second feature is the cold March itself,
around 5 ◦ C colder for both Mannheim and Padua. There is manifesting for many locations as persistent below-zero con-
reasonable agreement between the SMP monthly tempera- ditions for almost the entire month. Looking at the weather
ture anomalies and those of the EKF400v2, with a differ- types, the main cause seems to have been successive days
ence < 0.7 ◦ C for all stations, except for Budapest where of type 4 (east, indifferent), type 1 (northeast, indifferent),
the anomaly is 2 ◦ C colder for the observations than in the type 5 (high pressure), and type 6 (north), hinting at the con-
reanalysis. These differences are partly due to the spatially stant flow of cold air into the region.
coarser resolution of the reanalysis compared with the local Both the Palatina series and the weather types nicely com-
measurements of the SMP station data. plement Kington’s daily synoptic maps. The maps show
In Switzerland, Lake Lucerne had frozen over in Lucerne blocking over northwestern Europe until 7 March with a cen-
Bay as had Lake Geneva at the Geneva end (Pfister, 1999, tre over the North Sea and Scotland (see Fig. 9). This is inter-
p. 121). The SMP observer stationed in Geneva, Jean Sene- rupted by a large cold front moving into France on 8 March,
bier, had been observing sub-zero temperatures for days and which coincides with a slight warming in the SMP series and
described how the lake had frozen over by the mouth of type 2 weather. Over the next weeks, blocking resumes, this
the Rhône by 2 March (Ephemerides, 1795, 1787, p. 215). time mainly between Great Britain and Iceland (occasionally
The future second president of the USA, John Adams, work- over Ireland), providing a constant flow of northerly Arctic
ing as first Minister to the Netherlands and living near Paris air into central Europe.
at the time, wrote about his conversation with a local ab-
bot, recording “that neither he nor his brother, (and they 4 Discussion
are both turned of seventy) remember ever to have experi-
enced so cold weather in the beginning of March” (Adams, The inventory makes it clear that not every station belonging
1785/1981). to the network made measurements for the whole period, nor
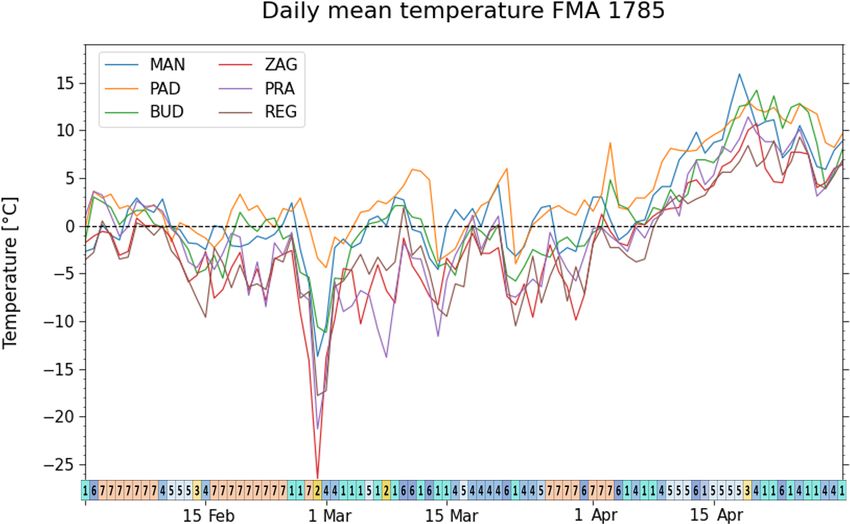
SMP data allow us to track the daily development of tem- did they always record the observations in a consistent man-
perature throughout these weeks. Shown in Fig. 8 are mean ner at a sub-daily resolution, at the specific hours instructed
daily temperature series for selected locations, along with the by the SMP. Exploring the sources and existing literature on
highest probability daily weather types. We present only six SMP stations can shed light on some of the reasons for this
series for visual clarity, and the chosen stations are meant heterogeneity.
to be representative of a central area in Europe. The se-
https://doi.org/10.5194/cp-17-2361-2021 Clim. Past, 17, 2361–2379, 2021You can also read