USB VIDEO FEAR CONDITIONING - SOF-843 VIDEO FREEZE USER'S MANUAL - Med Associates
←
→
Page content transcription
If your browser does not render page correctly, please read the page content below
Instrumentation and software for research

USB VIDEO FEAR CONDITIONING
SOF-843 VIDEO FREEZE®
USER’S MANUAL

DOC-321
Rev 1.1

Copyright © 2019
All Rights Reserved

Med Associates Inc.
P.O. Box 319
St. Albans, Vermont 05478

Phone: 802.527.2343
Fax: 802.527.5095
www.med-associates.com

V IDEO F REEZE IS A REGISTERED TRADEMARK OF MED ASSOCIATES , I NC .

                                                    -i-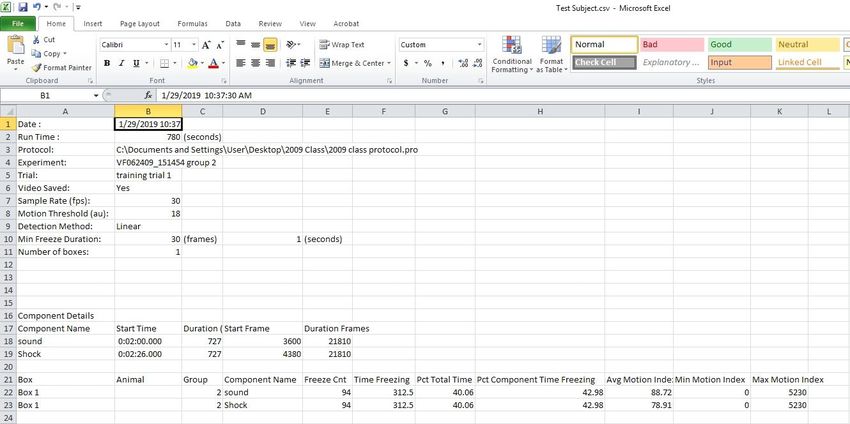
notes

- ii -
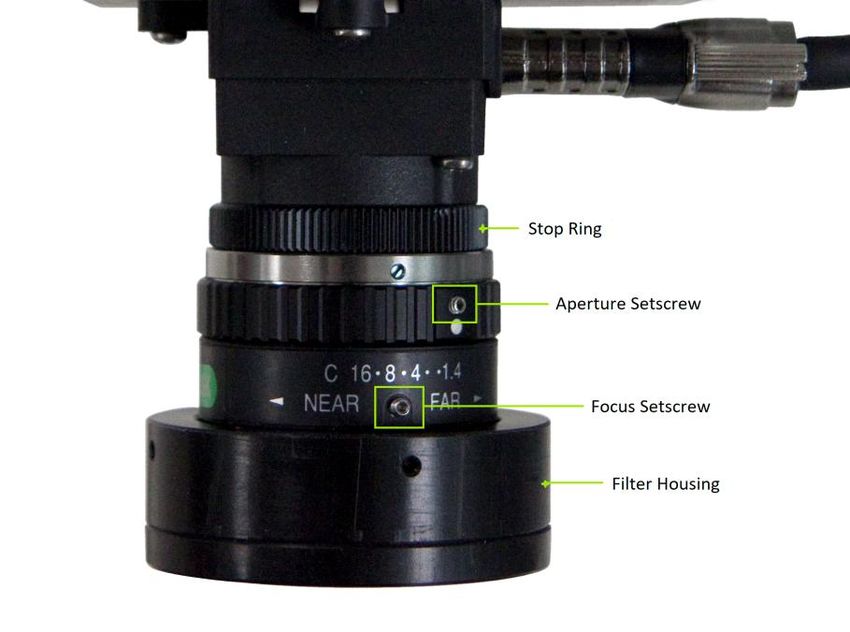
Table of Contents
Chapter 1 |Introduction ................................................................................... 1
Chapter 2 | Hardware Guide ............................................................................ 2
     Cable Guide ........................................................................................................................ 8

Chapter 3 | Wiring Guide ............................................................................... 10
     Quick Reference ............................................................................................................... 10
     Step-by-Step Instructions ................................................................................................ 11
     Step-by-Step Instructions ................................................................................................ 11
     Configuring the Software ................................................................................................. 18

Chapter 4 | Camera Calibration .................................................................... 22
     Calibration Procedure ....................................................................................................... 22
     Adjusting Camera Focus .................................................................................................. 24

Chapter 5 | Protocol Setup ............................................................................ 26
     Independent Variables ..................................................................................................... 26
     Dependent Variables ........................................................................................................ 26
     Protocol Setup Utility ....................................................................................................... 26
     Defining the Stimulus Conditions .................................................................................... 26
     Saving a Protocol ............................................................................................................. 29
     Modifying an Existing Protocol ........................................................................................ 29

Chapter 6 | Starting an Experimental Session ............................................ 30
     Experimental Setup .......................................................................................................... 31
     Threshold Values .............................................................................................................. 32

Chapter 7 | Methods of Observation ............................................................ 33
     Linear Method (Default)................................................................................................... 33
     Discrete Method ............................................................................................................... 34

Chapter 8 | Video Capturing System Calibration ........................................ 36
Chapter 9 | Recording the Session ............................................................... 37
Chapter 10 | Data Analysis ............................................................................ 38
     Types of Data Files .......................................................................................................... 38
     Analyzing “*.raw” data in Video Freeze® ...................................................................... 39
     Exporting Data to a Spreadsheet .................................................................................... 41
     Exporting Video ................................................................................................................ 42

Chapter 11 | Component Analysis ................................................................ 43
     Component Summary Report........................................................................................... 43

                                                                 - iii -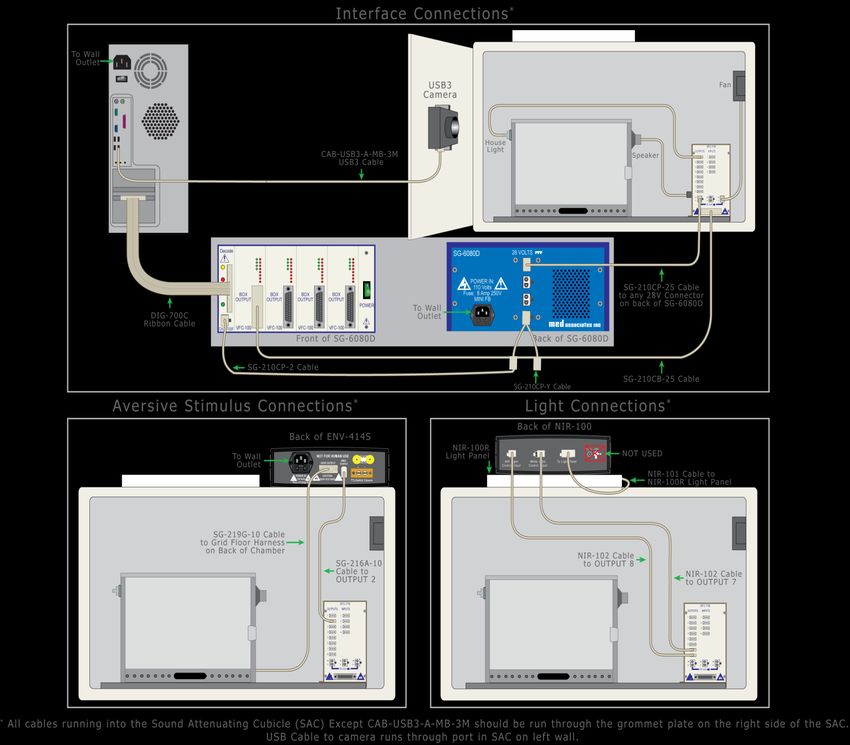
Batch Component Summary Report ................................................................................ 45

Appendix A | Driver and Software Installation ........................................... 47
Appendix B | Door Hinge Adjustment .......................................................... 48
Appendix C | Camera Filter Care and Handling........................................... 50
Appendix D | Installing Contextual Inserts ................................................ 51
    A-Frame Insert ................................................................................................................. 51
    Smooth Floor Insert ......................................................................................................... 51
    Curved Wall Insert ........................................................................................................... 52

Appendix E | USB TopolOGY .......................................................................... 53
    Recommended Configurations ......................................................................................... 53

                                                               - iv -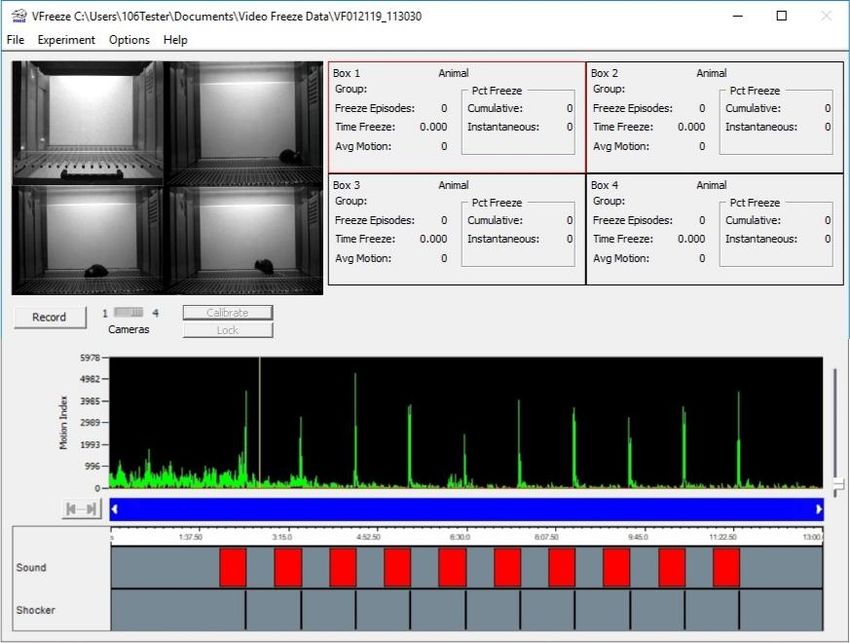
CHAPTER 1 |INTRODUCTION
The USB Video Fear Conditioning System (VFC) and the Video Freeze® Software system
allows the researcher to easily construct customized experimental protocols and obtain
a quantitative measurement of conditioned immobility, or “freezing.” Video Freeze®
Software is an important advancement in behavioral testing technology because it
provides a reliable, automated means of monitoring the effects of fear conditioning in
rodent species.
The “Protocol Setup” section in this manual (see Chapter 6) outlines the steps involved
in designing the stimulus conditions for the experiment, an d the section titled “Starting
an Experimental Session” describes the options pertaining to dependent measures.
The VFC system is entirely automated and records video on a PC hard drive . Digital
video cameras are used to simultaneously capture data from up to four fear-
conditioning chambers (mice or rats). The Video Freeze® run-time display provides
information on current CS-US (Conditioned Stimulus-Unconditioned Stimulus) durations
and inter-trial intervals, as well as displaying the video input while a session is being
conducted.
All data is stored to the hard drive, and can be analyzed using the Video Freeze ® Data-
Analysis Utility (refer to Chapter 11 “Analyzing “*.raw” Data in Video Freeze®”). Use this
data-analysis utility to simultaneously view the video and quantitative results. The data-
analysis user interface allows researchers to focus on specific intervals within any given
trial for detailed examination of the results.
Med Associates is dedicated to providing the scientific community with reli able and
innovative behavioral-testing tools. Please contact technical support at support@med-
associates.com with questions regarding the USB Video Fear Conditioning System.

                                            1
                                                                DOC-321 Rev 1.1 Copyright© 2019
                                                                            MED Associates, Inc.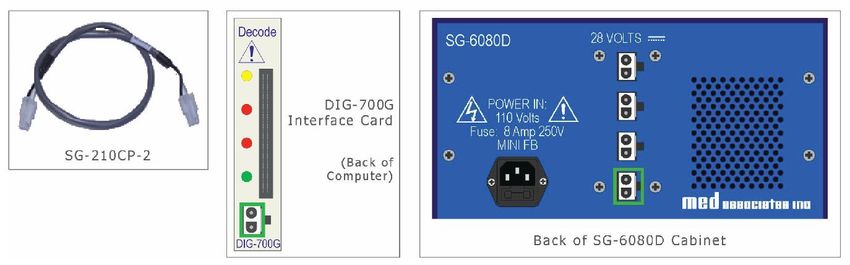
CHAPTER 2 | HARDWARE GUIDE

  Figure 2-1 – NIR-022SD Sound-Attenuating Cubicle with VFC-008 Fear Conditioning Chamber, VID-
  CAM-MONO-5 USB Video Camera, ENV414S Aversive Stimulator, and NIR-100 Light Controller

  Figure 2-2 – VFC-008 Fear Conditioning Chamber with VFC-716 SmartCtrl Panel

                                               2
                                                                    DOC-321 Rev 1.1 Copyright© 2019
                                                                                MED Associates, Inc.
Figure 2-3 - VFC-716 SmartCtrl Panel Default Connections

Figure 2-4 - SG-6080D Cabinet with DIG-700G Decode Card and VFC-100 Modules

                                              3
                                                                 DOC-321 Rev 1.1 Copyright© 2019
                                                                             MED Associates, Inc.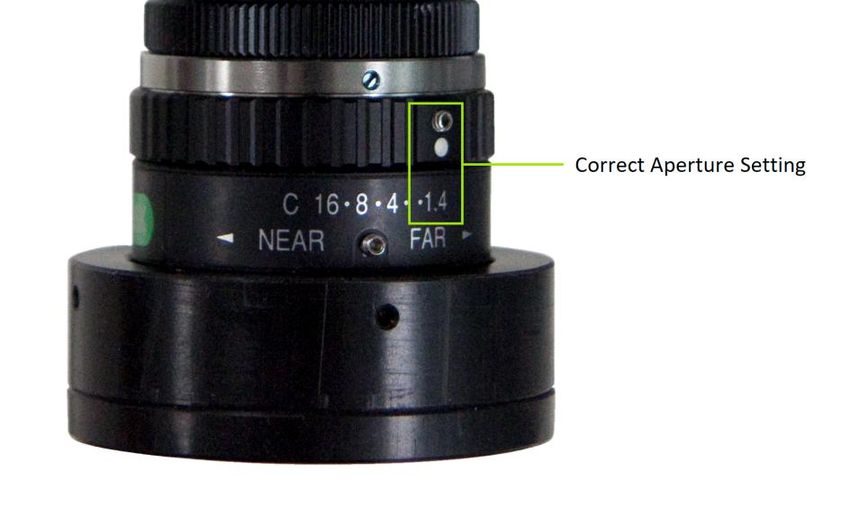
Figure 2-5 - DIG-704PCI-2 Interface Card (Installed in Computer)

Figure 2-6 - ENV-414S Stand-Alone Aversive Stimulator/Scrambler

                                               4
                                                                   DOC-321 Rev 1.1 Copyright© 2019
                                                                               MED Associates, Inc.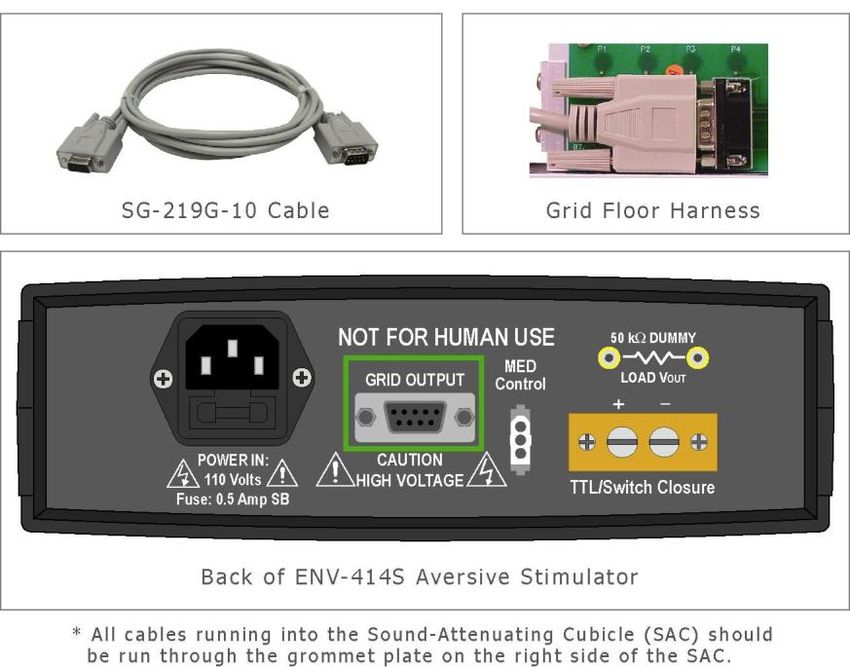
Figure 2-7 - ENV-005-QD Quick Disconnect Harness (US Pat. No. 6412441 B1, Canadian Pat. No.
2,368,344, UK Pat. No. 1226750, Australian Patent 772111, France 1,226,750, Germany 602 05
143.6, Italy 1,226,750, the Netherlands 1,226,750, European Pat. No. 1226750, Other Foreign
Patents Pending)

Figure 2-8 - VID-CAM-MONO-5 USB 3.0 Monochrome Video Camera

                                            5
                                                                 DOC-321 Rev 1.1 Copyright© 2019
                                                                             MED Associates, Inc.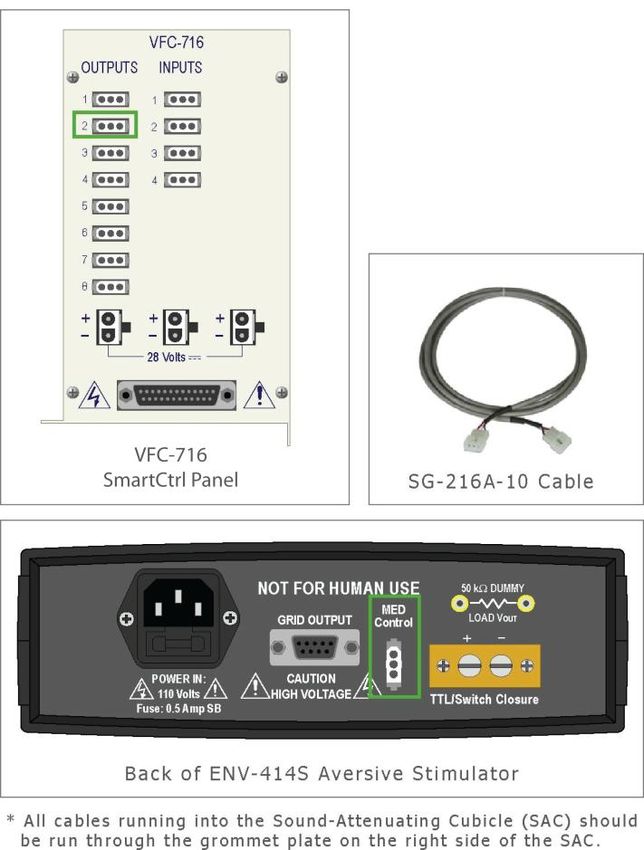
Figure 2-9 - NIR-100 Light Controller Front Panel and Rear Panel

Figure 2-10 - NIR-100R Light Panel (Mounted on top of the Cubicle)

                                               6
                                                                     DOC-321 Rev 1.1 Copyright© 2019
                                                                                 MED Associates, Inc.
Table 2.1 – Hardware Guide
Part Number Description Quantity Location
VFC-022MD Sound-Attenuating Cubicle (SAC) Up to 4 per Computer Houses Chamber
VFC-008 Conditioning Chamber One per SAC Inside the Cubicle
SG-6080D Interface Cabinet with 28 VDC One for every four Chambers Outside the Cubicle
DIG-700G Interface Decode Card One per Interface Cabinet SG-6080D Interface Cabinet
VFC-100 Stimulus Output Cards One per Chamber SG-6080D Interface Cabinet
DIG-704PCI-2 PCI Interface Card One for every four Chambers Computer
ENV-414S Aversive Stimulator One per Chamber Outside the Cubicle
ENV-005-QD Quick Disconnect Harness One per Chamber Back of Chamber
VFC-716 SmartCtrl Panel One per Chamber Inside the Cubicle
ENV-229M Stimulus Light with Diffuser One per Chamber Inside the Chamber
VID-CAM-MONO-5 USB3 Video Camera One per Chamber Left Cubicle Door
NIR-100 Light Controller One per Chamber Outside the Cubicle
NIR-100R Light Panel One per Chamber On top of the Cubicle
ENV-025F Fan One per Chamber Inside the Cubicle
7
DOC-321 Rev 1.1 Copyright© 2019
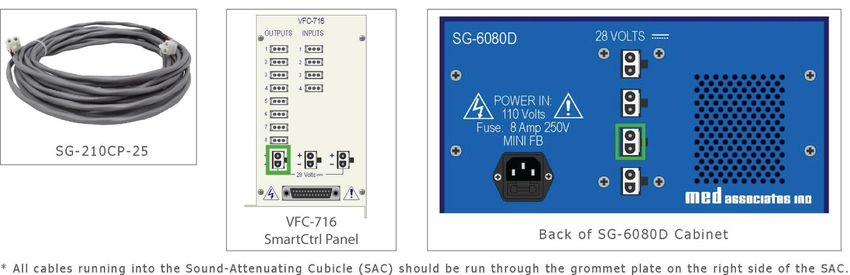
MED Associates, Inc.Cable G uide
Figure 2-11 – DIG-700C Ribbon Cable
Figure 2-12 - SG-210CP 2-Pin Molex Cable
Figure 2-13 - SG-210CB-25 Serial Port Cable
Figure 2-14 - SG-210G-10 DB-9 Cable
Figure 2-15 - SG-216A-10 3-Pin Molex Cable
8
DOC-321 Rev 1.1 Copyright© 2019
MED Associates, Inc.Figure 2-16 - CAB-USB3-A-MB-3M Cable
Figure 2-17 - NIR-101 Light Control Input Cable
Figure 2-18 - NIR-102 Light Control Interface Cable
Figure 2.20 – SG-210CP-Y 2-Pin Molex Y Cable
9
DOC-321 Rev 1.1 Copyright© 2019
MED Associates, Inc.CHAPTER 3 | WIRING GUIDE
Prior to making any connections, be sure that all equipment is turned off . Failure to do
so may result in equipment damage.
Quick Reference
10
DOC-321 Rev 1.1 Copyright© 2019
MED Associates, Inc.Step-by-Step Instructions
1. Using the DIG-700C Ribbon Cable, connect the DIG-700G Interface Decode Card
located in the SG-6080D cabinet, to the DIG-704PCI-2 card located on the back of
the computer.
NOTE: Press cable connector firmly and evenly into DIG-704 until locking tabs engage, a
strong tight connection is also required at the DIG-700G end
2. Using an SG210-CP-2 2-pin Molex cable, connect the 28V port on the DIG-700G
Interface Decode Card located in the SG-6080D cabinet, to any available 28V port on
the rear of the SG-6080D cabinet.
11
DOC-321 Rev 1.1 Copyright© 2019
MED Associates, Inc.3. Using an SG-210-CB-25 25’ serial port cable, connect each VFC-100 stimulus
output card located in the SG-6080D cabinet to the corresponding VFC-716
SmartCtrl Panel. For example, if there are multiple chambers, the VFC-100 card
labeled “1” should be connected to the VFC-716 in Chamber 1, and so on.
4. Using the SG-219G-10 DB-9 cable, connect the Grid Output connector on the
back of the ENV-414S Aversive Stimulator to the ENV-005-QD grid floor on the
rear of the VFC-008 Conditioning Chamber (inside the Sound-Attenuating
Cubicle).
5. Using an SG-216A-10 3-pin Molex cable, connect the MED Control connection on
the back of the ENV-414S Aversive Stimulator to the OUTPUT 2 connection on
the VFC-716 SmartCtrl Panel.
12
DOC-321 Rev 1.1 Copyright© 2019
MED Associates, Inc.6. Connect the ENV-229M Stimulus Light with Diffuser (on the left side of the
Conditioning Chamber) to the OUTPUT 1 connection on the VFC-716 SmartCtrl
Panel.
13
DOC-321 Rev 1.1 Copyright© 2019
MED Associates, Inc.7. Connect the speaker to the input on the side of the VFC-716 SmartCtrl Panel.
8. Connect the fan inside the Sound-Attenuating Cubicle to one of the three 28V
connections on the VFC-716 SmartCtrl Panel.
14
DOC-321 Rev 1.1 Copyright© 2019
MED Associates, Inc.9. Using an SG-210CP-25 2-pin Molex cable, connect any available 28V connector on
the VFC-716 SmartCtrl Panel in each Chamber to a 28V connector on the rear of
the SG-6080D cabinet, using the SG-210PC-Y cable to connect a forth chamber if
needed for a 4 th chamber. See chapter 3 Interface connections.
10. Using the USB cables (CAB-USB3-A-MB-3M), connect the USB3 Cameras to the
USB3 ports on the back of the computer, indicated by blue internal tabs (instead
of black for USB 2.0 which is not compatible). The screw-in locking connectors
on the USB cables should be used where available, and sharp bends in the
routing of the USB cable should be avoided. If additional length in USB3 cable is
needed to reach the Computer, an optional USB3 hub (USB-VID-HUB-USB3) can
be used. Additional information relating to routing of the USB camera cables and
recommended configuration of the SAC can be found in “Appendix E | USB Topology ”.
15
DOC-321 Rev 1.1 Copyright© 2019
MED Associates, Inc.11. Using a NIR-102 cable, connect the White Light Control Input on the rear of the
NIR-100 Light Controller to the OUTPUT 7 connector on the VFC-716.
12. Using another NIR-102 cable, connect the NIR Light Control Input on the rear of
the NIR-100 Light Controller to the OUTPUT 8 connector on the VFC-716.
13. Using the NIR-101 cable, connect the To Light Panel connector on the rear of the
NIR-100 Light Controller to the only connector on the NIR-100R Light Panel.
16
DOC-321 Rev 1.1 Copyright© 2019
MED Associates, Inc.14. Using the included power cord, plug the SG-6080D cabinet into a standard wall
outlet.
15. Using the included power cord, plug the ENV-414S Aversive Stimulator into a
standard wall outlet.
NOTE: It is not necessary to apply power to the NIR-100 Light Controller via the +15 to
+28V DC connector (for standalone use only). Power is supplied via the Light
Control Input connectors.
17
DOC-321 Rev 1.1 Copyright© 2019
MED Associates, Inc.Config uring the Software
Once the hardware and drivers are correctly installed, configure the software following
the steps below.
Launch the video Freeze software by double clicking the desktop icon.
From the File menu, select Stimuli Definition. The following will appear:
Figure 3.1 - Stimulus Names
The Stimulus Names screen (Figure 3.1) is shown with the default titles. The Name
column is the only column that may be changed; the Id and Type columns may not be
changed. To change the Name of a stimulus, click on the current name and enter the
new name. When all the names are correct, select Ok.
18
DOC-321 Rev 1.1 Copyright© 2019
MED Associates, Inc.Now select File | Camera Identities. The following screen will appear:
Figure 3.2 - Camera Setup
If a camera is missing from this list, recheck the USB cable connection from the camera
to the USB3 port on the PC.
The Camera Setup screen is used to name the cameras and identify which camera is in
which chamber. The camera name can be changed by clicking on the current camera
name on the left side of the screen and entering a new name. The image on the right
side of the screen corresponds to the selected camera. When the camera names have
been updated, select Exit.
Select File | Chamber Configuration. The following screen will appear:
Figure 3.3 - Configuration Manager
The first time the Video Freeze software is run, the chambers may need to be added by clicking
the ADD button, this step is performed as part of the system configuration by Med Associates,
but after software re-install the chambers must be added.
The Camera Ids display order on the Configuration Manager screen can be changed by
left-clicking on the camera to move, then clicking on the up or down arrow on the right
side of the display (Figure 3.3). Camera Ids may be removed from this list by selecting
them and selecting Delete. To add a new configuration to the list, click Add. The screen
shown in Figure 3.4 will appear. To exit this screen, click Close.
19
DOC-321 Rev 1.1 Copyright© 2019
MED Associates, Inc.Figure 3.4 – Adding a new Configuration
If chambers are added to a system, for example
expanding from a 2 chamber system to a 4
chamber system, new configurations must be
added via the configuration manager dialog add
button .
Create a new configuration by entering the
desired box name into the Box Name field. Box
Name refers to an individual experimental setup,
and includes the Sound Attenuating Cubicle
(SAC), video camera, conditioning chamber, and
all stimuli associated with that chamber. The
hardware settings, including Camera and Box
Number (port, offset and bit) must be set for
each Box in the system.
Next, select a camera from the Camera pull down menu. Then select a box from the Box
Number pull down menu. Once all of the desired selections have been made, select Ok.
The screen shown in Figure 3.3 will appear again.
Select the camera to calibrate from the Configuration Manager screen (Figure 3.3) by
either double clicking on the Id of the desired camera, or by highlighting the desired
camera and clicking Edit. The screen shown in Figure 3.5 - Configuration setup
will appear. Click Calibrate Camera (refer to Chapter 5).
20
DOC-321 Rev 1.1 Copyright© 2019
MED Associates, Inc.Figure 3.5 - Configuration setup
Choose a camera from the Camera pull-down menu and select a box from the Box
Number pull down menu. The Box Number refers to the hardware address of the VFC-
100 card. Determine which Box that each VFC-100 is connected to and refer Table 3.1
below to determine the appropriate Box Number for the default configurations.
Choose the Box Number, and click OK.
Table 3.1 – Default Stimulus Configuration Settings
Box 1 Box 2 Box 3 Box 4
Audio
Port 790 790 790 790
Offset 1 2 3 4
Bit 0 0 0 0
DIG-704 I/O
General
Port 792 792 792 792
Offset 0 2 4 6
Stimulus Light
Bit 1 1 1 1
Shocker
Bit 2 2 2 2
21
DOC-321 Rev 1.1 Copyright© 2019
MED Associates, Inc.CHAPTER 4 | CAMERA CALIBRATION
Calibration Procedure
Figure 4.1 – VID-CAM-MONO-5
Ensure that the Chamber is pushed all the way to the back of the Cubicle and the NIR
light source is turned on in each box. The cameras in the MED-VFC system detect only
NIR light; therefore there will be no image on the screen if the NIR light source is off.
22
DOC-321 Rev 1.1 Copyright© 2019
MED Associates, Inc.Figure 4.2 - Calibrate Camera
Default values are set for Brightness (0) Gain (0) and Shutter (10,000). The image will
initially be viewable and may need to be fine-tuned.
MED Associates recommends an Average Intensity of approximately 130, this should be
achieved by adjusting the Brightness and Shutter first and finally by increasing Gain (see
Figure 4.2). For examples of poor calibration see Figure 4.4.
NOTE: The Brightness, Gain and Shutter may need adjustment and Average Intensity
may need to be increased if a Contextual Insert is used. Adjust with a
Contextual Insert in the chamber until a satisfactory image is attained.
23
DOC-321 Rev 1.1 Copyright© 2019
MED Associates, Inc.Figure 4.3 – Average Intensity of Properly Calibrated Camera
The Video Display window should now show a clear, bright image of the empty Fear
Conditioning Chamber. If the image is unclear the focus on the lens may need to be
adjusted.
Figure 4.4 – Examples of Poorly Calibrated Cameras
Adjusting Camera Foc us
MED Associates adjusts the focus and aperture settings on the camera prior to shipping
Video Fear Conditioning systems. However, if focus adjustments are made, the camera
settings (Brightness, Gain, and Shutter) will need to be adjusted using procedure below.
To adjust the camera focus, use the included .035” hex key to loosen the Focus
Setscrew, shown in Figure 4.5 . Rotate the Filter Housing until proper image clarity is
achieved then tighten the Focus Setscrew.
24
DOC-321 Rev 1.1 Copyright© 2019
MED Associates, Inc.The lens aperture should be locked in the fully open position (using the setscrew on the
aperture ring; Figure 4.5 ). The white dot on the aperture ring should be lined up with
setting 1.4 on the Filter Housing ( Figure 4.6 ).
NOTE: The camera lens has adjustments for aperture and focus, both settings have
been optimized by Med Associates during system building and subsequently
locked via the set screws on the lens
Figure 4.5 - Focus and Aperture Rings on Video Lens
Figure 4.6 - Aperture Setting
25
DOC-321 Rev 1.1 Copyright© 2019
MED Associates, Inc.Chapter 5 | Protocol Setup
Independent Variables
The Video Freeze® Software allows researchers to define stimulus intensities and
durations, inter-trial intervals, inter-stimulus intervals, session durations, and number of
trials per session. These variables are defined when constructing a protocol.
Dependent Variables
Freezing Behavior (defined as no movement other than breathing) is the primary
dependent variable of the system. Freezing is defined using Motion Threshold and
Minimum Freeze Duration.
Protocol Setup Utility
Customized experimental protocols can be efficiently designed and implemented using
the Protocol Setup utility of Video Freeze® software. This utility creates a “*.pro” file
that is later executed when conducting an experimental session.
Defining the Stimulus Conditions
Select File | Protocol Setup and the following screen will appear.
Figure 5.1 - Opening the Protocol Setup Window
26
DOC-321 Rev 1.1 Copyright© 2019
MED Associates, Inc.To define the stimulus conditions, click New. The Stimulus Definition screen will appear
(Figure 5.2). Set Total Time, which is the total duration of the protocol in seconds, and
select the Stimuli to be used in the protocol by checking the corresponding boxes. Note
that only the Stimuli defined in Stimuli Definition appear on this list. When the desired
stimuli have been selected, click OK to continue. These selections may be changed later
by clicking Stimulus on the Protocol Setup screen.
Figure 5.2 - Stimulus Selection with User Defined Stimuli Names
To begin adding stimuli to the protocol, click Add and the Add Item screen will appear
(Figure 5.3). This function is used to define the stimulus durations and intensities, and
determines the onset and offset times for each stimulus. Use the pull-down menu to
select the desired stimulus, and then enter the Start Time in seconds and the Duration in
seconds. Click OK to add this item to the protocol. A representation of this item will
appear on the Protocol Setup screen. An example is shown below.
Figure 5.3 - Add Item
27
DOC-321 Rev 1.1 Copyright© 2019
MED Associates, Inc.Click Add again to add another stimulus to the protocol, or right -click on the stimulus
representation shown on the Protocol Setup screen and click Copy (see Figure 5.4 ).
Then, right-click near the desired start time for the item and select Paste. A
representation of the new stimulus will appear.
Click on a stimulus representation (the red or green rectangle ) to modify the properties
of the stimulus. Properties may be modified either by changing the values in the
“Function Detail” area of the screen, or by pressing and holding the “Ctrl” key while
simultaneously clicking and dragging the ends of the stimulus representation. Any
changes made to the properties using the mouse will be displayed in the “Function
Detail” area of the screen. In Figure 5.4, the first representation of the sound stimulus
has been selected.
The “Function Detail” area of the screen is also where other Stimuli parameters are
defined, as shown in Figure 5.4. The Volume (dB), Frequency (Hz) and Rise Time (ms)
can be changed, as well as whether the audible stimulus is a Tone or Noise.
In the example shown in Figure 5.4, Stimulus 1 (sound) begins 10 seconds after the
experiment starts and turns off 30 seconds later. Stimulus 2 (shocker) begins 30
seconds after the experiment starts and the duration is 10 seconds. All stimuli are
independently defined.
Figure 5.4 - Editing Protocol Setup
28
DOC-321 Rev 1.1 Copyright© 2019
MED Associates, Inc.Saving a Protocol
Once all of the desired stimuli have been added to the protocol, select Save As to save
the protocol and all stimulus properties. Save the protocol to the desired directory, it
may be useful to create a folder titled “Video Freeze Protocols.” The program will
automatically save the file with a “*.pro” extension.
Figure 5.5 – Saving a *.pro File to a Specified Directory
Modifying an Existing Protocol
To modify an existing protocol, go to File | Protocol Setup, and then select Load and
choose the desired protocol. Click on a stimulus representation to modify the
properties of the stimulus. Properties may be modified either by changing the values in
the “Function Detail” area of the screen, or by pressing and holding the “Ctrl” key while
simultaneously clicking and dragging the ends of the stimulus representation. Any
changes made to the properties using the mouse will be displayed in the “Function
Detail” area of the screen. In Figure 5.4, the first representation of Stimulus 1 has been
selected. Click on a stimulus representation and click Delete to remove it from the
protocol.
29
DOC-321 Rev 1.1 Copyright© 2019
MED Associates, Inc.CHAPTER 6 | STARTING AN EXPERIMENTAL SESSION
From the main Video Freeze menu, choose Experiment | Start and the Experiment Setup
screen, shown below, will appear.
NOTE: Video Freeze will detect when a USB camera is disconnected while within the
screen by displaying an error dialog box on the screen. The
disconnected camera will still be shown as part of the experiment, but the
image displayed will be a static image of the last good frame captured. If the
camera is reconnected while the experiment is still active, Video Freeze will
detect that the camera was reconnected, but the already defined/running
experiment will not dynamically start capturing images from that re -connected
camera. The user is required to the experiment and another
experiment after the camera has been re-connected.
Figure 6.1 - Experiment Setup
30
DOC-321 Rev 1.1 Copyright© 2019
MED Associates, Inc.Experimental Setup
The Experiment Setup screen includes the following fields/menus:
Experiment Id: If Auto Experiment ID Generation is selected on the Options
menu, a filename will automatically appear in the Experiment
window. This filename will include the date and time of the
experiment, and follows the form: “VFMMDDYY_HHMMSS” This
information can be altered to suit the particular experiment .
Trial: Enter trial/session information in the Trial field.
Load and Save: Select Save to save the experimental configuration (*.exp) for
later use, and choose Load to use a previously saved experiment
file.
Protocol: Next to the Protocol title, click the box labeled “…” to open the
protocol (*.pro) file saved earlier. (See Saving a Protocol Page 29).
Notes: Enter any relevant information here, such as instructions on how
to complete the experiment.
Motion
Threshold: See Threshold Values below.
Sample
Rate: The sample rate refers to the number of video frames scanned per
second. This value is fixed at 30 fps.
Method: See Chapter 7.
Min Freeze Duration: The number of contiguous frames of movement less than the
motion threshold that defines a Freeze event
Ok: Starts the experiment.
Cancel: Cancels and exits.
31
DOC-321 Rev 1.1 Copyright© 2019
MED Associates, Inc.Threshold Values
The subject’s behavior is quantified as an index of motion. All movement within the
conditioning chamber is registered by the software as a change in video pixel
composition over time. Therefore, robust and fast movements will be recorded as large
relative changes in video-pixel composition, and small, refined, and slow-movements
will be registered as relatively smaller changes in pixel composition. The index of
motion has a range of 0 – 76,800 and during an experiment, movement is represented as
a graph (motion index vs. time) in a non-cumulative manner.
Motion Threshold refers to the limit above which all behavior will register as movement
(Not freezing) in the index of motion. When movement falls below this threshold, this
behavior will be counted as freezing, depending upon the method of observation
chosen. A Motion Threshold of 10-20 arbitrary units is recommended.
NOTE: The Motion Threshold can be modified after the experiment is complete during
data analysis. The Method of Observation and minimum freeze duration can also be
changed in data analysis.
Minimum Freeze Duration (number of frames) defines whether or not a Freeze Episode
is recorded when a subject freezes during the session and the motion index falls below
the Motion Threshold. The subject might momentarily stop moving, but this immobility
may not actually represent a freeze. The Minimum Freeze Duration prevents these brief
immobility events from being recognized as freeze episodes.
If the Minimum Freeze Duration is 30 frames, then the subject must remain immobile
for one second to register as a freeze, as the video acquisition rate is 30 frames per
second.
32
DOC-321 Rev 1.1 Copyright© 2019
MED Associates, Inc.CHAPTER 7 | METHODS OF OBSERVATION
Linear Method (Default)
MED Associates recommends using the Linear Method as it takes advantage of all data
collected by the software
The dependent measures resulting from the linear method are:
1. Percent Freeze: time immobile / total session time. The run-time window (see the
section on “Recording the Session”) of Video Freeze also provides:
Instantaneous Percent Freeze: time spent immobile / current session time
Cumulative Percent Freeze: time spent immobile / total session duration. This
percent freeze score will increase as the session progresses because time
immobile will increase relative to total session time. Cumulative Percent Freeze
will approach Instantaneous Percent Freeze as the session progresses.
2. Freeze Episodes: number of freezing events, defined by Motion Threshold and
Minimum Freeze Duration
3. Freeze Duration: total amount of time the subject spends immobile.
In Figure 7.1 each filled-in circle represents a video frame (30 fps). The subject freezes
at 0.2 seconds (because movement is below the Motion Threshold), and remains
freezing until ~0.75 seconds. Using the linear method, the first Freeze Episode is
recorded at 0.4 seconds because the Minimum Freeze Duration (6 frames) has e xpired.
Movement is recorded at 0.75 seconds, and the subject is immobile again at ~0.95
seconds. Once the Minimum Freeze Duration has expired (at ~1.15 seconds), the second
Freeze Episode is recorded. Note that the Motion Threshold must be exceeded before a
second Freeze Episode can be recorded; therefore, when using the linear method,
Freeze Episodes must be separated by periods of movement.
33
DOC-321 Rev 1.1 Copyright© 2019
MED Associates, Inc.Figure 7.1 - Description of the Linear Method
Discrete Method
The discrete method is designed to mimic manual methods of monitoring freezing
behavior. The standard manual method of tracking freezing involves visually scanning
each fear-conditioning chamber at regular Observation Intervals (e.g. Every 4 seconds),
and observing behavior for a specified duration of time (Observation Duration, e.g. 1
second). If the subject in the chamber is freezing for the entire Observation Duration (1 -
second), a Freeze Count is recorded for that event. If the subject is mobile during any
portion of that observation period, then no Freeze Count is tallied . Therefore, the
number of “counts” recorded by the end of the experimental session serves at the
quantitative measure of freezing. Therefore, the discrete method yields:
1. Freeze Count: number of freezing observations
2. Percent Freeze: number of freezing observations / total number of possible
observations
34
DOC-321 Rev 1.1 Copyright© 2019
MED Associates, Inc.Observation Interval and Duration are used to determine whether a Freeze Count is
registered for a freezing event. In the Figure 7.2, the green squares represent
“observations.” A Freeze Count is recorded only when there is no motion during the
observation duration. In Figure 7.2 the highlighted green squares are Freeze Counts;
therefore four Freeze Counts are recorded for the session . Note that the frequency of
Freeze Counts is greater than the number of Freezing Episodes recorded using the linear
method. This is because several Freeze Counts can occur without a record of movement
using the discrete method.
Observation Interval and Duration must be set to greater than 1 fps, and the
Observation Duration must be less than the Observation Interval . The Observation
Interval defines the time period between the beginning of one observation and
beginning of the next. Therefore, with a Sample Rate of 30 fps, and an Observation
Interval of 15, there will be two observations per second.
Figure 7.2 - Description of the Discrete Method
35
DOC-321 Rev 1.1 Copyright© 2019
MED Associates, Inc.CHAPTER 8 | VIDEO CAPTURING SYSTEM CALIBRATION
Prior to loading the subjects into the chambers, the video-capturing system must be
calibrated. Ensure that the Chamber is pushed all the way to the back of the Cubicle, the
NIR light source is turned on in each box and all doors are closed. Click the Calibrate
button on the acquisition screen, indicated by the green outline in Figure 8.1.
Figure 8.1 - The Run Time Screen during Calibration
After the process is completed the green motion index line should be at zero, indicating
all chambers are calibrated. The slider bar at the right side of the Motion Index graph
can be adjusted to view the motion values more closely.
When ready to begin the Experiment, click the Lock button. The Record button will now
become available.
36
DOC-321 Rev 1.1 Copyright© 2019
MED Associates, Inc.CHAPTER 9 | RECORDING THE SESSION
To begin an experiment, load all the animals into the chambers, close the doors, and
click the Record button. The Motion Index graph will display movement and the stimuli
will be presented in an automated fashion. The session is complete when the Motion
Index recorder reaches the end of the timeline. At the completion of the session, the
video will stop recording.
To view the video and motion-index data from a particular chamber, click on the data
window of the desired chamber (for example Chamber 1 in Figure 9.1) with the 1-4
slider set to the “1” position. The motion index graph displays the movement from the
box with the data window outlined in red. Mouse click the data window to display the
Motion Index graph for that particular box. The red outline will indicate the box whose
data is displayed in the Motion Index graph. To view the video from all four chambers
simultaneously, click the Cameras 1 - 4 slider control located under the video display. A
single click toggles between 1 and 4 video displays.
Figure 9.1 - The Video Freeze Run Time Screen
37
DOC-321 Rev 1.1 Copyright© 2019
MED Associates, Inc.NOTE: The video cameras are extremely sensitive to movement. Therefore, any
vibration in the laboratory environment may register as movement in the Motion
Index.
CHAPTER 10 | DATA ANALYSIS
Types of Data Files
When an experiment is conducted, the Video Freeze® Software simultaneously creates
three different types of data files. One is a video file (“*.wmv”) that can be viewed by
Windows Media Player for a single chamber. For multiple chambers go to file> extract
video stream, then select boxes 1-4 or individual boxes, this will create 1 .wmv file per
box, which may then be played using Window’s Media Player (see Figure 10.1). Another
is a summary file (“*.txt”) that can be exported to any spreadsheet program such as
Excel ® or notepad (see the section on Exporting Data to a Spreadsheet). The third type
is a “*.raw” data file that can only be viewed using Video Freeze®. This “*.raw” file
contains the motion-index data (see Figure 10.3). See the next section to learn how to
use Video Freeze® to re-analyze the “*.raw” data file.
Figure 10.1 - Windows Media Player File (*wmv)
38
DOC-321 Rev 1.1 Copyright© 2019
MED Associates, Inc.Figure 10.2 - Summary File (*.txt)
Analyzing “*.raw” data in Video Freeze ®
Select File | Open and locate the “*.raw” data file of interest. The Video Freeze® Data
Analysis window provides the same information as the run-time window (video, motion
index, subject identifying information, freeze count, etc.) .
Figure 10.3 - The “*.raw” Data Analysis Window
Pick which chamber to view from the “Select Box” list control
39
DOC-321 Rev 1.1 Copyright© 2019
MED Associates, Inc.Use the stop/play/Frame step play speed tabs to play the
video. If modifying the Method, Motion Threshold or Minimum Freeze Duration, click
on the Recalc button to calculate Freezing Measures.
NOTE: These settings apply to all videos in the experimental session.
To focus on a specific period of time during the session, click on the blue timeline bar
located below the motion index record. Adjusting the blue bar by dragging the cursor
causes the motion-index to expand. The collapsed timeline bar represents the
proportion of time (out of the total session time) represented in the immediately
available motion index display. Click the Full scale button directly to the left
of the blue timeline bar to return to a view of the entire session.
Figure 10.4 – Adjusting the Blue Timeline
To obtain dependent measures from a specified interval of time within the session, use
the Range Cursors. Select the Range Cursors with a right click on the motion index
graph (see Figure 10.5), and then choose the Cursors | Range Cursors to Center option.
Adjust the positioning and length of the specified interval by moving the vertical blue
lines with a left-click and drag of the mouse. Drag the blue lines to the desired position
in the Motion Index Graph, and then press Recalc. Adjusting the position of the Range
Cursors will alter the data listed under the “Cursors” display on the data analysis screen.
40
DOC-321 Rev 1.1 Copyright© 2019
MED Associates, Inc.Figure 10.5 - Selecting the Range Cursors
The figure below displays the Range cursors. Note that the Freezing Measures reflect
only the data that exist between the two vertical lines on the Motion Index Graph.
Figure 10.6 - Positioning the Range Cursors
NOTE: If the range cursors are selected, only the data between the two cursors will be
represented in the data file for export to Excel (see the next s ection for
instructions on exporting).
Exporting Data to a Spreadsheet
Exporting the data file to a desired location on the desktop computer by selecting File |
Export. Creates a “.csv” file, that in turn can be opened by Microsoft excel, Open Office,
Notepad or other spreadsheet software.
Once the file has been exported, go to that file location and double click on that named
file and open it in selected spreadsheet software.
41
DOC-321 Rev 1.1 Copyright© 2019
MED Associates, Inc.Exporting Video
Exporting a video file (“*.wmv”) that can be viewed by Windows Media Player for a
single chamber or multiple chambers, go to file> extract video stream, then select boxes
1-4 or individual boxes, select the (“*.raw”) file, this will create 1 .wmv file per box,
which may then be played using Window’s Media Player (see Figure 10.1).
Figure 10.7 - Imported Data File in Microsoft Excel
42
DOC-321 Rev 1.1 Copyright© 2019
MED Associates, Inc.CHAPTER 11 | COMPONENT ANALYSIS
One may choose to compare percent freeze across different events within a single
experimental session. For instance, if several conditioned-stimulus/unconditioned-
stimulus (CS-US) pairs are presented within a single session, then the amount of time
the subject spends motionless during each presentation of each CS may provide
meaningful information on the rate of conditioning.
Figure 11.1 - Data from Four CD-1 Mice During Fear Conditioning
The session represented in figure 11.1 was 30-min long with six presentations of a 30
second tone and 10 second aversive stimulus (stimuli co-terminated). Two subjects
received 0.45mA aversive stimulus, and two received 0.27mA of aversive stimulus.
Percent freeze during the first 20 seconds of each CS presentation is illustrated above.
Component Summary Report
To begin, open a *.raw data file, and select View | Component Setup.
The Start Time and Duration of each event, or component, are user-defined. Therefore,
one can compare percent freeze across any interval within a single experimental
session.
To define each component, select Component | Add (see Figure 11.2). Name each
component, and enter the Start Time (s) and the Duration (s). Percent freeze will be
calculated for each component, and the Start Time and Duration of the component
determine the parameters for the calculation.
43
DOC-321 Rev 1.1 Copyright© 2019
MED Associates, Inc.Figure 11.2 - Component Definition Display
Click Add New to add a component or OK when all the desired components for the
analysis have been included. As new components are added to the analysis, each
component will appear in the “Report Component Definition” display.
The component analysis (“*.cmp”) is a file that can be saved independently of any
“*.raw” data file. Choose Component | Save, and select the directory and filename for
the component analysis, see below. This procedure has created a component analysis
that can be applied to any “*.raw” data file.
Figure 11.3 - Saving a Component Analysis (*.cmp file)
To view a summary report of the component analysis, go to File | Reports | Component
Summary, then type in a file name to save the report as a “*.csv”. The “*.csv” file is a
tab-delimited data file that can be read by any word-processing or spreadsheet program.
44
DOC-321 Rev 1.1 Copyright© 2019
MED Associates, Inc.Figure 11.4 - Component Analysis Results, *.csv file in Excel
“*.csv” Dependent Variables
The “*.csv” file contains identifiers and component-analysis details, as well as four
dependent variables, listed below.
1. Freeze Count or Freeze Episodes: Number of freezing events, as defined by
either the linear or discrete method of observation (respectively), during the
component.
2. Time Freeze: Total number of seconds the subject spends motionless during the
component interval.
3. Percent Total Time Freeze: The amount of time the subjects spends motionless
during the session divided by the total amount of time for the session.
4. Percent Component Time Freeze: The amount of time the subject spends
motionless during the component divided by the total amount of time within
that component.
5. Average Motion Index: The average motion index during the component.
6. Minimum Motion Index: The minimum motion index during the component.
7. Maximum Motion Index: The maximum motion index during the component.
Batch Component Summary Report
To simultaneously apply a “*.cmp” file to multiple “*.raw” data files, go to File | Reports
| Batch Component Summary. This option will allow the user to view and save a “*.csv”
file that contains multiple experimental session data.
45
DOC-321 Rev 1.1 Copyright© 2019
MED Associates, Inc.To generate a batch component summary report, click the first button marked “…” and
select a “*.cmp” file. Then name the batch report using the second “…” button. Select a
Method of Observation (Linear or Discrete) and define the threshold values . These
setting will be applied to all of the *.raw data included in the batch summary report.
Figure 11.5 - Generating a Batch Summary Report Using Multiple "*.raw" Data Files
Select OK, and then choose the “*.raw” file or files to which the “*.cmp” analysis will be
applied. To select multiple files at once, press the Ctrl key while using the left mouse
button.
Figure 11.6 - Select the "*.raw" File or Files
Upon selecting the “*.raw” data files, the batch component analysis will be saved to the
location specified for the output file. The batch component summary report will contain
all of the dependent variables included in the component summary .
46
DOC-321 Rev 1.1 Copyright© 2019
MED Associates, Inc.APPENDIX A | DRIVER AND SOFTWARE INSTALLATION
If the computer being used with the Video Fear Conditioning System was purchased as
part of the system from MED Associates, the driver and software installation was
completed at the factory. If the computer was not purchased from MED Associates,
follow the instructions to install the hardware drivers and software programs .
Before beginning the installation, phone, fax or e-mail Med Associates with the
registration information in order to receive the software installation password . This
password will be necessary during the installation process.
Insert the Video Freeze® CD into the CD-ROM drive and the screen shown in Figure A-1
will appear. Click Install Video Freeze and the screen shown in Figure A-2 will appear.
Figure A-1 - Installation Screen
Begin installing the drivers and software by clicking Install. Complete the steps to install
the drivers and software, entering the desired User Name and Company as well as the
password when prompted.
Successful installation of each item will be indicated by a green check mark, and a red X
will indicate an unsuccessful installation.
Figure A-2 – Video Freeze Installation Checklist
Driver and software installation has been successfully completed . Click Finish to close
this screen.
47
DOC-321 Rev 1.1 Copyright© 2019
MED Associates, Inc.APPENDIX B | DOOR HINGE ADJUSTMENT
The steps in this section should be followed to ensure that the Sound-Attenuating
Cubicle (SAC) doors are properly adjusted.
1. Close the left door and verify that it is properly sealed against the SAC . When the
door is properly sealed the gap between the door and the SAC is equal at bo th ends,
as shown in Figure B-1. If this gap is not even, proceed to Step 2.
Figure B-1 - Top View of SAC with Properly Sealed Door
2. Loosen the hinge-retaining screw, shown in Figure B-2, and slide the hinge into the
proper position. Once the door is sealed correctly, tighten the hinge-retaining
screw. Repeat this step on the right door. It may take more than one attempt to
achieve an acceptable seal.
Figure B-2 - Hinge Retaining Screw
3. Close the left, then the right doors. The vertical seam between the two doors should
be evenly spaced from top to bottom, as shown in Figure B-3. If they are not,
proceed to Step 4.
- 48 –
DOC-321 Rev1.1 Copyright © 2019
MED Associates, Inc.Figure B-3 - Front View of SAC with Even Vertical Door Gap
4. Adjust the door position using the Horizontal Adjustment Screw. Turn the screw
clockwise to move the door closer to the vertical center of the SAC, and
counterclockwise to move it further. For example, if vertical gap between the doors
is smaller at the top of the SAC than at the bottom, assess which door needs to be
adjusted. If it is determined that the top of the right side door is too close to the
center, then the Horizontal Adjustment Screw on the top hinge should be turned
counterclockwise.
Figure B-4 - Horizontal Adjustment Screw
- 49 –
DOC-321 Rev1.1 Copyright © 2019
MED Associates, Inc.APPENDIX C | CAMERA FILTER CARE AND HANDLING
Proper care and handling of the camera filter are crucial to the proper operation of the
system. Clean the filter gently only if necessary. Loose particles should be removed
with a bulb puffer or with a filtered, pressurized air cleaner . If necessary, gently wipe
the surface using anhydrous alcohol and lint-free lab towels. Use a new surface of the
towel with each wipe. Avoid touching or wiping the filter with bare fingers.
Figure C-1 – Camera lens Filters
- 50 –
DOC-321 Rev1.1 Copyright © 2019
MED Associates, Inc.APPENDIX D | INSTALLING CONTEXTUAL INSERTS
A-Frame Insert
Using the handle, pull the grid floor and waste pan forward until they are nearly
removed from the chamber. Install two supports on one side of the chamber in the
counter-bored notches of the support panels inside the chamber, secure them by
placing the magnets on the outside of the chamber. Lift one side of the A -Frame so that
it rests on the supports. While lifting the opposite side of the A-Frame add the last two
supports and secure with magnets. Refer to Figure D-1.
Figure D-1 - A-Frame Contextual Insert Installed
Smooth Floor Insert
Install the smooth floor contextual insert by sliding the chamber forward inside the SAC
and opening the chamber door. Using the handle, pull the grid floor and waste pan
forward until they are nearly removed from the chamber. Place the smooth floor insert
over the grid floor. Refer to Figure D-2.
Figure D-2 - Smooth Floor Contextual Insert Installed
- 51 –
DOC-321 Rev1.1 Copyright © 2019
MED Associates, Inc.Curved Wall Insert
Begin installation of the curved wall contextual insert by sliding the chamber forward
inside the SAC and opening the chamber door. Using the handle, pull the grid floor and
waste pan forward until they are completely removed from the chamber. Place the
insert inside of the chamber so that the ends are braced against the s ide wall supports
of the chamber. Refer to Figure D-3. Be sure to install so that the orientation of the
sound perforation and light cut-out are correct. Reinstall the grid floor and waste pan
prior to placing animals in the chamber.
Figure D-3 - Rounded Back Wall Contextual Insert Installed
NOTE: When using Contextual Inserts, Camera Calibration and Average Intensity may
need to be adjusted.
- 52 –
DOC-321 Rev1.1 Copyright © 2019
MED Associates, Inc.APPENDIX E | USB TOPOLOGY
Recommended Configurations
The Video Fear Conditioning product (SOF-843) has been modified to support USB 3.0
cameras. SOF-843 versions 2.7.3 and earlier supported only IEEE-1394 (a.k.a. FireWire)
cameras (VID-CAM-MONO-2A and VID-CAM-MONO-4). SOF-843 versions 3.0.0 and
higher support both FireWire and USB 3.0 cameras (VOD-CAM-MONO-5). With the
introduction of the USB 3.0 camera, the FireWire cameras, hubs, and cabling will be
replaced with USB 3.0 cameras, cabling, and optional hubs. The USB 3.0 interface has
different specifications regarding cable and hub requirements, and as a result, Med
Associates has modified the Video Fear Conditioning bill-of-materials to accommodate
these requirements. As a result of these requirements, the topology of the USB network
will need to adhere to certain guidelines that conform to the specifications.
Listed below are the two recommended configurations that take into consideration the
USB cable length restriction. These two options require stacking of the SACs. Three
additional configurations are listed for those systems that require the Sound
Attenuating Cubicles (SACs) to be positioned in a horizontal configuration (i.e. stacking
of SACs is not an option).
The following diagram is a front view of (4) SACs that have been stacked using the
Stacking Kit (SAC-001).
Figure E-1 –Stacked SACs (view from front)
SAC #1 (Front) SAC #2 (Front)
Stacking Kit
(part # SAC-001)
SAC #3 (Front) SAC #4 (Front)
NOTE: There is limited flexibility in the USB topology. Variations to the suggested
topologies can be considered on a case-by-case basis when the recommended
topologies do not fit a customer’s system layout.
- 53 –
DOC-321 Rev1.1 Copyright © 2019
MED Associates, Inc.(Primary) Option #1: Connects (4) USB cameras directly into USB 3.0 ports on the back
of the PC. The cameras are mounted in (4) SAC that are stacked two-high. Stacking of
(2) SAC is critical to minimize the cable length required to span from the camera to the
PC.
Figure E-2 –Primary Configuration (view from above)
3 meters (#CAB-USB3-A-MB-3M)
(Back) (Back)
USB3
Back
Ports
SAC 1/3 SAC 2/4
(Stacked) (Stacked)
PC SAC4
C1 C2
C3 C4
(Alternate) Option #2: This configuration can be utilized when the “Primary Option” is
not permitted due to USB cable length restrictions (i.e. longer cable runs are required) .
This option connects (4) USB cameras to (2) USB 3.0 hubs (#USB-VID-HUB-USB3), and the
(2) hubs are connected directly into USB 3.0 ports on the back of the PC. The system is
designed to support no more than (2) USB cameras for USB hub. The cameras are
mounted in (4) Sound Attenuating Cubicles (SAC) that are stacked two -high. Stacking of
(2) SAC is critical to minimize the cable length required to span from the camera to the
PC.
Figure E-3 –Alternate Configuration (view from above)
3 meters (#CAB-USB3-A-MB-3M)
2 meters (provided w/ hub) USB3
HUB
(Back) (Back)
USB3
HUB
USB3
Ports SAC 1/3 SAC 2/4
(Stacked) (Stacked)
PC SAC4
C1 C2
C3 C4
- 54 –
DOC-321 Rev1.1 Copyright © 2019
MED Associates, Inc.(Horizontal) Option #3: This configuration should only be utilized when the (4) SAC
must be positioned in a horizontal configuration (i.e. stacking of SAC is not an option).
This option connects (4) USB cameras directly into USB 3.0 ports on the back of the PC.
Due to USB cable length restrictions, the PC must be positioned where all (4) USB cables
extending from the (4) USB cameras can reach the back of the PC . To accomplish this,
positioning the PC in the middle of the (4) SAC (two on each side) is the recommend ed
position.
Figure E-4 –Horizontal Configuration (view from above)
3 meters (#CAB-USB3-A-MB-3M) 3 meters (#CAB-USB3-A-MB-3M)
(Back) (Back) (Back) (Back)
USB3
Back
Ports
SAC1 SAC2 SAC3 SAC4
PC
C1 C2 C3 C4
(Alternate Horizontal) Options #4 and #5: This configuration should only be utilized
when (4) SAC must be positioned in a horizontal configuration (i.e. stacking of SAC is not
an option) and Option #3 is not permitted. This option connects (4) USB cameras to (2)
USB 3.0 hubs (#USB-VID-HUB-USB3), and the (2) hubs are connected directly into USB
3.0 ports on the back of the PC. Due to USB cable length restrictions, the PC must be
positioned where all (4) USB cables extending from the (4) USB cameras can reach the
back of one of the USB hubs (maximum of two cameras per hub), and the (2) USB cables
extending from each USB hub must reach the back of the PC. To accomplish this, two
variations are diagrammed.
Figure E-5 –Alternate Horizontal Configuration (view from above)
2 meters
3 meters (#CAB-USB3-A-MB-3M) 3 meters (#CAB-USB3-A-MB-3M)
USB (provided w/ hub) USB
HUB HUB
(Back) (Back) (Back) (Back)
USB3
Back
Ports
SAC1 SAC2 PC SAC3 SAC4
C1 C2 C3 C4
3 meters (#CAB-USB3-A-MB-3M)
2 meters (provided w/ hub) USB
HUB
USB
HUB
(Back) (Back) (Back) (Back)
USB3
Back
Ports
PC SAC1 SAC2 SAC3 SAC4
C1 C2 C3 C4
- 55 –
DOC-321 Rev1.1 Copyright © 2019
MED Associates, Inc.You can also read