Validation of leading point concept in RANS simulations of highly turbulent lean syngas-air flames with well-pronounced diffusional-thermal effects
←
→
Page content transcription
If your browser does not render page correctly, please read the page content below
Validation of leading point concept in RANS simulations of highly
turbulent lean syngas-air flames with well-pronounced
diffusional-thermal effects
Downloaded from: https://research.chalmers.se, 2021-09-24 20:23 UTC

     Citation for the original published paper (version of record):
     Verma, S., Monnier, F., Lipatnikov, A. (2021)
     Validation of leading point concept in RANS simulations of highly turbulent lean syngas-air
     flames with well-pronounced diffusional-thermal effects
     International Journal of Hydrogen Energy, 46(13): 9222-9233
     http://dx.doi.org/10.1016/j.ijhydene.2021.01.022

N.B. When citing this work, cite the original published paper.

research.chalmers.se offers the possibility of retrieving research publications produced at Chalmers University of Technology.
It covers all kind of research output: articles, dissertations, conference papers, reports etc. since 2004.
research.chalmers.se is administrated and maintained by Chalmers Library

                                           (article starts on next page)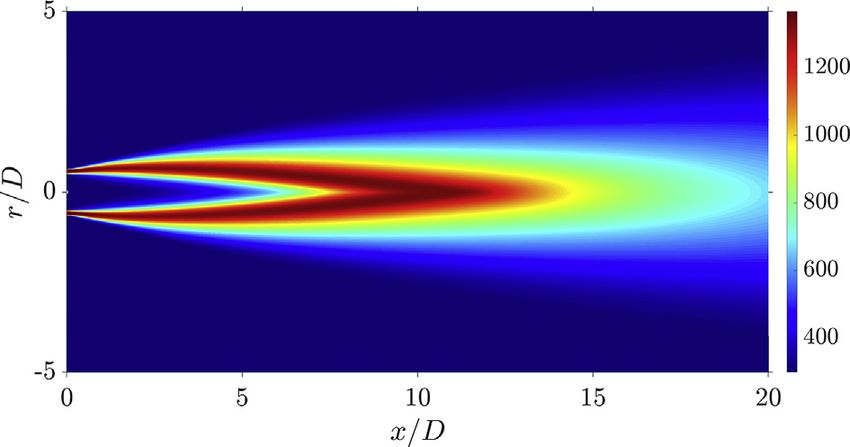
i n t e r n a t i o n a l j o u r n a l o f h y d r o g e n e n e r g y 4 6 ( 2 0 2 1 ) 9 2 2 2 e9 2 3 3

                                                      Available online at www.sciencedirect.com

                                                                   ScienceDirect

                                              journal homepage: www.elsevier.com/locate/he

Validation of leading point concept in RANS
simulations of highly turbulent lean syngas-air
flames with well-pronounced diffusional-thermal
effects

Salman Verma a,b, Florian Monnier c, Andrei N. Lipatnikov d,*
a
  Department of Mechanical Engineering, University of Maryland, College Park, MD 20742, USA
b
  John Zink Company, LLC, Tulsa, OK 74116, USA
c
  CORIA - CNRS, Normandie Universite, INSA de Rouen Normandie, 76000 Rouen, France
d
  Department of Mechanics and Maritime Sciences, Chalmers University of Technology, Gothenburg, 41296 Sweden

highlights

 Leading point concept is adapted for CFD research into complex-chemistry flames.
 Atlanta experiments with highly turbulent lean syngas-air mixtures are simulated.
 An increase in turbulent burning velocity with increasing H2/CO ratio is predicted.

article info                                          abstract

Article history:                                      While significant increase in turbulent burning rate in lean premixed flames of hydrogen or
Received 18 November 2020                             hydrogen-containing fuel blends is well documented in various experiments and can be
Accepted 4 January 2021                               explained by highlighting local diffusional-thermal effects, capabilities of the vast majority
Available online 29 January 2021                      of available models of turbulent combustion for predicting this increase have not yet been
                                                      documented in numerical simulations. To fill this knowledge gap, a well-validated Tur-
Keywords:                                             bulent Flame Closure (TFC) model of the influence of turbulence on premixed combustion,
Premixed turbulent combustion                         which, however, does not address the diffusional-thermal effects, is combined with the
Diffusional-thermal effects                           leading point concept, which highlights strongly perturbed leading flame kernels whose
Leading point concept                                 local structure and burning rate are significantly affected by the diffusional-thermal ef-
Modeling                                              fects. More specifically, within the framework of the leading point concept, local con-
Validation                                            sumption velocity is computed in extremely strained laminar flames by adopting detailed
                                                      combustion chemistry and, subsequently, the computed velocity is used as an input
                                                      parameter of the TFC model. The combined model is tested in RANS simulations of highly
                                                      turbulent, lean syngas-air flames that were experimentally investigated at Georgia Tech.
                                                      The tests are performed for four different values of the inlet rms turbulent velocities,
                                                      different turbulence length scales, normal and elevated (up to 10 atm) pressures, various
                                                      H2/CO ratios ranging from 30/70 to 90/10, and various equivalence ratios ranging from 0.40
                                                      to 0.80. All in all, the performed 33 tests indicate that the studied combination of the
                                                      leading point concept and the TFC model can predict well-pronounced diffusional-thermal
                                                      effects in lean highly turbulent syngas-air flames, with these results being obtained using
                                                      the same value of a single constant of the combined model in all cases. In particular, the

    * Corresponding author.
      E-mail address: lipatn@chalmers.se (A.N. Lipatnikov).
https://doi.org/10.1016/j.ijhydene.2021.01.022
0360-3199/© 2021 The Author(s). Published by Elsevier Ltd on behalf of Hydrogen Energy Publications LLC. This is an open access article under the CC BY
license (http://creativecommons.org/licenses/by/4.0/).
i n t e r n a t i o n a l j o u r n a l o f h y d r o g e n e n e r g y 4 6 ( 2 0 2 1 ) 9 2 2 2 e9 2 3 3              9223

                                                  model well predicts a significant increase in the bulk turbulent consumption velocity when
                                                  increasing the H2/CO ratio but retaining the same value of the laminar flame speed.
                                                  © 2021 The Author(s). Published by Elsevier Ltd on behalf of Hydrogen Energy Publications
                                                   LLC. This is an open access article under the CC BY license (http://creativecommons.org/
                                                                                                                                        licenses/by/4.0/).

                                                                                   concentrations can be high within reaction zones, thus,
Introduction                                                                       yielding molecular heat or species fluxes comparable with (or
                                                                                   even larger than) the local turbulent fluxes.
Due to unique characteristics of H2-air flames, such as a high                         The focus of theoretical research into the diffusional-
laminar burning velocity, a wide range of flammability limits,                     thermal effects is placed on single-step chemistry laminar
a low ignition energy, etc. [1], hydrogen is considered to be an                   flames with asymptotically high activation energy [37,38],
additive capable for significantly improving basic character-                      with differences between molecular transport coefficients
istics of combustion of fossil fuels [2e10], as well as renewable                  being characterized with a single Lewis number Le ¼ a=D.
fuels such as biogas [11e13]. Moreover, renewable synthesis                        Here, a is the molecular heat diffusivity of the mixture and D
gas (syngas) fuels are primarily composed of H2 and CO [14].                       is the molecular diffusivity of the deficient reactant (e.g., fuel
Accordingly, combustion of fuel blends that contain H2 is a                        in the lean case) in the mixture. Such theories yield analytical
promising and rapidly developed technology for clean and                           expressions for various Markstein numbers [39] Ma ¼
efficient conversion of energy in stationary power plants, ve-
                                                                                   d1       _ _ , which characterize sensitivity of various
                                                                                    L ðdSd =dsÞtc s/0
hicles, and aircrafts. These recent developments have been
                                                                                   displacement speeds Sd to the local rate s_ of the flame stretch
motivating fundamental research into basic characteristics of
                                                                                   caused by the flow. Here, tc ¼ dL =SL , dL , and SL are the time
laminar [15e17] and turbulent [18e25] burning of fuel blends
                                                                                   scale, thickness, and speed, respectively, of the unperturbed
that contain H2.
                                                                                   laminar flame (i.e., one-dimensional and planar flame that is
    From the fundamental perspective, the most challenging
                                                                                   stationary in the coordinate framework attached to it) and Sd
peculiarity of turbulent combustion of lean mixtures that
                                                                                   is the speed of an iso-scalar surface within the flame with
contain H2 in unburned reactants consists of a significant in-
                                                                                   respect to the incoming flow of unburned reactants. Note that,
crease in the burning rates of such mixtures when compared
                                                                                   in a perturbed flame, not only values of rSd are different for
to near-stoichiometric hydrocarbon-air mixtures with similar
                                                                                   different iso-scalar surfaces, but even the signs of the term
other characteristics. A number of earlier experimental data
                                                                                   ðrSd ru SL Þ can be different [39,40].
that clearly showed this important and well-pronounced
                                                                                       While available theoretical expressions for Ma can easily
phenomenon for lean H2-air mixtures was reviewed by
                                                                                   be used to analyze experimental data or to develop numerical
Lipatnikov and Chomiak [26]. Subsequently, more experi-
                                                                                   models of turbulent flames [41], such an approach does not
mental data of that kind were published, with an extremely
                                                                                   seem to be capable for predicting the abnormal increase in
strong magnitude of the discussed effect being recently
                                                                                   turbulent burning rate in lean hydrogen mixtures for a num-
documented by Yang et al. [27]. Such an effect was also
                                                                                   ber of reasons discussed elsewhere [26,35,40]. In particular, a
measured in lean syngas-air turbulent flames [28e32]. While
                                                                                   theory that addresses a limit of weak perturbations (tc s≪1) _
the effect is less pronounced in fuel blends when compared to
                                                                                   does not seem to be appropriate for predicting strong varia-
pure H2, the effect magnitude is large even in the former case.
                                                                                   tions in turbulent burning rate [35]. Accordingly, the present
It is also worth stressing, that such effects are well docu-
                                                                                   authors are not aware on a simulation that shows ability of a
mented in experiments not only with weakly turbulent, but
                                                                                   numerical model that describes the diffusional-thermal ef-
also with highly turbulent premixed flames [26,27,30,31].
                                                                                   fects solely by invoking Ma to predict abnormally high tur-
    From the qualitative perspective, the discussed peculiarity
                                                                                   bulent burning rates well documented in lean hydrogen
of turbulent combustion of lean mixtures that contain H2 is
                                                                                   mixtures [26,27].
commonly attributed to diffusional-thermal effects [33e35].
                                                                                       The present authors are aware on the sole successful
More specifically, if (i) molecular diffusivities of fuel, oxidant,
                                                                                   attempt [42] to predict this strong effect in a numerical study.
and heat are different and (ii) a flame is perturbed, e.g. curved
                                                                                   In the cited paper, Reynolds-Averaged Navier-Stokes (RANS)
or/and strained by the flow, then, the local equivalence ratio
                                                                                   simulations of statistically spherical turbulent flames
or/and enthalpy can be increased or decreased within the
                                                                                   expanding in very lean hydrogen mixtures were performed
reaction zone due to imbalance of heat and reactant fluxes
                                                                                   and abnormally high burning velocities were computed, in
from and to the zone, respectively. In a laminar flow, such
                                                                                   quantitative agreement with experiments by Karpov and
effects are well-known to cause diffusional-thermal insta-
                                                                                   Severin [43]. The strong increase in turbulent burning velocity
bility of the flame [33]. In a turbulent flow, the diffusional-
                                                                                   was predicted thanks to the use of the so-called leading point
thermal effects are more pronounced and complicated, e.g.
                                                                                   concept developed by the Russian school [33,34].
cf. Fig. 6a and b in Ref. [36]. While molecular diffusivities are
                                                                                       Within the framework of the concept [33e35], propagation
much smaller than turbulent diffusivities, diffusional-
                                                                                   of a premixed turbulent flame is hypothesized to be controlled
thermal effects can play an important role in turbulent
                                                                                   by the leading flame kernels (leading points) that advance
flames, because local gradients of temperature or species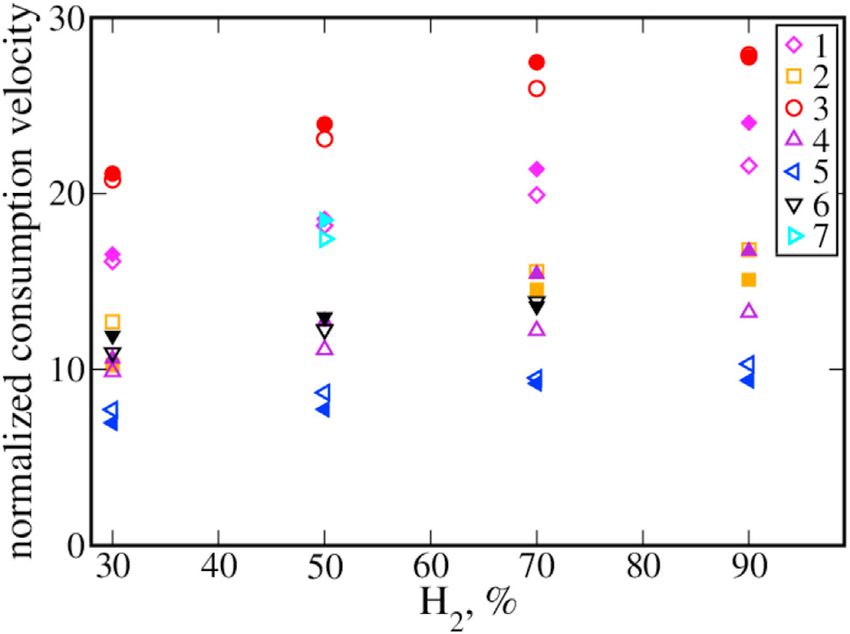
9224                         i n t e r n a t i o n a l j o u r n a l o f h y d r o g e n e n e r g y 4 6 ( 2 0 2 1 ) 9 2 2 2 e9 2 3 3

furthest into fresh reactants. Moreover, the structure of such                     opposed jets, see Fig. 1. Due to the symmetry of the problem
leading flame kernels is hypothesized to be extremely per-                         with respect to the stagnation plane, a single flame is simu-
turbed so that a further increase in the perturbation magni-                       lated. Such a problem is commonly modeled [56,57] with a set
tude would quench combustion locally. Accordingly,                                 of stationary, one-dimensional, axially symmetric transport
turbulent burning velocity is hypothesized to be controlled by                     equations for concentrations of various species and the
the local characteristics of strongly perturbed laminar flame                      mixture enthalpy (internal energy, or temperature), supple-
kernels, rather than by characteristics of the unperturbed                         mented with (i) continuity and impulse equations, (ii) a state
laminar flame. To use the concept in Computational Fluid                           equation, (iii) a model of molecular transport, and (iv) a
Dynamics (CFD) research into turbulent combustion, (i) a                           chemical mechanism.
model of the leading-flame-kernel structure should be                                 In the present work, these standard equations were
selected and (ii) the kernel characteristics should be pre-                        numerically solved by running the module OPPDIF [57] of
computed, followed by (iii) substitution of characteristics of                     CHEMKIN-II software [58] and activating options Multicompo-
the unperturbed laminar flame, which are commonly used as                          nent and Thermal Diffusion. When simulating weakly strained
input parameters when simulating turbulent combustion                              flames, the parameters GRAD and CURV, which controlled
[44e47], with the counterpart pre-computed characteristics of                      the spatial resolution, were set equal to 0.05 each. At high
the leading flame kernel. Since the latter flame kernel is highly                  strain rates close to extinction points, these parameters were
perturbed, its characteristics can be very different form                          decreased to obtain converged results that were weakly
characteristics of the unperturbed laminar flame, e.g. the local                   sensitive to a further decrease in GRAD or CURV. Typically,
burning rate can be much higher in lean hydrogen-air mix-                          both parameters were equal to 0.005 and the number of grid
tures [42]. Therefore, the leading point concept offers an op-                     points was about 5000. In a few cases, GRAD and CURV were
portunity to predict the strong increase in turbulent burning                      as small as 0.003, with the number of grid points being about
rate in such mixtures. For this purpose, two different models                      15 000.
of the extremely perturbed flame kernels have been sug-                               Distance between the inlet boundary (associated with a
gested: (i) a critically strained laminar flame [34] or (ii) a crit-               nozzle in Fig. 1) and the stagnation plane was set equal to
ically curved laminar flame [48], associated with a flame ball                     10 mm. The strain rate k, which was equal to the stretch rate
[33]. Characteristics of various critically perturbed laminar                      for the studied planar flames, was changed by varying the
flames were compared by Lipatnikov and Chomiak [49].                               inlet flow velocity and was characterized using the local peak
     The leading point concept was supported in recent theo-                       absolute value of the axial gradient of the axial flow velocity,
retical [50e52] and Direct Numerical Simulation (DNS) [53e55]                      reached upstream of the reaction zone. The laminar con-
studies. Moreover, Venkateswaran et al. [30,31] and Zhang                          sumption velocity Sc was evaluated by integrating the heat
et al. [32] reported that the use of the concept allowed them to                   release rate along the normal to the flame. The major goal of
significantly improve parameterization of their experimental                       the simulations consisted in finding the peak values Smax c   of
databases on turbulent burning velocities, obtained from lean                      the computed dependencies of Sc ðkÞ. As shown in Fig. 2a,
syngas-air flames. Nevertheless, the present authors are not
aware on the use of the concept in CFD research into turbulent
flames, with the exception of a single work [42]. However, in
that paper, fuel blends were not considered, and combustion
chemistry was reduced to a single reaction. Accordingly, there
is a need for assessment of the leading point concept in CFD
research into turbulent combustion of fuel blends by allowing
for complex combustion chemistry. The present paper aims at
filling this knowledge gap by performing RANS simulations of
recent experiments done by Venkateswaran et al. [30,31] with
highly turbulent lean syngas-air flames.
     In the next section, the selected model of leading flame
kernels is described, and their characteristics computed using
a detailed chemical mechanism are reported. In the third
section, RANS simulations of the aforementioned experi-
ments are presented. Obtained numerical results are dis-
cussed in the fourth section, followed by conclusions.

Strained laminar flames

To evaluate major characteristics of critically perturbed
laminar flames, strained planar flames are selected in the
present work following Kuznetsov and Sabelnikov [34]. The
same model problem was addressed by Venkateswaran et al.
[30,31] and by Zhang et al. [32] to parameterize their experi-
mental data. The problem involves two identical adiabatic,                         Fig. 1 e Strained laminar premixed flames stabilized in
axially symmetric laminar premixed flames stabilized using                         opposed jets.
i n t e r n a t i o n a l j o u r n a l o f h y d r o g e n e n e r g y 4 6 ( 2 0 2 1 ) 9 2 2 2 e9 2 3 3 9225
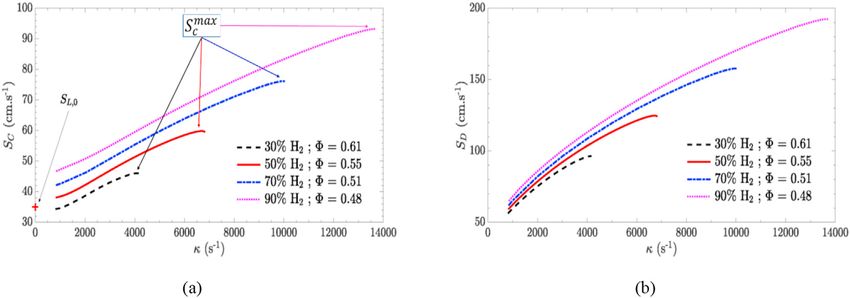
Fig. 2 e Dependencies of (a) the consumption velocity Sc and (b) the flame displacement speed Sd computed for strained H2/
CO/air laminar flames under the room conditions. F designates the equivalence ratio.
these peak values were reached close to the flame extinction the laminar consumption velocity obtained using these three
point kq . mechanisms are equal to 0.60, 0.62, and 0.63 m/s in that case.
It is worth noting that Fig. 2a differs from Fig. 16 in Ref. [30], The ratios of Smax
c =SL , computed for all H2/CO/air mixture
where results of similar simulations performed for the same compositions studied in the Atlanta experiments [30,31] are
mixtures are shown. The point is that Venkateswaran et al. reported in Table 1. In line with the leading point concept,
[30] reported a flame displacement speed Sd , which was equal these values were used as input parameters for RANS simu-
to “the minimum velocity just ahead of the reaction zone” in their lations of turbulent premixed flames, discussed in the next
study. In the unperturbed laminar flame, the consumption section.
velocity and displacement speed are equal to one another, Finally, Fig. 3 shows a typical dependence of Sc ðkÞ,
with this identity being checked in the present study. How- computed at low strain rates. The dependence changes dras-
ever, in a strained laminar flame, Sc sSd [37e39]. Indeed, the tically at k/0 (and, hence, Sc /SL ), thus, indicating that the
minimum flow velocities Sd just ahead of the reaction zone, Markstein number Mac ¼ d1
L ðdSc =dkÞtc k/0 is not appropriate
computed by us and shown in Fig. 2b, differ significantly from for describing significant differences between Sc ðkÞ and SL at
the consumption velocities evaluated under the same condi- moderate (and high) strain rates. Accordingly, the use of Mac
tions, with the present dependencies of Sd ðkÞ being similar to for modeling strong variations in local burning rate in turbu-
the aforementioned numerical results by Venkateswaran lent flows does not seem to be appropriate either. Note, that
et al. [30]. Some differences still remain probably due to the figures similar to Fig. 3 are reported in other experimental and
use of different chemical mechanisms. The point is that numerical papers, e.g. see Ref. [63].
Venkateswaran et al. [30] adopted a chemical mechanism by
Davis et al. [59], whereas a more recent mechanism by Gos- Turbulent flames
wami et al. [60] is selected in the present paper. For the same
reason, the unperturbed laminar flame speeds SL obtained in Studied cases
the present work, see Table 1, differ slightly from the values of Experiments simulated by us were performed using conical
SL reported by Venkateswaran et al. [30] and reproduced in H2/CO/air turbulent flames stabilized at the burner nozzle
Tables 2 and 3 in the next section. [30,31,64]. Two nozzles with diameters D equal to 12 and
In a single case (the pressure P ¼ 1 atm and the volumetric 20 mm were utilized. The unburned gas temperature was
H2/CO ratio is equal to 50/50, with all results reported in the equal to 300 K, whereas the pressure P was changed from 1 to
present manuscript being obtained for the unburned gas 10 atm. The volumetric H2/CO ratio was varied from 30/70 to
temperature equal to 300 K), two other recent chemical 90/10. The flow characteristics were changed by varying (i) the
mechanisms by Ke romne s et al. [61] and by Li et al. [62] were mean inlet flow velocity U from 4 to 50 m/s and/or (ii) blockage
also probed. Dependencies of Sc ðkÞ computed using these ratio (BR) for a plate located upstream of the nozzle [64].
three mechanisms looked similar, but the values of kq and Smax c Consequently, the rms turbulent velocity u0 , measured at the
were slightly different. More precisely, the peak values Smax
c of flow centerline 1 mm above the nozzle, was varied from 0.4 m/
Table 1 e Increase in the consumption velocity in extremely strained laminar flames.
H2, % 30 30 30 30 50 50 50 60 60 60 70 70 90 90
F 0.61 0.70 0.80 0.75 0.55 0.68 0.75 0.4 0.6 0.8 0.51 0.63 0.48 0.59
P, atm 1 1 1 5 1 5 10 1 1 1 1 5 1 5
SL , m/s 0.36 0.47 0.59 0.35 0.35 0.36 0.35 0.14 0.49 0.88 0.35 0.36 0.35 0.37
kq , ms1 4.2 5.55 7.1 26.7 6.6 47.6 96.1 1.3 10.7 16.4 10.0 75.2 13.7 106.
Smax
c = SL 1.28 1.19 1.14 1.37 1.71 1.86 1.81 3.0 1.67 1.28 2.17 2.44 2.66 3.0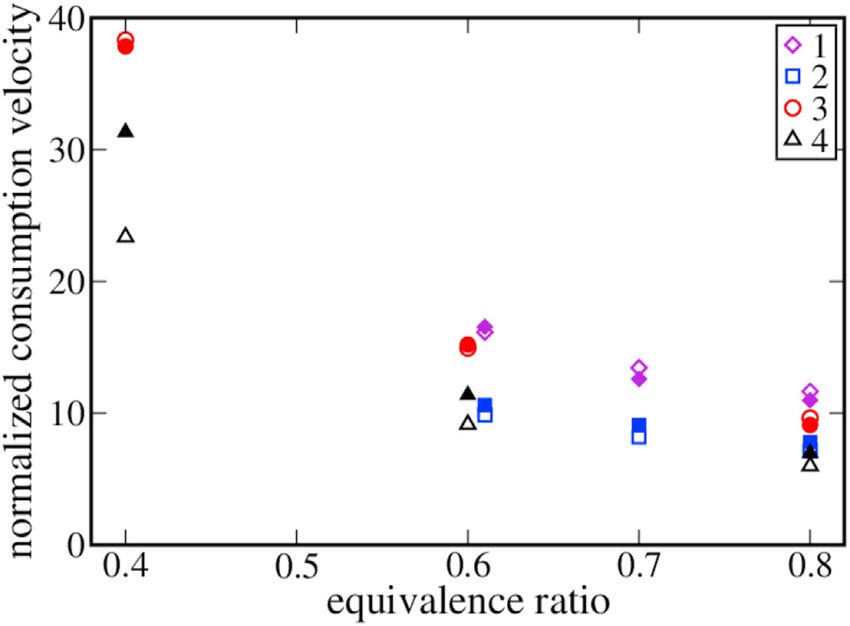
9226                           i n t e r n a t i o n a l j o u r n a l o f h y d r o g e n e n e r g y 4 6 ( 2 0 2 1 ) 9 2 2 2 e9 2 3 3

 Table 2 e Variations of equivalence ratio.
                                                                                                                  pffiffiffiffiffiffi
 N           H2, %                      F                             SL , m/s                U, m/s               2k=SL                  D, mm     P, atm
 1            30               0.61,   0.70,   0.80               0.34,   0.48,   0.59           50              33,   25, 20              20          1
 2            30               0.61,   0.70,   0.80               0.34,   0.48,   0.59           30              17,   13, 10              20          1
 3            60               0.40,   0.60,   0.80               0.15,   0.51,   0.90           50              82,   24, 13              20          1
 4            60               0.40,   0.60,   0.80               0.15,   0.51,   0.90           30              43,   13, 7.0             20          1

 Table 3 e Variations of hydrogen concentration in the fuel blend at a constant laminar flame speed.
                                                                                     pffiffiffiffiffiffi
 N           H2, %                   F                SL , m/s         U, m/s         2k=SL        D, mm                                            P, atm
 1          30, 50,   70, 90           0.61,   0.55,   0.51,   0.48                0.34               50                 33                 20        1
 2          30, 70,   90               0.61,   0.51,   0.48                        0.34               50                 21                 12        1
 3          30, 50,   70, 90           0.75,   0.68,   0.63,   0.59                0.34               50                 21                 12        5
 4          30, 50,   70, 90           0.61,   0.55,   0.51,   0.48                0.34               30                 17                 20        1
 5          30, 50,   70, 90           0.61,   0.55,   0.51,   0.48                0.34               30                 13                 12        1
 6          30, 50,   70               0.75,   0.68,   0.63                        0.34               30                 13                 12        5
 7          50                         0.75                                        0.34               30                 13                 12        10

                                                                                          the two highest inlet flow velocities (U ¼ 30 and 50 m/s), but (ii)
                                                                                          simulated all mixtures and pressures for which the turbulent
                                                                                          burning velocity UT was measured by Venkateswaran et al.
                                                                                          [30,31]. Moreover, since the influence of turbulence length
                                                                                          scale on burning rate is understood worse than the influence
                                                                                          of u0 on UT [65], but can be of great importance [66], the ex-
                                                                                          periments with both nozzles were simulated. Furthermore, to
                                                                                          make the simulations feasible and analysis of results clear, we
                                                                                          restricted ourselves to a single representative BR of 81%,
                                                                                          which was the median value of the interval of BRs investi-
                                                                                          gated by Venkateswaran et al. [30,31]. This restriction was also
                                                                                          set for the following two reasons.
                                                                                             First, variations of U and BR in the experiments changed
                                                                                          not only u0 and L, but other turbulence characteristics also. For
                                                                                          instance, turbulence spectra shown in Figs. 14 and 15 in
                                                                                          Ref. [64] are different for different BRs or different U, respec-
Fig. 3 e A typical dependence of the consumption velocity                                 tively. Accordingly, without detailed simulations of the flow
Sc on the strain rate computed for weakly strained lean H2/                               through the plate and near the walls of the contoured nozzle
CO/air laminar flames. 50% H2 and 50% CO, F ¼ 0:4; P ¼ 10                                 used in the experiments, the inlet turbulence cannot be
atm.                                                                                      properly characterized. Since such complicated simulations of
                                                                                          confined turbulent inert flows are beyond the scope of the
                                                                                          present study, the inlet boundary conditions were set by us at
s (U ¼ 4 m/s and BR ¼ 69%) to 9 m/s (U ¼ 50 m/s and BR ¼ 93%)                             the nozzle exit. However, for turbulence characteristics, such
[64]. The measured longitudinal integral length scale L of the                            boundary conditions are poorly known. In particular, the
incoming turbulence was mainly controlled by the diameter                                 “constant” Cd in Eq. (9) discussed later could be different for
D, but depended also on U and BR (0:05 < L=D < 0:3, see Fig. 13 in                        each pair of U and BR. Consequently, this “constant” may be
Ref. [64]).                                                                               tuned for each pair of U and BR. However, such tuning is of
    For a single nozzle, a single mixture composition, and a                              minor interest for the goals of the present study.
single P, totally 52 different incoming flows were studied (13                               Second, as reviewed elsewhere [65,67], capabilities of the
different BRs and four different U) in the experiments [30,31].                           Turbulent Flame Closure (TFC) model [68,69] used in the pre-
For three different pressures, two different nozzles, and nine                            sent work for predicting dependencies of turbulent burning
different mixture compositions, the entire condition matrix is                            velocity UT on u0 were already documented by various
five-dimensional and contains about 2800 cells. While not all                             research groups in RANS simulations of different experiments
these cells were filled in the Atlanta experiments [30,31], the                           performed under substantially different conditions. Accord-
number of the reported turbulent consumption velocities is                                ingly, one more such test of the TFC model is of secondary
still larger than 500. Accordingly, we had to reduce the con-                             interest, especially as a solid test is impeded due to the
dition matrix in order to make the simulations and analysis of                            aforementioned problem of the inlet boundary conditions.
their results feasible. Since the present study aims primarily                               Thus, for the above reasons, the present numerical study
at effects due to variation of the hydrogen amount in highly                              was restricted to a single BR. For this BR, the ratio of L=D is
turbulent lean H2/CO/air flames, we (i) restricted ourselves to                           close to 0.1. Conditions of the experiments simulated in the
i n t e r n a t i o n a l j o u r n a l o f h y d r o g e n e n e r g y 4 6 ( 2 0 2 1 ) 9 2 2 2 e9 2 3 3 9227
present paper are summarized in Tables 2 and 3 for series of turbulent burning was first pointed out by Prudnikov [74].
measurements performed by varying the equivalence ratio F Later, the same regime was discussed by Kuznetsov [78],
and H2/CO ratio, respectively. There, k ¼ 3u02 =2 is turbulent Clavin and Williams [79], and Zimont [80] who introduced the
kinetic energy. Note that the values of the laminar flame notion of “intermediate steady propagation (ISP) flames” [81].
speed, reported in these two tables, are taken from Refs. To close Eq. (1), a model for the turbulent burning velocity
[30,31], whereas slightly different values of SL , see Table 1, UT should also address the ISP regime of premixed combus-
were adopted in the present RANS computations. tion, i.e. turbulent flames with growing dT . The present au-
thors are aware on the sole model that satisfies this
Combustion model consistency requirement. That model was developed by
In the present work, the so-called TFC model [68,69] of the Zimont [80] and resulted in the following expression
influence of turbulence on premixed combustion is used for
1=4 2 1=4
the following two major reasons. First, it is the sole model that tT LS
UT ¼ Au0 Da1=4 ¼ Au0 ¼ Au0 0 L : (3)
has yet been adopted jointly with the leading point concept to tf u au
predict abnormally high turbulent burning velocities [42]
Here, A ¼ 0.5 [69] is the sole constant of the TFC model;
documented in very lean hydrogen-air turbulent flames. It is € hler number; tf ¼ au =S2L and tT ¼ L=u0
Da ¼ tT =tf is the Damko
worth remembering, however, that those simulations [42]
are the laminar-flame and turbulence time scales, respec-
were performed for a single fuel (hydrogen) by invoking a
tively; and au is the molecular heat diffusivity of unburned
single-step chemistry. Second, as reviewed elsewhere
reactants.
[35,65,67], the TFC model was quantitatively validated by
Zimont [80] derived Eq. (3) in the case of (i) a high turbulent
several independent research groups in RANS simulations of
Reynolds number, i.e. Ret ¼ u0 L=nu [1, (ii) a high Damko € hler
various measurements done by burning substantially
number, i.e. Da[1, and (iii) a large Karlovitz number, i.e. Ka ¼
different hydrocarbon-air mixtures under a wide range of 1=2
significantly different conditions. For instance, two of the Ret =Da > 1. Here, nu is the kinematic viscosity of unburned
present authors [70,71] successfully exploited the TFC model mixture. Moreover, in the regime explored by Zimont [80], the
to simulate seven sets of experimental investigations of sta- flame-development time should satisfy a constraint of
tistically stationary premixed turbulent flames whose tT < tfd ≪tT Da. That derivation was based on the following
geometrical configurations were different. three assumptions. First, the influence of small-scale turbu-
The TFC model is based on the following transport lent eddies on combustion was reduced to increasing heat and
equation mass transfer within local flames and thickening them, with
the width of the thickened flames being significantly smaller
v than the integral length scale L. Second, the influence of large-
ðr~cÞ þ V , ðru
~ ~cÞ ¼ V , ðrDT V~cÞ þ ru UT jV~cj (1)
vt scale turbulent eddies on combustion was reduced to wrin-
for the Favre-averaged combustion progress variable ~c, which kling the thickened flame surface. Third, the flame brush
characterizes the thermochemical state of a reacting mixture thickness dT was considered to grow following the turbulent
in a flame and is equal to zero or unity in reactants or prod- diffusion law. This hypothesis was earlier put forward by
ucts, respectively. Here,t is the time; r is the mean density Karlovitz et al. [82] and was confirmed by numerous experi-
calculated by invoking the well-known Bray-Moss-Libby (BML) mental data analyzed by Prudnikov [74]. Later, Lipatnikov and
equations [72,73]. Chomiak [65] noted that the first aforementioned assumption
could be changed to a more general assumption that the
ru
r¼ ; r~c ¼ rb c; (2) interaction between the local flame and the small-scale tur-
1 þ ðs 1Þ~c
bulent eddies was solely controlled by the flame time scale tf
u is the flow velocity vector; DT and UT are the turbulent and the mean dissipation rate ~ε. This hypothesis, which is in
diffusivity and burning velocity, respectively, discussed later; fact an extension of the well-recognized Kolmogorov hy-
s ¼ ru =rb is the density ratio; over-lines designate the Rey- pothesis to the case of premixed turbulent burning, allows us
nolds average, while q ~ ¼ rq=r is the Favre-averaged value of q to substitute the constraint of Ka > 1 with a constraint of
with q} ¼ q q ~; subscripts u and b designate unburned re- u0 =SL > 1, thus, making Eq. (3) applicable also to moderately
actants and burned products, respectively. turbulent combustion.
Eq. (1) written in another form was put forward by Prud- Subsequently, the TFC model was extended [83,84] (i) to
nikov [74] who addressed statistically one-dimensional, yield a fully developed flame with a stationary thickness dT at
planar premixed flames propagating in frozen turbulence. In large flame development time, i.e. tfd =tT /∞, and to address
the same simplified case, Eq. (1) was later derived by Lipatni- (ii) an earlier stage of flame development, i.e. tfd < tT , and (iii)
kov and Chomiak [75] who studied a developing premixed
the case of u0 =SL < 1. When simulating the Atlanta experi-
turbulent flame with self-similar mean structure, as the self-
ments studied in the present work, both the TFC model and its
similarity of the mean structure of developing premixed tur-
extension known as Flame Speed Closure (FSC) model yield
bulent flames was well documented in various experiments,
close results, as in earlier simulations [70] of other confined
as reviewed elsewhere [35,65,74,76,77]. Eq. (1) is applicable to
Bunsen flames investigated experimentally in PSI [28,29].
modeling premixed turbulent combustion in an intermedi-
Accordingly, the TFC model is adopted in the present work,
ately asymptotic regime that is characterized by a stationary
because its joint use with the leading point concept requires a
(to the leading order) turbulent burning velocity UT but
single simple change: the unperturbed laminar flame speed SL
growing mean flame brush thickness dT . Such a regime of9228 i n t e r n a t i o n a l j o u r n a l o f h y d r o g e n e n e r g y 4 6 ( 2 0 2 1 ) 9 2 2 2 e9 2 3 3
in Eq. (3) should be substituted with the peak consumption In our earlier tests [70,71] of the TFC and FSC models, the
velocity Smax
c obtained from the critically strained laminar issue of simulating turbulence in premixed flames was
flame and reported in Table 1. Thus, in the present work, Eq. partially circumvented in the following way. For each set of
(3) is substituted with simulated experiments, (i) a single reference case was chosen,
(ii) several turbulence models and relevant inlet boundary
1=4 max 1=2 max 1=2
LS2L Sc S conditions were probed to get the best agreement with data
UT ¼ Au0 ¼ Au0 Da1=4 c ; (4)
u0 au SL SL measured in that single case, and (iii) the best model and
boundary conditions were subsequently used to explore other
where a factor of ðSmax
c =SL Þ1=2 is constant within any premixed
experiments from the studied set. Note that the single con-
turbulent flame and can be pre-computed by adopting a
stant A of the TFC or FSC model was not tuned in Refs. [70,71].
detailed chemical mechanism, see Table 1. In a similar simple
The same method could also be used in the present work,
way, the leading point concept can be coupled with most
but because its focus was placed on the influence of H2/CO/air
models of premixed turbulent combustion used not only in
mixture composition and pressure on turbulent burning ve-
RANS computations, but also in Large Eddy Simulations (LES).
locity, a simpler and less expensive solution was taken. More
It is worth stressing that the consumption velocity Sc
specifically, the well-known k ε model of turbulence [89],
characterizes burning rate in a perturbed laminar premixed
extended based on the Rapid Distortion Theory [90], was
flame much better than a displacement speed Sd does. The
adopted. The model involves the following two transport
latter quantity is well known to be sensitive to the choice
equations
of an iso-scalar surface associated with the flame surface
[39,40]. For instance, under certain conditions ru SL can be
v ~ v n vk~ ~
00 00 vuj
larger (smaller) than rSd for one (another) iso-scalar surface ðrkÞ þ ~k k~ ¼ V , r T
ru rug
j uk r~ε; (6)
vt vxk sk vxk vxk
within the same flame [39,40]. Moreover, a flame ball [33] is
characterized by Sd ¼ 0 for any iso-scalar surface, whereas
v v n v~ε ~j
~ε 00 00 vu ~ε2
the local burning rate per unit ball-surface area can be very ðr~εÞ þ ~k ~ε ¼ V , r T
ru Cε;1 r ug uk Cε;2 r
vt vxk sε vxk k~ vxk k~
j
high, i.e. Sc [SL , in a very lean hydrogen-air mixture. ~k
vu
Therefore, the peak consumption velocity Smax appears to þ Cε;3 r~ε (7)
c vxk
be better suited for characterizing the local burning rate
for the Favre-averaged turbulent kinetic energy k~ ¼ ug
00 00
in the leading points when compared to a displacement k uk =2 and
speed. its dissipation rate ~ε. Here,
Finally, to allow for entrainment of surrounding air into a
k~
2
conical flame, the following well-known transport equation
nT ¼ Cm (8)
~ε
v ~
~ f~Þ ¼ V,ðrDT Vf~Þ
ðrf Þ þ V , ðru (5) is kinematic turbulent viscosity, sk ¼ 1:0, sε ¼ 1:3Cm ¼ 0:09,
vt
Cε;1 ¼ 1:44, and Cε;2 ¼ 1:92 are standard constants of the k ε
for the Favre-averaged mixture fraction f~ [44e46] was model [89], Cε;3 ¼ 1=3 [90,91], and the summation convention
numerically integrated, with Da in Eq. (4) being evaluated by applies to repeated indexes.
substituting the obtained field f~ðxÞ into the dependence of SL ðf ; The inlet boundary conditions are set as follows
H2 =CO; PÞ, pre-computed for the unperturbed laminar flames
k~
3=2
using CHEMKIN-II [58] and the detailed chemical mechanism u03 3
~ε ¼ Cd ¼ C0d ; k~ ¼ u02 ; (9)
by Goswami et al. [60]. These simulations also yielded L L 2
rb ðf ; H2 =CO; PÞ required to calculate the mean density adopt- where Cd ¼ 0:3 if C0d ¼ C3=4 and Cm ¼ 0:09. These values are
m
ing the BML Eq. (2). default values in various CFD codes. The rms velocity
qffiffiffiffiffiffiffiffiffiffiffiffiffiffiffiffiffiffiffiffiffiffiffiffiffiffiffiffiffiffiffi
pffiffiffi
Turbulence model (u0tot ≡ u0 2 þ v0 2 þ w0 2 ¼ 3u0 ) and length scale L are reported in
Modeling turbulence in a premixed flame still challenges the Figs. 10 and 13, respectively, in Ref. [64]. The turbulent diffu-
research community, with even characterization of turbu- sivity is evaluated as follows
lence in a flame being an issue [85]. As reviewed elsewhere
Cm k~
2
[86,87], a number of local phenomena associated with the DT ¼ ; (10)
influence of thermal expansion on turbulence in a flame have ScT ~ε
been found in recent studies. Nevertheless, majority of these with ScT ¼ 0:7 [67].
phenomena are not addressed by turbulence models used in
RANS CFD research into premixed combustion. The use of LES Numerical setup
does not resolve the problem either, because flame- Unsteady numerical simulations were performed by using a
turbulence interaction is mainly localized to small scales significantly modified version of the XiFoam solver in the
that are not resolved in a typical LES [88]. Even if the discussed OpenFOAM CFD library [92] until a stationary solution was
thermal expansion effects could be of less importance in reached. The computational domain was two-dimensional in
highly turbulent premixed flames, predictive capabilities of the cylindrical coordinate framework. The domain began at
available turbulence models have to be documented in such x ¼ 2D, the inlet was placed at x ¼ 0, and the domain size
flames. However, this task has yet been rarely (if ever) downstream of the inlet was equal to 25D 5D. In a few
addressed. representative cases, very similar results were obtained fromi n t e r n a t i o n a l j o u r n a l o f h y d r o g e n e n e r g y 4 6 ( 2 0 2 1 ) 9 2 2 2 e9 2 3 3 9229
a bigger computational domain of size 50D 10D downstream
of the inlet. The numerical mesh consisted of approximately m_
UT ¼ ; (11)
140 000 cells and had the smallest steps in the axial and radial ru Af
directions equal to Dx ¼ 0:5 mm and Dr ¼ 0:25 mm, respec-
tively. The steps were kept constant in the zone x < 10D and qffiffiffiffiffiffiffiffiffiffiffiffiffiffiffiffiffi
Af ¼ pR R2 þ H2f ; (12)
r < 2D and were then gradually increased with both the radial
and axial distances from the nozzle exit, see Fig. 4. In a few where m_ is the inlet mass flow rate, Af is the area of the side
representative cases, very similar results were computed surface of the mean flame cone, R ¼ D=2 is the nozzle radius,
using a finer mesh of approximately 320 000 cells with the and the mean flame height Hf is calculated using the
minimum Dx ¼ 0:334 mm and Dr ¼ 0:167 mm. constraint of cðr ¼ 0; x ¼ Hf Þ ¼ 0:5.
Boundary conditions were set using options offered by
Contrary to the earlier tests [70,71] of the TFC and FSC
the OpenFOAM library at different boundaries marked in
models, the constant A in Eq. (4) was tuned here. More spe-
Fig. 4. The conditions are summarized in Table 4 adopting
cifically, it was tuned in a single reference case (30% H2, F ¼
names accepted in the OpenFOAM library. In the experi-
0:61, and P ¼ 1 atm). Other flames were simulated by retaining
ments, a pilot methane-air flame was used, “with the total
the same values of all constants (A, sk , sε , Cε;1 , Cε;2 , Cm , Cd , and
mass flow rate of the pilot” being less than “5% of the main flow
ScT ). The tuned value of A ¼ 0:66 is larger than the recom-
rate” [30]. However, the pilot-flame composition, mean inlet
mended value of A ¼ 0:5. This tuned value could be reduced
velocity, and pilot slot, burner rim, and pilot rim widths are
by decreasing Cd and/or ScT , but such exercises were beyond
not reported in Refs. [30,31,64]. In the present simulations,
the scope of the present work. The discussed simplifications
(i) the mean inlet velocity of the pilot flow was equal to U= 2,
(the use of a default turbulence model with default boundary
(ii) f~ was the same in the major flow of unburned reactants conditions and tuning the TFC constant A in a single reference
and in the pilot flow of combustion products, (iii) ~c ¼ 0 and 1 case associated with the minimum amount of H2 in the fuel
in the two flows, respectively, (iv) the pilot slot thickness blend) appear to be fully adequate for the major goal of the
was equal to 2 mm, whereas thickness of wall 2 was equal to present study, which consists in assessing the capabilities of
1 mm. In a single representative case, either the pilot slot the TFC model combined with the leading point concept, i.e.
width or the mean inlet velocity was decreased by a factor of Eq. (4), for predicting a substantial increase in turbulent
two independently from one another, but the computed burning velocity with increasing H2/CO ratio by retaining the
turbulent burning velocities were almost the same in these same SL . It is worth stressing that such data measured by
test cases. Venkateswaran et al. [30,31] still challenge the combustion
CFD community and the present authors are not aware on a
Target of simulations work where these experimental data are predicted in RANS
computations or LES.
In line with the experimental study, e.g. see Fig. 13b in
Ref. [30], a bulk turbulent burning velocity is evaluated as
follows Results and discussion
A typical image of the computed field of the Favre-averaged
temperature is shown in Fig. 5. The image looks similar to
the experimental images, e.g. see Fig. 13b in Ref. [30]. Note that
while the flame shape is not conical in the two aforemen-
tioned figures, Eqs. (11) and (12) were used in the present
paper, because the same method was adopted to measure UT
[30].
Results of validation of the leading point concept combined
with the TFC model, i.e. Eq. (4), are summarized in Figs. 6 and
7, where open symbols show simulated results and filled
symbols show experimental data by Venkateswaran et al.
[30,31]. More specifically, Fig. 6 aims at assessing the capability
of the model to predict dependencies of UT yielded by Eq. (11)
on the equivalence ratio in lean flames with H2/CO ¼ 30/70
(diamonds and squares) or H2/CO ¼ 60/40 (circles and tri-
angles) at two different values of the inlet velocity U ¼ 30 m/s
(squares and triangles) or 50 m/s (diamonds and circles). The
corresponding values of u0 are about 3.5 ad 6.8 m/s, respec-
Fig. 4 e Computational mesh and boundary conditions. To
tively, i.e., significantly larger than the laminar flame speeds
improve readability of the figure, the number of shown grid
reported in Table 2. Note that (i) the laminar flame speeds are
points is decreased by a factor of four in both axial and
different for different mixtures plotted in Fig. 6 and (ii) open
radial direction. 1 e major flow inlet; 2 e rim; 3 e pilot flow;
diamond and open square at F ¼ 0:61 show results computed
4 e burner wall; 5 e entrainment boundaries; 6 e outlet
by tuning A, i.e. increasing it to 0.66. Other computed results
boundary.9230 i n t e r n a t i o n a l j o u r n a l o f h y d r o g e n e n e r g y 4 6 ( 2 0 2 1 ) 9 2 2 2 e9 2 3 3
Table 4 e Boundary conditions.
N boundary ~
u p ~c or f~ k~ ~ε
1 inlet fixedValue zeroGradient fixedValue fixedValue fixedValue
2 rim fixedValue zeroGradient zeroGradient zeroGradient zeroGradient
3 pilot fixedValue zeroGradient fixedValue fixedValue fixedValue
4 wall fixedValue zeroGradient zeroGradient compressible:: compressible::
kqRWallFunction epsilonWallFunction
5 entrainment zeroGradient zeroGradient zeroGradient zeroGradient zeroGradient
6 outlet zeroGradient totalPressure zeroGradient zeroGradient zeroGradient
Fig. 5 e Field of the Favre-averaged temperature computed
at P ¼ 1 atm, D ¼ 20 mm, U ¼ 50 m/s, H2/CO ¼ 60/40, F ¼
0:4.
Fig. 7 e Dependence of the normalized consumption
velocity UT =SL on the amount of hydrogen in the fuel blend.
Open and filled symbols show computed results and data
measured by Venkateswaran et al. [30,31]. 1 e U ¼ 50 m/s,
D ¼ 20 mm, P ¼ 1 atm; 2 e U ¼ 50 m/s, D ¼ 12 mm, P ¼ 1
atm; 3 e U ¼ 50 m/s, D ¼ 12 mm, P ¼ 5 atm; 4 e U ¼ 30 m/s,
D ¼ 20 mm, P ¼ 1 atm; 5 e U ¼ 30 m/s, D ¼ 12 mm, P ¼ 1
atm; 6 e U ¼ 30 m/s, D ¼ 12 mm, P ¼ 5 atm; 7 e U ¼ 30 m/s,
D ¼ 12 mm, P ¼ 10 atm. Other conditions are specified in
Table 3.
Fig. 7 aims at assessing the capability of the tested model
for predicting a significant (by a factor up to 1.5) increase in
UT when increasing the H2/CO ratio, but retaining the same
value of SL ¼ 0:34 m/s [30]. This experimental finding chal-
lenges state-of-the-art models of premixed turbulent com-
Fig. 6 e Dependence of the normalized consumption
bustion. The studied cases cover two different U ¼ 30 and
velocity UT =SL on the equivalence ratio F. Open and filled
50 m/s, two different nozzle diameters (and, hence, two
symbols show computed results and data measured by
significantly different integral length scales of the turbu-
Venkateswaran et al. [30,31]. 1e30% H2, U ¼ 50 m/s, D ¼ 20
lence), three different pressures P ¼ 1, 5, and 10 atm, and
mm, P ¼ 1 atm; 2e30% H2, U ¼ 30 m/s, D ¼ 20 mm, P ¼ 1
0:48 F 0:75, see Table 3. All in all, the obtained agreement
atm; 3e60% H2, U ¼ 50 m/s, D ¼ 20 mm, P ¼ 1 atm; 4e60%
between the measured and computed turbulent burning ve-
H2, U ¼ 30 m/s, D ¼ 20 mm, P ¼ 1 atm.
locities is encouraging. The worst agreement is observed in
the cases of (i) H2/CO ¼ 30/70, U ¼ 50 m/s, P ¼ 1 atm, D ¼ 12
mm, cf. filled and open squares, (ii) H2/CO ¼ 70/30, U ¼ 30
reported in Fig. 6 have been obtained without additional
m/s, D ¼ 20 mm, P ¼ 1 atm, cf. filled and open up-pointing
tuning, i.e. A ¼ 0:66 in all cases. Fig. 6 quantitatively validates
triangles, and (iii) H2/CO ¼ 90/10, U ¼ 30 m/s, D ¼ 20 mm, P ¼
the model in all cases with the exception of a single case of H2/
1 atm, cf. filled and open up-pointing triangles. In these three
CO ¼ 60/40, U ¼ 30 m/s, and F ¼ 0:4, cf. open and filled tri-
cases, the model overestimates, see (i), or underestimates,
angles. In this single case, the model significantly (about 25%)
see (ii) and (iii), UT by 20e25% approximately. In other 20
underestimates the measured burning velocity and the rea-
cases, including all high-pressure cases, the measured and
sons for this are unclear.
computed results appear to agree sufficiently well. It is worthi n t e r n a t i o n a l j o u r n a l o f h y d r o g e n e n e r g y 4 6 ( 2 0 2 1 ) 9 2 2 2 e9 2 3 3 9231
stressing that the same value of A ¼ 0:66 was used in all grateful to Dr. Venkateswaran and Prof. Lieuwen for providing
these simulations. Therefore, the significant effect of the H2/ their experimental data.
CO ratio on UT is predicted due to the use of the term
ðSmax =SL Þ1=2 in Eq. (4), based on the leading point concept.
c
references
Bearing in mind the wide range of the studied mixture
compositions and pressures, results reported in Figs. 6 and 7
indicate that the tested approach, i.e. the leading point
[1] Verhelst S, Wallner T. Hydrogen-fueled internal combustion
concept combined with the TFC model, in particular Eq. (4), is engines. Prog Energy Combust Sci 2009;35:490e527.
capable for predicting well-pronounced diffusional-thermal [2] Dinkelacker F, Manickam B, Muppala SPR. Modelling and
effects in lean highly turbulent syngas-air flames. Accord- simulation of lean premixed turbulent methane/hydrogen/
ingly, Eq. (4) may be recommended for CFD research into air flames with an effective Lewis number approach.
turbulent burning of lean syngas-air mixtures, with this Combust Flame 2011;158:1742e9.
[3] Xie Y, Sun ZY. Effects of the external turbulence on centrally-
equation being compatible not only with various RANS, but
ignited spherical unstable CH4/H2/air flames in the constant-
also with various LES models of the influence of turbulence
volume combustion bomb. Int J Hydrogen Energy
on premixed combustion. 2019;44:20452e61.
[4] Akansu SO, Dulger Z, Kahraman N, Veziroglu TN. Internal
combustion engines fueled by natural gas-hydrogen
Conclusions mixtures. Int J Hydrogen Energy 2004;29:1527e39.
[5] Hu EJ, Huang ZH, Liu B, Zheng JJ, Gu XL. Experimental study
on combustion characteristics of a spark-ignition engine
The Turbulent Flame Closure (TFC) model of the influence of
fueled with natural gas-hydrogen blends combining with
turbulence on premixed burning was combined with the
EGR. Int J Hydrogen Energy 2009;34:1035e44.
leading point concept in order to allow for diffusional- [6] Ma FH, Wang YF, Ding SF, Jiang L. Twenty percent hydrogen-
thermal effects in premixed turbulent flames. The com- enriched natural gas transient performance research. Int J
bined model was tested in RANS simulations of highly tur- Hydrogen Energy 2009;34:6523e31.
bulent, lean syngas-air flames that were experimentally [7] Zhang M, Chang M, Wang J, Huang Z. Flame dynamics
investigated by Venkateswaran et al. [30,31]. The tests were analysis of highly hydrogen-enrichment premixed turbulent
combustion. Int J Hydrogen Energy 2020;45(1):1072e83.
performed for four different values of the inlet rms turbulent
[8] Aravind B, Kishore VR, Mohammad A. Combustion
velocity u0 , different turbulence length scales L, normal and characteristics of the effect of hydrogen addition on LPG-air
elevated (up to 10 atm) pressures, various H2/CO ratios mixtures. Int J Hydrogen Energy 2015;40:16605e17.
ranging from 30/70 to 90/10, and various equivalence ratios [9] Pan W, Liu D. Effects of hydrogen additions on premixed rich
0:40 F 0:80. In 28 of the studied 33 cases, including all flames of four butanol isomers. Int J Hydrogen Energy
high-pressure flames, the computed bulk turbulent con- 2017;42(6):3833e41.
sumption velocities agree quantitatively with the experi- [10] Yu X, Li G, Du Y, Guo Z, Shang Z, He F, Shen Q, Li D, Li Y. A
comparative study on effects of homogeneous or stratified
mental data, with these results being obtained using the
hydrogen on combustion and emissions of a gasoline/
same value of a single constant of the tested approach. In five hydrogen SI engine. Int J Hydrogen Energy 2019;44:25974e84.
other cases, differences are about 20e25%. All in all, the [11] Montoya JPG, Amell A, Olsen DB, Diaz GJA. Strategies to
performed tests indicate that the studied combination of the improve the performance of a spark ignition engine using
leading point concept and the TFC model, in particular Eq. (4), fuel blends of biogas with natural gas, propane and
is capable for predicting well-pronounced diffusional-ther- hydrogen. Int J Hydrogen Energy 2018;43:21592e602.
[12] Hu Z, Zhang X. Experimental study on flame stability of
mal effects in lean highly turbulent syngas-air flames. For
biogas/hydrogen combustion. Int J Hydrogen Energy
instance, the combined model well predicts a significant in-
2019;44:5607e14.
crease in the bulk turbulent consumption velocity when [13] Wei Z, He Z, Zhen H, Zhang X, Chen Z, Huang Z. Kinetic
increasing the H2/CO ratio but retaining the same value of the modeling investigation on the coupling effects of H2 and CO2
laminar flame speed. addition on the laminar flame speed of hydrogen enriched
biogas mixture. Int J Hydrogen Energy 2020;45(51):27891e903.
https://doi.org/10.1016/j.ijhydene.2020.07.119.
[14] Richards GA, Casleton KH. Gasification technology to
Declaration of competing interest
produce synthesis gas. In: Lieuwen TC, Yang V, Yetter RA,
editors. Synthesis gas combustion: fundamentals and
The authors declare that they have no known competing applications. CRC Press; 2009. p. 1e28.
financial interests or personal relationships that could have [15] Tahtouh T, Halter F, Mounaı̈m-Rousselle C. Laminar
appeared to influence the work reported in this paper. premixed flame characteristics of hydrogen blended
isooctane-air-nitrogen mixtures. Int J Hydrogen Energy
2011;36(1):985e91.
[16] Varghese RJ, Kumar S. Machine learning model to predict the
Acknowledgements laminar burning velocities of H2/CO/CH4/CO2/N2/air mixtures
at high pressure and temperature conditions. Int J Hydrogen
SV gratefully acknowledges the support from Prof. Arnaud Energy 2020;45(4):3216e32.
(University of Maryland, College Park) and Dr. Michael [17] Jithin EV, Varghese RJ, Velamati RK. Experimental and
Trouve
numerical investigation on the effect of hydrogen addition
Henneke (John Zink Company, LLC). AL gratefully acknowl-
and N2/CO2 dilution on laminar burning velocity of methane/
edges the financial support provided by CERC. The authors are oxygen mixtures. Int J Hydrogen Energy 2020;45:16838e50.9232 i n t e r n a t i o n a l j o u r n a l o f h y d r o g e n e n e r g y 4 6 ( 2 0 2 1 ) 9 2 2 2 e9 2 3 3
[18] Nakahara M, Kido H. Study on the turbulent burning velocity hydrogen-air flames: coupling experimental and
of hydrogen mixtures including hydrocarbon. AIAA J computational analysis at the laboratory scale. J Phys Conf
2008;46:1569e75. Series 2009;180:012031.
[19] Muppala SPR, Nakahara M, Aluri NK, Kido H, Wen JX, [37] Clavin P. Dynamical behavior of premixed flame fronts in
Papalexandris MV. Experimental and analytical investigation laminar and turbulent flows. Prog Energy Combust Sci
of the turbulent burning velocity of two-component fuel 1985;11:1e59.
mixtures of hydrogen, methane and propane. Int J Hydrogen [38] Matalon M. Intrinsic flame instabilities in premixed and
Energy 2009;34:9258e65. nonpremixed combustion. Annu Rev Fluid Mech
[20] Chiu CW, Dong YC, Shy SS. High-pressure hydrogen/carbon 2007;39:163e91.
monoxide syngas turbulent burning velocities measured at [39] Giannakopoulos GK, Gatzoulis A, Frouzakis CE, Matalon M,
constant turbulent Reynolds numbers. Int J Hydrogen Energy Tomboulides AG. Consistent definitions of “flame
2012;37(14):10935e46. displacement speed” and “Markstein length” for premixed
[21] Mansouri Z, Aouissi M, Boushaki T. Numerical computations flame propagation. Combust Flame 2015;162:1249e64.
of premixed propane flame in a swirl-stabilized burner: [40] Lipatnikov AN. Some issues of using Markstein number for
effects of hydrogen enrichment, swirl number and modeling premixed turbulent combustion. Combust Sci
equivalence ratio on flame characteristics. Int J Hydrogen Technol 1996;119:131e54.
Energy 2016;41(22):9664e78. [41] Bradley D, Gaskell PH, Gu XJ, Sedaghat A. Premixed flamelet
[22] Ranga Dinesh KKJ, Shalaby H, Luo KH, van Oijen JA, modelling: factors influencing the turbulent heat release rate
Thevenin D. High hydrogen content syngas fuel burning in source term and the turbulent burning velocity. Combust
lean premixed spherical flames at elevated pressures: effects Flame 2005;143:227e45.
of preferential diffusion. Int J Hydrogen Energy [42] Karpov VP, Lipatnikov AN, Zimont VL. A test of an
2016;41(40):18231e49. engineering model of premixed turbulent combustion. Proc
[23] Cecere D, Giacomazzi E, Arcidiacono NM, Picchia FR. Direct Combust Inst 1996;26:249e57.
numerical simulation of high pressure turbulent lean [43] Karpov VP, Severin ES. Effects of molecular-transport
premixed CH4/H2-air slot flames. Int J Hydrogen Energy coefficients on the rate of turbulent combustion. Combust
2018;43(10):5184e98. Explos Shock Waves 1980;16:41e6.
[24] Zhang GP, Li GX, Li HM, Jiang YH, Lv JC. Experimental [44] Peters N. Turbulent combustion. Cambridge University Press;
investigation on the self-acceleration of 10%H2/90%CO/air 2000.
turbulent expanding premixed flame. Int J Hydrogen Energy [45] Poinsot T, Veynante D. Theoretical and numerical
2019;44:24321e30. combustion. Edwards. 2nd ed. 2005.
[25] Huang K, Sun ZY, Tian YC, Wang KL. Turbulent combustion [46] Bilger RW, Pope SB, Bray KNC, Driscoll JF. Paradigms in
evolution of stoichiometric H2/CH4/air mixtures within a turbulent combustion research. Proc Combust Inst
spherical space. Int J Hydrogen Energy 2020;45:10613e22. 2005;30:21e42.
[26] Lipatnikov AN, Chomiak J. Molecular transport effects on [47] Chakraborty N, Champion M, Mura A, Swaminathan N.
turbulent flame propagation and structure. Prog Energy Scalar-dissipation-rate approach [Chapter 4]. In:
Combust Sci 2005;31(1):1e73. Swaminathan N, Bray KNC, editors. Turbulent premixed
[27] Yang S, Saha A, Liang W, Wu F, Law CK. Extreme role of flames. Cambridge University Press; 2011. p. 74e102.
preferential diffusion in turbulent flame propagation. [48] Karpov VP, Lipatnikov AN, Zimont VL. Flame curvature as a
Combust Flame 2018;188:498e504. determinant of preferential diffusion effects in premixed
[28] Daniele S, Jansohn P, Mantzaras J, Boulouchos K. Turbulent turbulent combustion [chapter 14]. In: Sirignano WA,
flame speed for syngas at gas turbine relevant conditions. Merzhanov AG, de Luca L, editors. Advances in combustion
Proc Combust Inst 2011;33:2937e44. science: in honor of ya.B. Zel’dovich. vol. 173. Prog Astronaut
[29] Daniele S, Mantzaras J, Jansohn P, Denisov A, Boulouchos K. Aeronautics; 1996. p. 235e50.
Flame front/turbulence interaction for syngas fuels in the [49] Lipatnikov AN, Chomiak J. Lewis number effects in premixed
thin reaction zones regime: turbulent and stretched laminar turbulent combustion and highly perturbed laminar flames.
flame speeds at elevated pressures and temperatures. J Fluid Combust Sci Technol 1998;137:277e98.
Mech 2013;724:36e68. [50] Sabelnikov VA, Lipatnikov AN. Transition from pulled to
[30] Venkateswaran P, Marshall A, Shin DH, Noble D, Seitzman J, pushed premixed turbulent flames due to countergradient
Lieuwen T. Measurements and analysis of turbulent transport. Combust Theor Model 2013;17:1154e75.
consumption speeds of H2/CO mixtures. Combust Flame [51] Sabelnikov VA, Lipatnikov AN. Transition from pulled to
2011;158:1602e14. pushed fronts in premixed turbulent combustion: theoretical
[31] Venkateswaran P, Marshall A, Seitzman J, Lieuwen T. and numerical study. Combust Flame 2015;162:2893e903.
Pressure and fuel effects on turbulent consumption speeds [52] Kha KQN, Robin V, Mura A, Champion M. Implications of
of H2/CO blends. Proc Combust Inst 2013;34:1527e35. laminar flame finite thickness on the structure of turbulent
[32] Zhang W, Wang J, Yu Q, Jin W, Zhang M, Huang Z. premixed flames. J Fluid Mech 2016;787:116e47.
Investigation of the fuel effects on burning velocity and [53] Kim SH. Leading points and heat release effects in turbulent
flame structure of turbulent premixed flames based on premixed flames. Proc Combust Inst 2017;36:2017e24.
leading points concept. Combust Sci Technol [54] Dave HL, Mohan A, Chaudhuri S. Genesis and evolution of
2018;190:1354e76. premixed flames in turbulence. Combust Flame
[33] Zel’dovich YaB, Barenblatt GI, Librovich VB, Makhviladze GM. 2018;196:386e99.
The mathematical theory of combustion and explosions. [55] Lipatnikov AN, Chakraborty N, Sabelnikov VA. Transport
Consultants Bureau; 1985. equations for reaction rate in laminar and turbulent
[34] Kuznetsov VR, Sabelnikov VA. Turbulence and combustion. premixed flames characterized by non-unity Lewis number.
Hemisphere; 1990. Int J Hydrogen Energy 2018;43(45):21060e9.
[35] Lipatnikov AN. Fundamentals of premixed turbulent [56] Kee R, Miller J, Evans G, Dixon-Lewis G. A computational
combustion. CRC Press; 2012. model of the structure and extinction of strained, opposed
[36] Day MS, Bell JB, Cheng RK, Tachibana S, Beckner VE, flow, premixed methane-air flames. Proc Combust Inst
Lijewski MJ. Cellular burning in lean premixed turbulent 1989;22:1479e94.You can also read