Visible and near-infrared observations of interstellar comet 2I/Borisov with the 10.4-m GTC and the 3.6-m TNG telescopes
←
→
Page content transcription
If your browser does not render page correctly, please read the page content below
MNRAS 000, 1–10 (2020)                             Preprint 5 May 2020             Compiled using MNRAS LATEX style file v3.0

                                              Visible and near-infrared observations of interstellar comet
                                              2I/Borisov with the 10.4-m GTC and the 3.6-m TNG
                                              telescopes

                                              J. de León,1,2? J. Licandro,1,2 C. de la Fuente Marcos,3 R. de la Fuente Marcos,4
                                              L. M. Lara,5 F. Moreno,5 N. Pinilla-Alonso,6 M. Serra-Ricart,1,2 M. De Prá,6
                                              G.P. Tozzi,7 A. C. Souza-Feliciano,6,8 M. Popescu,9 R. Scarpa,10,1 J. Font Serra,10,1
arXiv:2005.00786v1 [astro-ph.EP] 2 May 2020

                                              S.
                                              1
                                                 Geier,10,1 V. Lorenzi,11,1 A. Harutyunyan,11 A. Cabrera-Lavers10,1
                                                Instituto de Astrofı́sica de Canarias (IAC), C/Vı́a Láctea s/n, E-38205, La Laguna, Spain
                                              2 Departamento   de Astrofı́sica (ULL), E-38205, La Laguna, Spain
                                              3 Universidad Complutense de Madrid, Ciudad Universitaria, E-28040 Madrid, Spain
                                              4 AEGORA Research Group, Facultad de Ciencias Matemáticas, Universidad Complutense de Madrid, Ciudad Universitaria,

                                              E-28040 Madrid, Spain
                                              5 Instituto de Astrofı́sica de Andalucı́a - CSIC, Glorieta de la Astronomı́a s/n, E-18008, Granada, Spain
                                              6 Florida Space Institute, 12354 Research Parkway Partnership 1 Building, Suite 214 Orlando, FL 32826-0650, USA
                                              7 Osservatorio Astrofisico di Arcetri, INAF, Lago E. Femi 6, I-50125, Firenze, Italy
                                              8 Observatório Nacional, Rio de Janeiro, 20921-400, Brazil
                                              9 Astronomical Institute of the Romanian Academy, 5 Cutitul de Argint, 040557 Bucharest, Romania
                                                                                                          ,
                                              10 GRANTECAN, Cuesta de San José s/n, E-38712 Breña Baja, La Palma, Spain
                                              11 Fundación Galileo Galilei - INAF, Rambla José Ana Fernández Pérez 7, E-38712 Breña Baja, La Palma, Spain

                                              Accepted XXX. Received YYY; in original form ZZZ

                                                                              ABSTRACT
                                                                              In this work, we present the results of an observational study of 2I/Borisov carried out
                                                                              with the 10.4-m Gran Telescopio Canarias (GTC) and the 3.6-m Telescopio Nazionale
                                                                              Galileo (TNG), both telescopes located at the Roque de Los Muchachos Observatory,
                                                                              in the island of La Palma (Spain). The study includes images in the visible and near-
                                                                              infrared, as well as visible spectra in the 3600 – 9200 Å wavelength range. N-body
                                                                              simulations were also performed to explore its orbital evolution and Galactic kinematic
                                                                              context. The comet’s dust continuum and near-infrared colours are compatible with
                                                                              those observed for Solar system comets. From its visible spectrum on the nights of 2019,
                                                                              September 24 and 26 we measured CN gas production rates Q(CN) = (2.3 ± 0.4) ×
                                                                              1024 mol s−1 and Q(CN) = (9.5 ± 0.2) × 1024 mol s−1 , respectively, in agreement with
                                                                              measurements reported by other authors on similar nights. We also obtained an upper
                                                                              limit for the C2 production rate of Q(C2 ) < (4.5 ± 0.1) × 1024 mol s−1 . Dust modelling
                                                                              results indicate a moderate dust production rate of ∼50 kg s−1 at heliocentric distance
                                                                              rh =2.6 au, with a differential power-law dust size distribution of index ∼ –3.4, within
                                                                              the range reported for many comet comae. Our simulations show that the Galactic
                                                                              velocity of 2I/Borisov matches well that of known stars in the solar neighbourhood
                                                                              and also those of more distant regions of the Galactic disc.
                                                                              Key words: comets: individual: 2I/Borisov – methods: observational – techniques:
                                                                              imaging spectroscopy – methods: numerical

                                                                                                               1   INTRODUCTION

                                                                                                               Until recently, the lack of detections of interstellar comets
                                                                                                               posed a problem to the theories of planet and comet for-
                                              ?   E-mail: jmlc@iac.es                                          mation (see e.g. McGlynn & Chapman 1989). The discovery

                                              © 2020 The Authors
2 J. de León et al.
rate of such comets could be used to estimate the fraction 2000; Cepa 2010), at the 10.4-m Gran Telescopio Canarias
of stars with planets (Stern 1990) and the absence of detec- (GTC), and near-infrared images on 2019, September 24 us-
tions could be regarded as natural (Sen & Rana 1993), but ing the NICS camera-spectrograph (Baffa et al. 2001) at the
also as resulting from technical limitations (Engelhardt et al. 3.6-m Telescopio Nazionale Galileo (TNG). Both telescopes
2014; Cook et al. 2016). The discovery of the first interstel- are located at the Roque de Los Muchachos Observatory
lar minor body, 1I/2017 U1 (‘Oumuamua), that was rather (ORM), in the island of La Palma (Canary Islands, Spain).
small and lacked clear signs of cometary activity (see e.g. Observational details are shown in Table 2.
’Oumuamua ISSI Team et al. 2019) could neither provide
a conclusive answer to the issue of how numerous interstel-
lar comets are, nor fully support standard theories of planet 2.1 Visible and near-infrared images
and comet formation. The discovery and study of additional
The OSIRIS detector is a mosaic of two Marconi 2048×4096
interstellar minor bodies may provide us with the frame-
pixel CCDs. The total unvignetted field of view is 7.8×7.8
work required to understand whether and to what extent
arcminutes, and the plate scale is 0.127 ”/pix. Standard
‘Oumuamua is a typical member of this dynamical class or
operation mode consists of a 2×2 binning, with a readout
perhaps an outlier.
speed of 200 kHz (with a gain of 0.95 e-/ADU and a read-
Comet C/2019 Q4 was discovered as gb00234 by G.
out noise of 4.5 e-). On the 3 nights of 2019 September we
Borisov on 2019, August 30, observing from MARGO (Mo-
obtained individual images using the Sloan r’ filter and an
bile Astronomical Robotics Genon Observatory), Nauchnij,
exposure time of 30 seconds, with the telescope tracking at
in the Crimean peninsula.1 It was found at a solar elon-
the comet’s proper motion. The target was visible only at
gation of just 38◦ when the object was moving inbound at
low elevation (about 25◦ above local horizon) and during the
about 3 au from the Sun, and it was soon identified as hav-
twilight, therefore observations were extremely challenging.
ing a hyperbolic orbit, being officially named as 2I/Borisov
Four images were obtained on the night of September 13,
by the IAU on 2019, September 24:2 this is only the second
at an airmass ranging from 2.53 to 2.31. On the nights of
interstellar object known. Table 1 shows the latest orbit de-
September 24 and 26, we acquired two images each night,
termination of 2I/Borisov (as of 2020, April 22), based on
with an airmass of 1.91 and 1.98, respectively. Photometric
1310 observations that span a data-arc of 444 days. Its cur-
data on the three nights were reduced using standard tasks
rent path is hyperbolic with a statistical significance above
in IRAF, following a procedure similar to the one described
155164 σ. Contrary to what happened with 1I/‘Oumuamua,
in Licandro et al. (2019). Images in the Sloan r’ filter were
comet 2I/Borisov was discovered when it was entering the
bias and flat-field corrected (using sky flats), and aperture
Solar system, and so it is observable for at least one year
photometry was computed using a 5” aperture in all cases,
from its discovery. First results from different works showed
which was equivalent to a projected radius of ∼12,000 km
that it presents visible colours, gas and dust production
on the night of Sep. 13, and ∼11,000 km on the nights of
rates, and nuclear properties that are similar to those ob-
Sep. 24 and Sep. 26. Background sky was measured (and
served for Solar system comets (Fitzsimmons et al. 2019;
subsequently subtracted) in a concentric annulus extending
Jewitt & Luu 2019; Opitom et al. 2019; Guzik et al. 2020;
from 10” to 15”. Flux calibration was done using GTC zero-
Jewitt et al. 2020; Kareta et al. 2020; McKay et al. 2020).
points computed for each observing night and provided by
Here, we investigate observationally the cometary activity of
the telescope support astronomer. The images of each ob-
2I/Borisov using images in the visible and the near-infrared,
serving night were aligned on the comet opto-center and
and its spectral properties in the visible region using low-
averaged (see Fig. 1).
resolution spectroscopy. In addition, we use its orbit de-
Broad-band photometry in the near-infrared was per-
termination to explore numerically its dynamical evolution,
formed on the night of September 24 using the NICS camera-
aiming at placing it within its Galactic context. This paper
spectrograph. The plate scale was 0.25”/pix, yielding a field
is organised as follows. In Sect. 2, we describe observations
of view of 4.2×4.2 arcminutes. The series of images used the
and data reduction. In Sect. 3, we analyse the observed coma
standard Johnson J, and H filters and consisted of 10 indi-
and the spectral properties of 2I/Borisov, and compare these
vidual exposures of 60 seconds following a dithering pattern
observational results with those of Solar system comets and
on different positions on the CCD, separated by off-sets of 10
other related populations. In addition, we explore the pre-
pixels. The tracking of the telescope was set at the proper
and post-encounter orbital evolution of 2I/Borisov as well
motion of the target. The comet was observed at an air-
as investigate its Galactic context. Our conclusions are laid
mass of 2.22 for the J filter and 2.02 for the H filter. The
out in Sect. 4.
data were reduced in the standard way using IRAF routines
and all frames were flat-field corrected and sky subtracted.
Standard aperture photometry was done, using an aperture
2 OBSERVATIONS AND DATA REDUCTION of 5”. We observed one field of standard stars for calibra-
tion, AS04-0 FS04 (Persson et al. 1998), using a mosaic of
We obtained low-resolution visible spectra and images of five individual exposures of 5 seconds. The combined images
2I/Borisov on 2019, September 13, 24, and 26, using the in the J and H filters are also shown in Fig. 1.
Optical System for Imaging and Low Resolution Integrated
Spectroscopy (OSIRIS) camera-spectrograph (Cepa et al.
2.2 Visible spectra
1 https://minorplanetcenter.net/mpec/K19/K19RA6.html We obtained two different sets of visible spectra of comet
2 https://minorplanetcenter.net/mpec/K19/K19S72.html 2I/Borisov with OSIRIS at the GTC. The first set, on the
MNRAS 000, 1–10 (2020)Observations of interstellar comet 2I/Borisov 3
Table 1. Heliocentric and barycentric orbital elements and 1 σ uncertainties of interstellar comet 2I/Borisov. This solution is hyperbolic
with a statistical significance of 155164 σ (barycentric) and it is based on 1310 observations that span a data-arc of 444 days. The
orbit determination has been computed by D. Farnocchia at epoch JD 2459061.5 that corresponds to 00:00:00.000 TDB, Barycentric
Dynamical Time, on 2020, July 31, J2000.0 ecliptic and equinox. Source: JPL’s Solar System Dynamics Group Small-Body Database
(SSDG SBDB; solution date, 2020-Mar-19 08:23:45).
Orbital parameter Heliocentric Barycentric
Perihelion distance, q (au) 2.006624 ± 0.000002 2.011869
Eccentricity, e 3.35619 ± 0.00002 3.35881
Inclination, i (◦ ) 44.052626 ± 0.000011 44.062226
Longitude of the ascending node, Ω (◦ ) 308.14892 ± 0.00003 308.10039
Argument of perihelion, ω (◦ ) 209.12461 ± 0.00005 209.16747
Mean anomaly, M (◦ ) 295.277 ± 0.003 294.539
Non-gravitational radial acceleration parameter, A1 (au d−2 ) 7.31 × 10⁻⁸ ± 4.2 × 10⁻⁹
Non-gravitational transverse acceleration parameter, A2 (au d−2 ) –3.3 × 10⁻⁸ ± 1.1 × 10⁻⁸
Figure 1. Images of 2I/Borisov obtained on 2019, September 13, 24, and 26 using the OSIRIS instrument and the Sloan r 0 filter at
the GTC (upper panels). The first image is a composite of four individual images, while the second and the third are composites of two
individual images each. The bottom panels show the images obtained on September 24 using the NICS instrument and the J and H
filters at the TNG. Both images are composite of 10 individual images each. Arrows show the directions of north (N) and east (E), as
well as the projected anti-Solar vector (- ) and the negative of the orbital velocity vector (-V) on each night. The spatial scale is also
included on the first image and it is the same for all of them.
night of September 13, consisted of three individual spec- were finally averaged. Preliminary results of the data ac-
tra of 300 seconds exposure each, using the R300R grism, quired on Sep. 13 were presented in de León et al. (2019).
in combination with a second-order spectral filter. This pro- The second set, obtained on the nights of September 24 and
duced a spectrum in the range 4900 to 9200 Å, with a disper- 26, consisted of another three 300 seconds individual spectra
sion of 7.74 Å/pix for a 0.6” slit width. We used a 1.23” slit, on each night, but this time using the R300B grism, covering
oriented in the parallactic angle in order to minimise losses a wavelength range from 3600 to 7500 Å, and with a disper-
due to atmospheric dispersion, and the telescope tracking sion of 4.96Å/pix for a 0.6” slit. We used 2.52” and 1.23”
was at the comet’s proper motion. We offset the telescope slit widths on Sep. 24 and Sep. 26, respectively, oriented in
10” between spectra in the slit direction to better correct the parallactic angle. We also observed the solar analogue
for fringing and increase the signal-to-noise ratio (SNR). To star SA98-978 from the Landolt catalogue to obtain the re-
correct for telluric absorptions and obtain the relative re- flectance spectra on both nights, using the same procedure
flectance spectrum of the comet, we also observed three G2V described above. The two reflectance spectra (R300R and
stars – SA93-101, SA98-978 and SA115-271 – from the Lan- R300B) are shown in Fig. 2. To compute gas production
dolt catalogue (Landolt 1992), immediately before observing rates of different cometary species, we flux calibrated the
the object, and at similar airmass using the same spectral spectra obtained with the R300B grism on the nights of Sep.
configuration. The spectrum of the comet was divided by 24 and Sep. 26. We only used two out of the three individual
those of the solar analogue stars, and the resulting spectra spectra obtained on each night, discarding the first individ-
MNRAS 000, 1–10 (2020)4 J. de León et al.
2.0
Table 2. Observational circumstances of the data presented in
this work, obtained in 2019 September. Information includes date, 1.8 R300R (Sept-13)
R300B (Sept-24 and Sept-26)
telescope (Tel.), airmass (X), heliocentric (rh ) and geocentric (∆)
Relative Reflectance
1.6
distances, phase angle (α), position angle of the projected anti-
1.4
Solar direction (θ ) an the position angle of the projected nega-
tive heliocentric velocity vector (θ−V ). Orbital values have been 1.2
taken from JPL’s HORIZONS system. 1.0
0.8
Date Tel. X rh ∆ α θ θ−V
(au) (au) (◦ ) (◦ ) (◦ ) 0.6
0.4
13.24 GTC 2.42 2.766 3.406 14.5 298.6 326.8
3600 4400 5200 6000 6800 7600 8400 9200
24.25 GTC 1.91 2.607 3.165 16.7 295.9 328.2
Wavelength (Å)
TNG 2.12
26.24 GTC 1.98 2.579 3.122 17.1 295.5 328.4
Figure 2. Visible reflectance spectrum of comet 2I/Borisov ob-
tained with GTC. The R300R spectrum (red) was obtained on
ual spectra as it presented a lower SNR. In both cases, we the night of 2019, Sep. 13, and presented as a preliminary mea-
used the spectrophotometric standard star G191-B2B. surement in de León et al. (2019). The R300B one (blue) is the
result of averaging the spectra obtained on the nights of 2019,
Sep. 24 and 26, using also GTC. The two spectra are normalised
to unity at 5500 Å.
3 RESULTS AND ANALYSIS
3.1 Nuclear size
behave differently from large ones. On the contrary, we find
Images of comet 2I/Borisov in the visible showed a conspic- both active and non-active small objects among the current
uous comet-like coma and tail, as it can be seen in the upper interstellar sample. Nevertheless, this sample is extremely
panels of Fig. 1. The images in the near-infrared have a lower limited and needs to be significantly enlarged in order to
SNR but still some cometary shape is marginally detected properly compare both populations.
(Fig. 1, lower panels). Apparent magnitudes r 0 = 18.23 ±
0.04, r 0 = 17.68 ± 0.02, and r 0 = 17.62 ± 0.02 were derived
3.2 Dust colours
for the nights of 2019, Sep. 13, 24, and 26, respectively. From
the apparent magnitudes, we derived the absolute magni- The two individual spectra of 2I/Borisov obtained with the
tudes using Eq. (1) from Jewitt & Luu (2019), obtaining R300B (blue) and R300R (red) grisms are shown in Fig. 2,
Hr = 12.72 ± 0.05, Hr = 12.43 ± 0.05, and Hr = 12.41 ± 0.05 and match perfectly in the common wavelength interval, i.e.,
for the nights of Sep. 13, 24, and 26, respectively. Assum- from 4900 to 7500 Å. We used this interval to join the two
ing that all the light within the aperture of 5” used to do spectra. We computed the spectral slope S 0 using this com-
the photometry is actually coming from scattered light from posite spectrum in the range 4000 – 9000 Å, following the S 0
the nucleus, and using an albedo of pV = 0.04 (typical of definition in Luu & Jewitt (1996). The obtained value was
comet nuclei, see Licandro et al. 2018), the computed abso- S 0 = 12 ± 1 %/1000Å. The quoted uncertainty in the value of
lute magnitudes correspond to a nuclear radius of ∼ 3.6 km. S 0 has been computed as the standard deviation (σ) of the
However, as the comet is active, its brightness also depends S 0 values obtained for each single reflectance spectrum of the
on the contribution of dust in the photometric aperture so we object as in Licandro et al. (2019). The computed spectral
consider this an upper limit. This value is in agreement with slope of comet 2I/Borisov fits well into the general spectral
the range of nuclear sizes reported by other authors also from behaviour of cometary dust, having spectral gradients simi-
photometry: Jewitt & Luu (2019) set a range between 0.35 lar to those found for X- and D-type asteroids (Jewitt 2015;
and 3.8 km, assuming an albedo of pV = 0.1, while Fitzsim- Licandro et al. 2018), and it is also similar to the computed
mons et al. (2019) constrained the nuclear radius to 0.7- spectral slope for 1I/‘Oumuamua in the same wavelength
3.3 km. The size is compatible to the typical sizes observed range, S 0 = 10 ± 6 %/1000Å (Ye et al. 2017). Our computed
for cometary nuclei in our Solar system (∼ 2.8 km, Meech value of the spectral slope S 0 = 22 ± 1 %/1000Å in the range
2017). From their observation in the K-band using the Gem- 3900 – 6000 Å, supports the results obtained by Fitzsim-
ini South telescope, Lee et al. (2019) reported a nuclear size mons et al. (2019), where they found a value of 19.9 ± 1.5
of r N = 1.5 km, assuming an infrared albedo of 0.07. A more %/1000 Å in the same wavelength interval measured on a
recent work from Jewitt et al. (2020) using observations of visible spectrum obtained on the night of 2019, Sep. 20, and
2I/Borisov made with the Hubble Space Telescope has con- reinforces the conclusion that comet dust from 2I/Borisov
strained the size of the nucleus between 0.2 and 0.5 km. behaves likes normal comet dust observed in our Solar sys-
This size is similar to the size of the other only known inter- tem, presenting a steeper slope at shorter wavelengths.
stellar object, 1I/‘Oumuamua (. 200 m), that showed none We also obtained the (g − r 0 ) colour from our visible re-
or very weak activity (Micheli et al. 2018). A recent work flectance spectrum. To do this, we obtained the reflectances
on the size-frequency distribution of long-period comets de- Rg and Rr 0 through the convolution of the Sloan transmis-
tected by the Pan-STARRS1 near-Earth object survey, has sion curves of these two filters and the visible spectrum.
identified a lack of objects with diameters < 1km and show- Then, we transformed such reflectances into colours using
ing activity (Boe et al. 2019). There is no clear explanation the expression (g − r 0 ) = –2.5 log(Rg /Rr 0 ) + (g − r 0 ) , where
on why small Oort cloud objects might not be active and (g − r 0 ) is the colour index of the Sun, taken to be equal to
MNRAS 000, 1–10 (2020)Observations of interstellar comet 2I/Borisov 5
0.45 from Holmberg et al. (2006). Using this expression, we
1I/'Oumuamua
get a value of (g − r 0 ) = 0.69 ± 0.04, in agreement within the
2I/Borisov
errors with the value of (g − r 0 ) = 0.66 ± 0.01 reported by
Guzik et al. (2020). Jewitt & Luu (2019) reported a colour LP Comets (Active)
of (B − V) = 0.80 ± 0.05. This value translates into a value LP Comets (Non active)
of (g − r 0 ) = 0.60 ± 0.04, using the transformation discussed SP Comets (Active)
by Jester et al. (2005), which is slightly smaller than the SP Comets (Non active)
(g − r 0 ) colour computed in this work and in Guzik et al. TNOs
(2020). From the images of comet 2I/Borisov in the near- Red Centaurs
Gray Centaurs 0.3 0.6 0.9 1.2
infrared on the night of Sep. 24, we obtained J = 16.97 ±
0.31 and H = 16.45 ± 0.44, which gives (J − H) = 0.52 ± (g - r')
0.54.
We now compare the obtained colours for comet
2I/Borisov to those of the only other interstellar object ob-
served so far, 1I/‘Oumuamua, and with the colours of comets
and other related populations in our Solar system such as
trans-Neptunian objects (TNOs) and Centaurs. Fig. 3 shows
the (g − r 0 ) and (J − H) median values of these populations,
as well as their maximum and minimum values as horizontal
error bars. Following Jewitt (2015), we distinguish between -0.70 0.30 1.30
active and non-active comets, and between short-period (SP, (J - H)
i.e., Jupiter family comets) and long-period (LP) comets
(including Halley type). These colours have been compiled Figure 3. Comparison of the (g −r 0 ) and (J − H) colours of comet
from the literature using different sources. Table 3 shows 2I/Borisov (this work) to the colours of long period comets (LP),
the median value for each population, as well as the num- short period comets (SP), TNOs, and red and gray Centaurs. For
ber of observations used to compute these median values these populations, we plot the median value of the population
(N) and the corresponding reference. We converted (B − V) as well as the maximum and minimum values (error bars). In
colours from Hainaut et al. (2012) into (g − r 0 ) using the the case of 2I/Borisov and the (J − H) colour of 1I/‘Oumuamua,
transformations presented in Jester et al. (2005) and retain- error bars correspond to the error associated with each computed
colour. See Table 3 and main text for more details.
ing only those values with an uncertainty (B − V) < 0.15.
In the same way, we only selected (J − H) values with an
uncertainty < 0.4. Finally, we used the (g − r 0 ) colours of occurred earlier (at around 7.8 au, as suggested by Ye et al.
1I/‘Oumuamua from Bannister et al. (2017), Jewitt et al. 2020), the dust production rate was likely very low at such
(2017), Ye et al. (2017), and Bolin et al. (2018), while its distances so as to have a detectable influence on the mod-
(J − H) colour was obtained from the reflectance spectrum elling results. The particle density is assumed at ρ=800 kg
presented by Fitzsimmons et al. (2018), using the same pro- m−3 , in line with Rosetta/GIADA estimates for comet 67P
cedure described above to obtain our (g − r 0 ) colour in the by Fulle et al. (2016), and the geometric albedo is set to
case of 2I/Borisov. Both values are shown in Table 3 and, 4 per cent, consistently with the value assumed in Section
when compared to the median value of the different popula- 3.1. A phase function correction is performed by assuming
tions shown in Fig. 3, it can be seen that comet 2I/Borisov a linear phase coefficient of b=0.03 mag deg−1 . The size dis-
presents visible and near-infrared colours that are slightly tribution is assumed to be governed by a power-law function
redder than those for 1I/‘Oumuamua, but in good agree- with power index κ. A broad size distribution is assumed,
ment with the colours of comets in the visible and comets, having minimum and maximum radii given by rmin =1 µm
TNOs and Centaurs in the near-infrared. and rmax =1 cm. For simplicity, the terminal speeds v are
parameterised by an expression of the type v = v0 βγ rh−0.5 ,
where v0 is a time-independent speed parameter and rh is
3.3 Dust tail model
the comet heliocentric distance expressed in au. For an ex-
For the dust tail fitting, we used our Monte Carlo dust tail panding gas flow from ice sublimation, γ ≈ 0.5. However,
code that has been described in several works in the past this parameter has been found to vary between 0.42 and 1.5
to characterise the dust environments of comets and main- from Rosetta/GIADA measurements on comet 67P (Della
belt comets (see e.g. Moreno et al. 2016, 2017). The particles Corte et al. 2015, 2016). On the other hand, measurements
are assumed to be spherical, and their trajectories are de- of individual particles from Rosetta/OSIRIS at far heliocen-
scribed by the β parameter, defined as β = (Cpr Q pr )/(ρd), tric distances by Rotundi et al. (2015) show no dependence
where ρ is the particle density, d is the particle diameter, of particle speeds on size. Thus, we left γ as a free parameter
Cpr =1.19×10⁻⁴ g cm−2 is the radiation pressure coefficient, of the model. The mass loss rate is assumed to be related
and Q pr ∼1 is the scattering efficiency for radiation pres- to the comet heliocentric distance by a function of the form
sure. The code computes the position on the sky plane of log dM/dt = A log rh + B where dM/dt is expressed in kg s−1
particles ejected isotropically from a sublimating nucleus. and rh in au, and constants A and B are to be found from
Their trajectories depend on β and their terminal velocities. the model fittings. These two constants, together with v0 , γ,
The comet activity is assumed to start at a heliocentric dis- and κ constitute the set of input parameters of the model.
tance of 4.5 au (2019, June 5), as estimated by Jewitt & The best-fit parameters are determined by a minimisation
Luu (2019). Although the onset of the activity might have routine (Nelder & Mead 1965).
MNRAS 000, 1–10 (2020)6 J. de León et al.
Table 3. Visible and near-infrared colours of comets and other related populations (TNOs and Centaurs) of our Solar system. We show
the number of observations used (N ) and the median value of each population, as well as the corresponding reference. We also include
the colours of 2I/Borisov from this work and the literature, and those of 1I/‘Oumuamua from the literature.
Visible Near-infrared
N (g − r 0 ) Ref. N (J − H) Ref.
Gray Centaurs 15 0.59 Hainaut et al. (2012) 11 0.39 Hainaut et al. (2012)
Red Centaurs 11 0.98 Hainaut et al. (2012) 6 0.39 Hainaut et al. (2012)
TNOs 174 0.77 Hainaut et al. (2012) 117 0.40 Hainaut et al. (2012)
SP comets (active) 22 0.59 Solontoi et al. (2012) 12 0.42 Hanner et al. (1984)
Popescu et al. (2016)
SP comets (non-active) 48 0.66 Lamy & Toth (2009) 2 0.41 Hainaut et al. (2012)
Sykes et al. (2000)
LP comets (active) 40 0.62 Jewitt (2015) 3 0.48 Picazzio et al. (2010)
Solontoi et al. (2012)
LP comets (non-active) 5 0.61 Lamy & Toth (2009) 1 0.37 Sykes et al. (2000)
1I/‘Oumuamua 4 0.53 Bannister et al. (2017) 0.23 ± 0.25 Fitzsimmons et al. (2018)
Jewitt et al. (2017)
Ye et al. (2017)
Bolin et al. (2018)
2I/Borisov 0.69 ± 0.04 This work 0.52 ± 0.54 This work
0.66 ± 0.01 Guzik et al. (2020)
0.60 ± 0.04 Jewitt & Luu (2019)
2019 Sep. 13 2019 Sep. 24 2019 Sep. 26
104 2x10⁴
104 2x10⁴
104
0
0
0
-104
-104
-104
(a) (b) (c)
-104 0 104 -104 0 104 2x10⁴ -104 0 104 2x10⁴
2019 Sep. 13 2019 Sep. 24 2019 Sep. 26
104 2x10⁴
104 2x10⁴
104
0
0
0
-104
-104
-104
(d) (e) (f)
-104 0 104 -104 0 104 2x10⁴ -104 0 104 2x10⁴
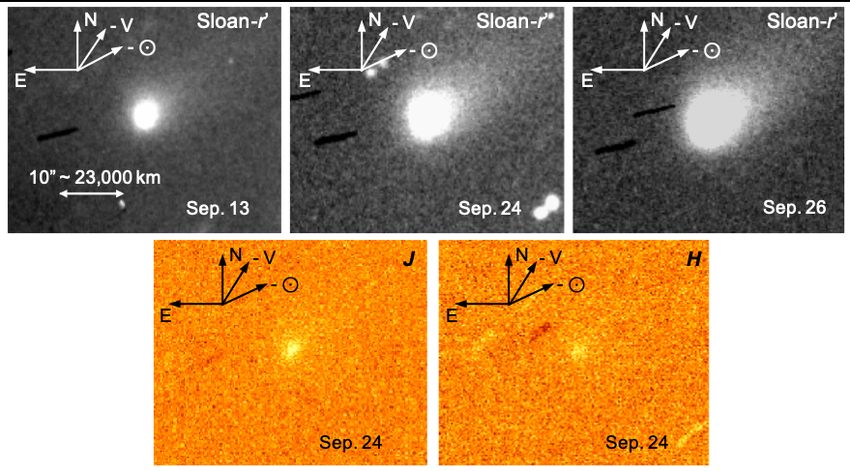
Figure 4. Observed (black contours) and computed (red contours) isophotes of the GTC images of the dust tail of comet 2I/Borisov.
The images are all oriented North up, and East to the left. All axes scales indicate cometocentric distances in km. The uppermost three
panels (a), (b), and (c) correspond to the case γ=0.5. Panels (d), (e), and (f) correspond to the model with γ taken as a free parameter,
resulting in γ=0.1 (see Table 4). The innermost isophote on the 2019-Sep-13 image is 1.5×10⁻¹³ solar disk intensity units (sdu), and for
the other two dates it is 2.0×10⁻¹³ sdu. Isophote levels decrease in factors of two outwards.
We arrived to the best-fit parameters shown in Table 4, 2004), and in the range estimated by Guzik et al. (2020)
first row. In Fig. 4, panels (d), (e), and (f), we show a com- for this object (–3.7 ± 1.8). For the derived size distribution
parison between the observed and modelled isophote fields. parameters, the effective radius (Hansen & Travis 1974) is
The resulting A and B parameters provide a dust production re f f =170 µm, close to the 100 µm value estimated by Jewitt
rate of 3.6 kg s−1 at 4.5 au, increasing up to 52 kg s−1 at & Luu (2019). The coefficient γ=0.1 indicates a very weak
2.59 au, corresponding to the date of the latest observation. dependence of terminal speeds on size. This is in line with
The value of the power index, κ=–3.4, is within the typical the single particle detections speeds for 67P at large rh (Ro-
range of measured or inferred values for other comets (Fulle tundi et al. 2015). To show the results for γ=0.5, as expected
MNRAS 000, 1–10 (2020)Observations of interstellar comet 2I/Borisov 7
Table 4. Summary of best-fit model parameters obtained after s−1 , and Kareta et al. (2020), Q(CN) = (5 ± 2) × 1024 mol
applying our Monte Carlo dust tail code to the images of comet s−1 , both on the night of 2019, Sep. 20. This larger value of
2I/Borisov acquired with GTC. See text for more details. the gas production could be caused by an intrinsic variabil-
ity in the comet’s activity (an outburst), but in any case it
A B v0 (m s−1 ) γ κ has to be taken with caution. Although the seeing conditions
were similar on the two nights, the comet was observed at
–4.92 3.77 54.6 0.1 –3.46 a higher airmass (lower elevation) in the case of the second
–4.79 3.61 152.9 0.5 –3.44 night (2019, Sep. 26). From the 2D spectra we can provide a
3 σ upper limit for the C2 production rate of Q(C2 ) < (4.5
± 0.1) × 1024 mol s−1 , in excellent agreement with the upper
from gas drag models, we run the code by fixing that param- limit reported by Fitzsimmons et al. (2019). Our measured
eter, and the results are also shown in Table 4 (second row) ratio upper limit of Q(CN)/Q(C2 ) < 0.511 is larger than
and Fig. 4, panels (a), (b), and (c). The fittings are worser in the one reported by Kareta et al. (2020), Q(CN)/Q(C2 ) <
this case, producing a more circularised isophote field than 0.095, and also slightly larger than the value reported by
observed, and diverging from the observed isophotes at large Opitom et al. (2019), Q(CN)/Q(C2 ) < 0.3, but still lower
nucleocentric distances. However, both models show consis- than the value of 0.66 that marks the limit between car-
tently similar dust mass loss rates and size distribution (Ta- bon ’Depleted’ comets and ’Typical’ comets in the A’Hearn
ble 4). The corresponding particle speeds for β=1 are 94 m et al. (1995) taxonomy. In a very recent work, McKay et al.
s−1 (for γ=0.5) and 34 m s−1 (for γ=0.1), which compare well (2020) reported an H2 O production rate of (6.3 ± 1.5) ×
with the estimated speed of 44 ± 14 m s−1 by Guzik et al. 1026 mol s−1 from observations using the 2.3m Astrophysical
(2020) and speed range from 69 to 92 m s−1 by Kochergin Research Consortium telescope, on the night of 2019, Oct.
et al. (2019). 11. This value was derived from the detection of [OI ] 6300 Å
In all the simulations performed, the observed bright- emission line with ARCES high-resolution spectrograph. Us-
ness is assumed to be dominated by the dust, i.e., the bright- ing this H2 O production rate, we obtain a Q(CN)/Q(H2 O)
ness of the nucleus is neglected. Model runs adding a nucleus ratio of 0.36 ± 0.17 per cent and 1.51 ± 0.26 per cent for
at the opto-center indicate that the results are very similar the 2019, Sep. 24 and 26 nights, respectively. Again, our ob-
for nucleus sizes of up to ∼3 km in radius, provided that the tained Q(CN)/Q(H2 O) ratio for the 2019 Sep. 24 night is in
nucleus has the same geometric albedo and phase coefficient good agreement with the values observed by A’Hearn et al.
values as those assumed for the dust particles. (1995) for comets in the Solar system as a function of helio-
centric distance (see Fig. 2 in McKay et al. 2020), while the
ratio obtained for the 2019, Sep. 26 night is larger than any
3.4 Gas production
other value obtained for comets at such heliocentric distance
To analyse the gas emission of comet 2I/Borisov, we stud- (2.58 au).
ied the 2D flux-calibrated spectra described in Section 2.2.
For a better visualisation of the emission bands, we used a
spectrum of the Sun downloaded from the CALSPEC compi- 3.5 Dynamics
lation (Bohlin et al. 2014) to remove the continuum on each
individual spectra: the CN (0-0) emission at 3880 Å is clearly 3.5.1 Radiant
detected (see Fig. 5), and we do not detect any C2 emission The kinematic properties of minor bodies escaped from an
within the 3 σ level. For the 2D analysis we fit a linear con- Oort Cloud structure hosted by another star must be con-
tinuum using the two regions that border the CN emission sistent with those of stars in the solar neighbourhood and
band, which was then subtracted from the comet’s spectra. beyond; therefore, the analysis of the pre-encounter trajec-
We converted the band flux into column density using the tory of 2I/Borisov might shed some light on its most likely
g-factor from Schleicher (2010), scaled to both the heliocen- origin.
tric distance and velocity (see Table 2). To compute the gas We have performed integrations backward in time of
production rate we assumed the Haser modelling with the 1000 control orbits of 2I/Borisov generated by applying the
outflow velocity v p scaled with rh (v p = 0.86 rh−4 km s−1 ), Monte Carlo using the Covariance Matrix (MCCM) method
customary values for the daughter velocity vd = 1 km s−1 , described by de la Fuente Marcos & de la Fuente Marcos
and scale lengths given in A’Hearn et al. (1995). For the (2015) and modified here to work with hyperbolic orbits. A
corresponding set of parameters in the Haser modelling, we statistical analysis (median and 16th and 84th percentiles)
produced theoretical column density profiles for CN varying of the results indicates that at 1.650954 ± 0.000005 pc from
the production rate until the best match between observa- the Sun and 5×10⁵ yr into the past, 2I/Borisov was mov-
tions and theoretical predictions was achieved. We obtained ing inwards, at -32.28220+0.00010
−0.00020
km s−1 with respect of
Q(CN) = (2.3 ± 0.4) × 1024 mol s−1 and Q(CN) = (9.5 ± the barycentre of the Solar system (1I/‘Oumuamua had
0.2) × 1024 mol s−1 for the 2019, Sep. 24 and 26 nights, −26 km s−1 , e.g. Mamajek 2017) and projected towards
respectively. The first value is in good agreement with the (radiant or antapex) α = 02h 11m 10s , δ = +59◦ 26 0 24 00
set of measurements reported by Opitom et al. (2019) from (32.◦ 7894 ± 0.0002, +59.◦ 44010 ± 0.◦ 00010) in the constel-
observations between 2019, Sep. 30 and October 13, ranging lation of Cassiopeia but close to Perseus as seen from
from Q(CN) = (1.6 ± 0.5) × 1024 to Q(CN) = (2.1 ± 0.1) Earth with Galactic coordinates l = 132.◦ 923, b = -01.◦ 876,
× 1024 mol s−1 , while the second value is significantly larger and ecliptic coordinates λ = 54.◦ 321, β = +42.◦ 881. There-
than any of the reported values so far, including that from fore, the radiant appears projected against the plane of
Fitzsimmons et al. (2019), Q(CN) = (3.7 ± 0.4) × 1024 mol the Milky Way. The components of its Galactic velocity
MNRAS 000, 1–10 (2020)8 J. de León et al.
4.0E-16
7.0E-17 encounter with the Solar system is compatible with that of
C2 (∆V=0) C2 (∆V=-1)
Sept-24 (#1)
Flux (erg cm-2 s-1 Å-1)
2.5E-16 4.0E-17 3σ
the so-called Cassiopeia-Perseus family of open star clusters
as described by de la Fuente Marcos & de la Fuente Marcos
CN (0-0) 1.0E-17
(2009). The origin of 2I/Borisov has been previously inves-
1.0E-16 -2.0E-17 tigated by Bailer-Jones et al. (2020) and Hallatt & Wiegert
4800 5000 5200 5400 5600 5800
(2020), both studies have been unable to single out robust
0
4.0E-16 extrasolar planetary system candidates to be the source of
-5.0E-17
7.0E-17
this interstellar comet.
C2 (∆V=0) C2 (∆V=-1)
Sept-24 (#2)
Flux (erg cm-2 s-1 Å-1)
2.5E-16 4.0E-17 3σ
CN (0-0)
1.0E-17 3.5.2 Apex
1.0E-16 -2.0E-17 Answering the question of where is 2I/Borisov headed next
4800 5000 5200 5400 5600 5800
after its flyby with the Sun requires the analysis of a sim-
0
4.0E-16 ilar set of direct N-body simulations (also with MCCM),
-5.0E-17
3.0E-17
but forward in time. At 1.650668 ± 0.000005 pc from the
Sept-26 (#1) C2 (∆V=0) C2 (∆V=-1) Sun and 5×10⁵ yr into the future, this object will be re-
Flux (erg cm-2 s-1 Å-1)
2.5E-16
1.0E-17
3σ ceding from us at 32.27590+0.00010
−0.00020
km s−1 towards (apex)
CN (0-0) α = 18h 21m 39s , δ = -51◦ 58 0 37 00 (275.◦ 41350 ± 0.◦ 00007, -
1.0E-16 -1.0E-17 51.◦ 97680 ± 0.◦ 00010) in the constellation of Telescopium but
4800 5000 5200 5400 5600 5800
close to Ara with Galactic coordinates l = 342.◦ 563, b = -
0
4.0E-16 16.◦ 746, and ecliptic coordinates λ = 273.◦ 794, β = -28.◦ 608.
-5.0E-17
3.0E-17
Its post-encounter Galactic velocity will be (29.49770 ±
Sept-26 (#2)
C2 (∆V=0) C2 (∆V=-1)
0.00010, -9.22751+0.00005 , -9.29887+0.00006 ) km s−1 .
Flux (erg cm-2 s-1 Å-1)
3σ −0.00008 −0.00005
2.5E-16
1.0E-17
CN (0-0)
-1.0E-17 3.5.3 Non-gravitational forces
1.0E-16 4800 5000 5200 5400 5600 5800
The results presented above have been obtained using ini-
0
tial conditions derived from the orbit determination included
-5.0E-17 in Table 1 and performing integrations that neglected non-
3600 4100 4600 5100 5600 6100 6600 7100
gravitational acceleration terms in the motion of 2I/Borisov.
Wavelength (Å)
However, the orbit determination in Table 1 is based on con-
sidering the vaporization of water ice on a rapidly rotating
Figure 5. Emission spectra of interstellar comet 2I/Borisov ob- nucleus (Whipple icy model, see e.g Marsden et al. 1973)
tained on the nights of 2019, September 24 and 26 using OSIRIS with an active vent (see e.g Sekanina 1993) that produces
at the GTC. The CN emission band is clearly seen in all individual a force with radial, transverse and normal components of
spectra. the form A g(r) with g(r) = α (r/r0 )−m (1 + (r/r0 )n )−k , where
r0 =2.808 au, k=4.6142, m=2.15, n=5.093, α=0.1112620426,
and the A-parameters have the values given in Table 1, with
were (U, V, W) = (22.00060 ± 0.00010, -23.60090 ± 0.00010, the normal component being of negligible value for this orbit
1.056640+0.000010
−0.00006
) km s−1 . These values have been computed determination. We have repeated the calculations discussed
as described by de la Fuente Marcos & de la Fuente Mar- above including this H2 O-driven outgassing (full details of
cos (2019b). It is rather difficult to find the exact origin of these calculations will be provided in a forthcoming publi-
2I/Borisov due to the limited availability of data for stars cation), using again MCCM techniques to generate initial
in the solar neighbourhood and beyond; however, its velo- conditions.
city matches well that of known neighbouring stars and also Including this non-gravitational force, the approach
those of more distant regions of the Galactic disc. velocity of 2I/Borisov was -32.2815+0.0004 −0.0003
km s−1 com-
We have used Gaia second data release (DR2, Gaia Col- ing from coordinates α = 02h 11m 11s , δ = +59◦ 26 0 27 00
(32.◦ 7936+0◦. 0002 , +59.◦ 44070 ± 0.◦ 00010); the components
laboration et al. 2016, 2018) to search for kinematic ana- ◦
logues of 2I/Borisov within 6000 σ of the values of the Galac- −0. 0003
tic velocity components presented above, as discussed by de of its Galactic velocity were (U, V, W) = (22.0009+0.0002
−0.0003
, -
+0.0003 +0.00003 −1
23.5996−0.0002 , 1.05592−0.00007 ) km s . Its future receding
la Fuente Marcos & de la Fuente Marcos (2019a). One of
the relevant stars, TYC 3292-1633-1 (a somewhat solar-like velocity will be 32.2759 ± 0.0002 km s−1 moving towards
star) is only about 90 pc from the Sun and it has (U, V, W) = α = 18h 21m 39s , δ = -51◦ 58 0 37 00 (275.◦ 41350 ± 0.◦ 00007,
(22.5 ± 0.8, -23.4 ± 0.9, 1.3 ± 0.2) km s−1 . However, cal- -51.◦ 97680 ± 0.◦ 00010); the components of its Galactic ve-
culations carried out using the approach described in de locity were (29.49770 ± 0.00010, -9.22751 ± 0.00005, -
la Fuente Marcos & de la Fuente Marcos (2018) failed to 9.29887+0.00006
−0.00002
) km s−1 .
produce a consistently close flyby between star and comet. We have compared our results with predictions from
If more distant candidate sources are considered, the radi- JPL’s SSDG SBDB and found discrepancies under 0.1 per
ant appears projected towards the Perseus spiral arm about cent with overlapping values within the computed uncer-
2 kpc from the Sun, which is home of multiple regions of star tainties although the integration techniques and physical
formation. The Galactic velocity of 2I/Borisov prior to its model used here are different. Therefore, we are confident
MNRAS 000, 1–10 (2020)Observations of interstellar comet 2I/Borisov 9
that our results are sufficiently reliable. Bailer-Jones et al. (g − r 0 ) colour computed for 1I/Oumuamua, and very simi-
(2020) carried out a similar analysis using orbit determi- lar to the (g − r 0 ) colours obtained for active and non-active
nations released prior to 2019 December and their overall comets in our Solar system. It also allowed us to measured
conclusions are consistent with the ones presented here al- CN gas production rates of Q(CN) = (2.3 ± 0.4) × 1024 mol
though the numerical values are slightly different. s−1 and Q(CN) = (9.5 ± 0.2) × 1024 mol s−1 , for the nights
of 2019, Sep. 24 and Sep. 26, respectively. The former value
is in good agreement with measurements reported by other
3.5.4 Kinematic context authors on similar nights, while the latter is slightly larger
Although all the calculations show that both 1I/‘Oumuamua than any reported CN gas production rate. A 3 σ upper
and 2I/Borisov arrived from interstellar space and they will limit for the C2 production rate of Q(C2 ) < (4.5 ± 0.1) ×
return back to it, the kinematic signature of 2I/Borisov is 1024 mol s−1 was obtained from the spectra, placing inter-
different from that of 1I/‘Oumuamua as described by e.g. stellar comet 2I/Borisov in the region of carbon ’Depleted’
Mamajek (2017). 1I/‘Oumuamua is apparently moving out- comets according to A’Hearn et al. (1995) taxonomy. Finally,
wards, but 2I/Borisov is headed for the inner section of the our dynamical simulations showed that the Galactic velocity
Milky Way. The radiant is also different and far from others of 2I/Borisov matches well that of known stars in the solar
associated with known weakly hyperbolic comets (see e.g. neighbourhood and also those of more distant regions of the
fig. 3 in de la Fuente Marcos et al. 2018). Finding the actual Galactic disc.
origin of a given interstellar object is a difficult task now and
it will continue being so for decades to come. The limiting
factor is not in the uncertainty of the coordinates of the radi- ACKNOWLEDGEMENTS
ants or the values of the components of the Galactic velocity
of the interstellar minor bodies, but in the quality and the JdL and MP acknowledge financial support from the project
quantity of the available stellar data. In general, Solar sys- ProID2017010112 under the Operational Programmes of the
tem data are more precise than their Galactic counterparts. European Regional Development Fund and the European
In addition and for example, out of the billion of sources in Social Fund of the Canary Islands (OP-ERDF-ESF), as well
Gaia DR2, less than eight millions have positions, parallax, as the Canarian Agency for Research, Innovation and Infor-
radial velocity, and proper motions; these data are essential mation Society (ACIISI), and the project AYA2017-89090-
to compute the Galactic velocity of the stars, but also to P of the Spanish Ministerio de Economı́a y Competitividad’
generate initial conditions to perform N-body simulations (MINECO). CdlFM and RdlFM thank S. J. Aarseth for pro-
to confirm possible close encounters at low relative velocity viding one of the codes used in this research and for com-
between interstellar objects and field stars. ments on the implementation of non-gravitational forces in
the calculations, and A. I. Gómez de Castro for providing ac-
cess to computing facilities. Part of the calculations and the
data analysis were completed on the Brigit HPC server of the
4 CONCLUSIONS
‘Universidad Complutense de Madrid’ (UCM), and we thank
We have conducted an observational study of interstellar S. Cano Alsúa for his help during this stage. This work was
comet 2I/Borisov, using the 10.4-m GTC and the 3.6-m partially supported by the Spanish MINECO under grant
TNG telescopes, located at the Roque de los Muchachos Ob- ESP2017-87813-R. In preparation of this paper, we made
servatory, in the island of La Palma (Spain). We obtained a use of the NASA Astrophysics Data System, the ASTRO-PH
series of images in the visible using GTC and the Sloan-r 0 e-print server, the MPC data server, and the SIMBAD and
filter, that allowed us to analyse Borisov’s cometary activity VizieR databases operated at CDS, Strasbourg, France. This
and dust ejection. From the photometry of the images we in- work has made use of data from the European Space Agency
ferred an upper limit for the size of the nucleus of r N < 3.6 (ESA) mission Gaia (https://www.cosmos.esa.int/gaia),
km, a value that is in agreement with the one obtained from processed by the Gaia Data Processing and Analysis Con-
the dust modelling, and also in agreement with upper limits sortium (DPAC, https://www.cosmos.esa.int/web/gaia/
from other authors. In addition, dust modelling results indi- dpac/consortium). Funding for the DPAC has been pro-
cate a moderate dust production rate of ∼ 50 kg s−1 at helio- vided by national institutions, in particular the institutions
centric distance of rh = 2.6 au, with a differential power-law participating in the Gaia Multilateral Agreement.. LML ac-
dust size distribution of index ∼ –3.4, in the range retrieved knowledges the financial support from the State Agency
for many comet comae. Images in the near-infrared using J for Research of the Spanish MCIU through the Centro de
and H filters yielded a colour (J − H) = 0.52 ± 0.54, similar Excelencia Severo Ochoa Program under grant SEV-2017-
to the (J − H) colours found for comets and other related 0709, and from the research project PGC2018-099425-B-I00.
objects like TNOs and Centaurs in our Solar system. From FM acknowledges financial support from the Spanish Plan
the visible spectra obtained using the 10.4-m GTC telescope Nacional de Astronomia y Astrofisica LEONIDAS project
we computed a spectral slope of S 0 = 12 ± 1 %/1000Å in the RTI2018-095330-B-100 and the Centro de Excelencia Severo
4000 – 9000Å wavelength range, similar to the slope mea- Ochoa Program under grant SEV-2017-0709. NPA acknowl-
sured for 1I/‘Oumuamua in the same wavelength range. The edges funds through the SRI/FSI project “Digging-Up Ice
observed spectral gradient of comet 2I/Borisov, being redder Rocks in the Solar System” and the Center for Lunar and As-
at shorter wavelengths, is also in very good agreement with teroid Surface Science funded by NASA’s SSERVI program
the observed spectral behaviour of cometary dust in Solar at the University of Central Florida. MDP acknowledges
system comets. The visible spectrum allowed us to extract funding from the Prominent Postdoctoral Program of the
a colour (g − r 0 ) = 0.69 ± 0.04, which is comparable to the University of Central Florida. ACS-F acknowledges CAPES
MNRAS 000, 1–10 (2020)10 J. de León et al.
(Coordenação de Aperfeiçoamento de Pessoal de Nı́vel Supe- Hansen J. E., Travis L. D., 1974, Space Sci. Rev., 16, 527
rior - Brasil) for financed in part this study (Finance Code Holmberg J., Flynn C., Portinari L., 2006, MNRAS, 367, 449
001). Based on observations made with the Gran Telesco- Jester S., et al., 2005, AJ, 130, 873
pio Canarias (GTC) and the Italian Telescopio Nazionale Jewitt D., 2015, AJ, 150, 201
Galileo (TNG), both installed at the Spanish Observatorio Jewitt D., Luu J., 2019, ApJ, 886, L29
Jewitt D., Luu J., Rajagopal J., Kotulla R., Ridgway S., Liu W.,
del Roque de los Muchachos of the Instituto de Astrofı́sica
Augusteijn T., 2017, ApJ, 850, L36
de Canarias, in the island of La Palma. The TNG is oper- Jewitt D., Hui M.-T., Kim Y., Mutchler M., Weaver H., Agarwal
ated by the Fundación Galileo Galilei of the INAF (Istituto J., 2020, ApJ, 888, L23
Nazionale di Astrofisica). We thank E. Poretti for the allo- Kareta T., et al., 2020, ApJ, 889, L38
cation of Director’s Discretionary Time at TNG. Kochergin A., et al., 2019, Research Notes of the American As-
tronomical Society, 3, 152
Lamy P., Toth I., 2009, Icarus, 201, 674
Landolt A. U., 1992, AJ, 104, 340
REFERENCES Lee C.-H., Lin H.-W., Chen Y.-T., Yen S.-F., 2019, Research
A’Hearn M. F., Millis R. C., Schleicher D. O., Osip D. J., Birch Notes of the American Astronomical Society, 3, 184
P. V., 1995, Icarus, 118, 223 Licandro J., Popescu M., de León J., Morate D., Vaduvescu O.,
Baffa C., et al., 2001, A&A, 378, 722 De Prá M., Ali-Laoga V., 2018, A&A, 618, A170
Bailer-Jones C. A. L., Farnocchia D., Ye Q., Meech K. J., Micheli Licandro J., de la Fuente Marcos C., de la Fuente Marcos R., de
M., 2020, A&A, 634, A14 León J., Serra-Ricart M., Cabrera-Lavers A., 2019, A&A, 625,
Bannister M. T., et al., 2017, ApJ, 851, L38 A133
Boe B., et al., 2019, Icarus, 333, 252 Luu J. X., Jewitt D. C., 1996, AJ, 111, 499
Bohlin R. C., Gordon K. D., Tremblay P. E., 2014, PASP, 126, Mamajek E., 2017, Research Notes of the American Astronomical
711 Society, 1, 21
Bolin B. T., et al., 2018, ApJ, 852, L2 Marsden B. G., Sekanina Z., Yeomans D. K., 1973, AJ, 78, 211
Cepa J., 2010, Astrophysics and Space Science Proceedings, 14, McGlynn T. A., Chapman R. D., 1989, ApJ, 346, L105
15 McKay A. J., Cochran A. L., Dello Russo N., DiSanti M. A., 2020,
Cepa J., et al., 2000, in Iye M., Moorwood A. F., eds, So- ApJ, 889, L10
ciety of Photo-Optical Instrumentation Engineers (SPIE) Meech K. J., 2017, Philosophical Transactions of the Royal Soci-
Conference Series Vol. 4008, Proc. SPIE. pp 623–631, ety A: Mathematical, Physical and Engineering Sciences, 375,
doi:10.1117/12.395520 20160247
Cook N. V., Ragozzine D., Granvik M., Stephens D. C., 2016, Micheli M., et al., 2018, Nature, 559, 223
ApJ, 825, 51 Moreno F., et al., 2016, A&A, 587, A155
de la Fuente Marcos R., de la Fuente Marcos C., 2009, New As- Moreno F., et al., 2017, ApJ, 837, L3
tron., 14, 180 Nelder J. A., Mead R., 1965, The Computer Journal, 7, 308
de la Fuente Marcos C., de la Fuente Marcos R., 2015, MNRAS, Opitom C., et al., 2019, A&A, 631, L8
453, 1288 ’Oumuamua ISSI Team et al., 2019, Nature Astronomy, 3, 594
de la Fuente Marcos R., de la Fuente Marcos C., 2018, Research Persson S. E., Murphy D. C., Krzeminski W., Roth M., Rieke
Notes of the American Astronomical Society, 2, 30 M. J., 1998, AJ, 116, 2475
de la Fuente Marcos C., de la Fuente Marcos R., 2019a, MNRAS, Picazzio E., Figueredo E., de Almeida A. A., de Oliveira
489, 951 C. M., Churyumov K. I., 2010, in Fernandez J. A., Laz-
de la Fuente Marcos R., de la Fuente Marcos C., 2019b, A&A, zaro D., Prialnik D., Schulz R., eds, IAU Symposium
627, A104 Vol. 263, Icy Bodies of the Solar System. pp 285–288,
de la Fuente Marcos C., de la Fuente Marcos R., Aarseth S. J., doi:10.1017/S1743921310001948
2018, MNRAS, 476, L1 Popescu M., et al., 2016, A&A, 591, A115
de León J., Licandro J., Serra-Ricart M., Cabrera-Lavers A., Serra Rotundi A., et al., 2015, Science, 347, aaa3905
J. F., Scarpa R., de la Fuente Marcos C., de la Fuente Marcos Schleicher D. G., 2010, AJ, 140, 973
R., 2019, Research Notes of the AAS, 3, 131 Sekanina Z., 1993, A&A, 277, 265
Della Corte V., et al., 2015, A&A, 583, A13 Sen A. K., Rana N. C., 1993, A&A, 275, 298
Della Corte V., et al., 2016, MNRAS, 462, S210 Solontoi M., et al., 2012, Icarus, 218, 571
Engelhardt T., Vereš P., Jedicke R., Denneau L., Beshore E., 2014, Stern S. A., 1990, PASP, 102, 793
in Muinonen K., Penttilä A., Granvik M., Virkki A., Fedorets Sykes M. V., Cutri R. M., Fowler J. W., Tholen D. J., Skrutskie
G., Wilkman O., Kohout T., eds, Asteroids, Comets, Meteors M. F., Price S., Tedesco E. F., 2000, Icarus, 146, 161
2014. p. 149 Ye Q.-Z., Zhang Q., Kelley M. S. P., Brown P. G., 2017, ApJ,
Fitzsimmons A., et al., 2018, Nature Astronomy, 2, 133 851, L5
Fitzsimmons A., et al., 2019, ApJ, 885, L9 Ye Q., et al., 2020, AJ, 159, 77
Fulle M., 2004, in Festou M. C., Keller H. U., Weaver H. A., eds,
Comets II. University of Arizona Press, p. 565 This paper has been typeset from a TEX/LATEX file prepared by
Fulle M., et al., 2016, ApJ, 821, 19 the author.
Gaia Collaboration et al., 2016, A&A, 595, A1
Gaia Collaboration et al., 2018, A&A, 616, A1
Guzik P., Drahus M., Rusek K., Waniak W., Cannizzaro G.,
Pastor-Marazuela I., 2020, Nature Astronomy, 4, 53
Hainaut O. R., Boehnhardt H., Protopapa S., 2012, A&A, 546,
A115
Hallatt T., Wiegert P., 2020, AJ, 159, 147
Hanner M. S., Tokunaga A. T., Veeder G. J., A’Hearn M. F.,
1984, AJ, 89, 162
MNRAS 000, 1–10 (2020)You can also read