Visual Informatics - University of Notre Dame
←
→
Page content transcription
If your browser does not render page correctly, please read the page content below
Visual Informatics 4 (2020) 63–68

                                                           Contents lists available at ScienceDirect

                                                                 Visual Informatics
                                                    journal homepage: www.elsevier.com/locate/visinf

Visualization Laboratory at University of Notre Dame
Chaoli Wang
Department of Computer Science & Engineering, University of Notre Dame, Notre Dame, IN 46556, United States

article             info                            a b s t r a c t

Article history:                                    This article introduces the Visualization Laboratory at the Department of Computer Science & Engineer-
Available online 11 September 2020                  ing, the University of Notre Dame, including the lab’s overview, current research directions, facilities,
                                                    and international collaborations.
                                                     © 2020 The Author(s). Published by Elsevier B.V. on behalf of Zhejiang University and Zhejiang University
                                                                                     Press Co. Ltd. This is an open access article under the CC BY-NC-ND license
                                                                                                          (http://creativecommons.org/licenses/by-nc-nd/4.0/).

1. Overview                                                                           2. Current research directions

    Located in Northern Indiana, the University of Notre Dame was                        The VisLab’s current research directions include machine
founded in 1842 by Rev. Edward Sorin. Over the past 175 years,                        learning for visualization, flow visualization, time-varying mul-
Notre Dame has become one of the premier universities in the                          tivariate data visualization, visual analytics, and visualization in
United States. The university is well known for its Catholic iden-                    education.
tity, scenic setting, football program, undergraduate education,
and alumni network. At Notre Dame’s Department of Computer                            2.1. Machine learning for visualization
Science & Engineering, the Visualization Laboratory (VisLab) was
established by Prof. Chaoli Wang in 2014. The VisLab is at the                            With the advent of deep learning, the renaissance of artificial
forefront of visualization research. According to CSRankings                          intelligence as a viable solution for solving challenging computer
(Anon, 2020a), Notre Dame ranks among the top 20 institutions                         vision and natural language processing problems has quickly
in the United States based on the IEEE VIS conference publications                    swept across a wide variety of science and engineering fields.
from 2015 to 2020.                                                                    Many problems in scientific data analysis and visualization share
    Prof. Wang’s primary research interests are data visualization                    inherent similarities with image or video processing, making deep
and visual analytics, specifically on the topics of time-varying                      neural networks a promising candidate for effectively solving
multivariate data visualization, flow visualization, graph visu-                      scientific visualization problems.
                                                                                          Among the pioneers studying this research, members of the
alization, information-theoretic algorithms, graph-based tech-
                                                                                      VisLab target 3D scalar and vector data that are most commonly
niques, and deep learning solutions for big data analytics. He has
                                                                                      produced from scientific simulations. In these scenarios, scientists
published more than 90 peer-reviewed journal and conference
                                                                                      often can only store a small fraction of simulation data output in
papers, including more than 20 IEEE Transactions on Visualization
                                                                                      the reduced form due to the stringent constraints on data storage
and Computer Graphics (TVCG) journal and IEEE VIS conference
                                                                                      and movement. Our goal is to augment these reduced simulation
papers. His research has been mainly supported by the U.S.
                                                                                      data using a deep learning approach. Image data augmentation
National Science Foundation (NSF). Since 2009, he has served as
                                                                                      refers to a technique that artificially creates new training data
the principal investigator (PI) or a co-PI of ten NSF grants.
                                                                                      from existing training data via cropping, flipping, and warping,
    Prof. Wang has graduated six Ph.D. and two M.S. students.
                                                                                      etc. Instead, we define data augmentation in our context as the
His students have won four Best Paper and Honorable Mention
                                                                                      addition of spatial, temporal, and variable details to reduced data
Awards, three University Finishing Fellowships, one Dean’s Award
                                                                                      by incorporating information derived from internal and external
for Outstanding Scholarship, three Department Outstanding Re-                         sources.
search and Teaching Assistant Awards, and one Honorable Men-                              Working with the existing scientific workflow, we aim to pro-
tion for the CRA Outstanding Undergraduate Researcher Award.                          vide an alternative to augment domain scientists’ ability to tackle
Currently, the VisLab has five Ph.D. students (including three co-                    the big data problem. We output reduced simulation data in situ,
advised Ph.D. students), one M.S. student, and five undergraduate                     perform offline network training, and enable online or offline
students.                                                                             super-resolution generation or data reconstruction. As shown in
                                                                                      Fig. 1, our current research along this direction includes spatial
    E-mail address: chaoli.wang@nd.edu.                                               and temporal super-resolution for time-varying data (Han and

https://doi.org/10.1016/j.visinf.2020.09.001
2468-502X/© 2020 The Author(s). Published by Elsevier B.V. on behalf of Zhejiang University and Zhejiang University Press Co. Ltd. This is an open access article under
the CC BY-NC-ND license (http://creativecommons.org/licenses/by-nc-nd/4.0/).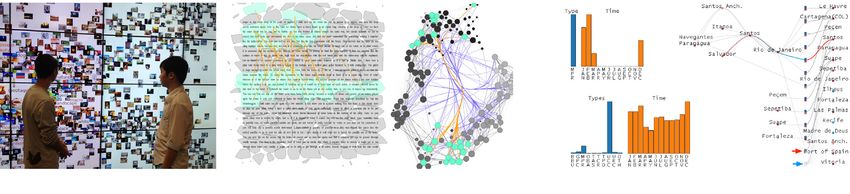
C. Wang                                                                                                                              Visual Informatics 4 (2020) 63–68

Fig. 1. Overview of the deep learning solutions for (a) temporal super-resolution for time-varying data (Han and Wang, 2020a), (b) variable selection and translation
for multivariate time-varying data (Han et al., 2021), (c) spatial super-resolution for vector field data (Guo et al., 2020), and (d) vector field reconstruction using
streamlines (Han et al., 2019).

Fig. 2. (a) The blood flow nearby one terminal aneurysm at the middle cerebral artery (Tao et al., 2016a). (b) As the reduced data representation, flow lines are
used to analyze rapidly-changing electromagnetic properties of superconductivity through vector data reconstruction (Han et al., 2019). (c) Flow lines and surface
depict the swirling and twisting patterns of a procedurally-generated tornado (Tao and Wang, 2016). (d) The two swirls at the wingtips of an aircraft, tracing the
wake vortices (Han et al., 2020).

Wang, 2020b,a), variable selection and translation for multivari-                      Most fluids (air, water, etc.) are transparent, and thus their flow
ate time-varying data (Han et al., 2021), super-resolution for                         patterns are invisible to us. Flow visualization makes the flow
vector field data (Guo et al., 2020), and vector field reconstruction                  patterns visible so that we can visually acquire qualitative and
using flow lines (Han et al., 2019).                                                   quantitative flow information. Fig. 2 shows examples of flow
    Besides data augmentation, we are also interested in represen-                     visualization generated from our research.
tation learning from scientific data leveraging convolutional neu-                         Supported by an NSF CAREER grant, the VisLab has con-
ral networks (CNNs) and graph neural networks (GNNs). These                            ducted a series of research works to address critical challenges
frameworks are general and robust, capable of learning latent                          in integration-based flow visualization by presenting new solu-
feature descriptors implicitly from volumetric and surface data,                       tions for analyzing and exploring flow lines (e.g., streamlines,
eliminating the need for explicit feature engineering. The learned                     pathlines). These works include (1) selecting representative flow
                                                                                       lines based on information theory (Ma et al., 2013a; Tao et al.,
data and feature representations can be used for subsequent
                                                                                       2013), (2) extracting features from flow lines for segmentation
tasks such as dimensionality reduction, interactive clustering, and
                                                                                       and similarity analysis (Li et al., 2014, 2015), (3) creating robust
representative selection (Han et al., 2020; Porter et al., 2019).
                                                                                       visual characters and words from flow lines for shape analysis and
                                                                                       organization (Tao et al., 2014, 2016b), (4) introducing interfaces
2.2. Flow visualization                                                                and interactions for intuitive retrieval of partial flow lines (Tao
                                                                                       et al., 2014, 2016b) and examination of hierarchical flow lines
    Understanding large and complex 3D flow fields is vitally                          and their spatiotemporal relationships (Ma et al., 2013b, 2014a;
important in many aero- and hydro-dynamical systems that dom-                          Tao et al., 2018), and (5) devising streamline repositioning for
inate various physical and natural phenomena. Applications that                        focus+context viewing (Tao et al., 2014b) and automatic tour for
study these systems, such as computational fluid dynamics (CFD),                       examining hidden or occluded flow features (Ma et al., 2014b,
automotive and aircraft design, modeling of natural disasters                          2019).
(e.g., earthquakes, hurricanes, tornados), generate large amounts                          For the popular integration-based techniques for flow visu-
of vector field data that need to be analyzed and visualized.                          alization, line-based techniques have made significant advances
                                                                                  64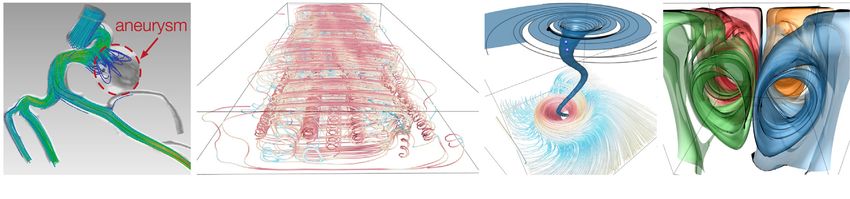
C. Wang Visual Informatics 4 (2020) 63–68
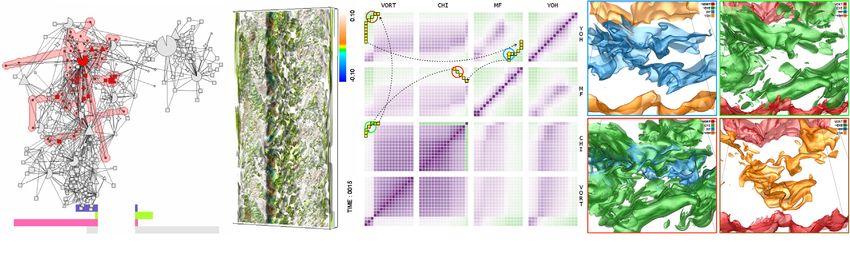
Fig. 3. (a) A mining approach that automatically extracts meaningful features from a graph-based representation for exploring time-varying volumetric data (Gu
et al., 2016). (b) A variable traversal path using the matrix of isosurface similarity maps along with four animation frames corresponding to the path (Tao et al.,
2019).
Fig. 4. (a) iGraph for exploring the MIR Flickr data set running on the 24-tile display wall (Gu et al., 2015, 2017a). (b) ETGraph for organizing the eye-tracking data
to illustrate the reading patterns (Gu et al., 2017b). (c) HoNVis for investigating higher-order dependencies of the global ocean shipping network (Tao et al., 2017).
over the years, providing a sharp contrast to surface-based tech- Time-varying multivariate data visualization has been a re-
niques. Flow surfaces can provide better illustrative capabili- search focus of Prof. Wang dated back to his Ph.D. research.
ties and much-improved visualization than flow lines. However, At that time, the study focused on organizing the data in a
existing methods for surface-based flow visualization still face multiresolutional manner to support efficient and effective re-
substantial challenges of surface selection, visualization, and an- trieval and rendering (Wang and Shen, 2004; Wang et al., 2005;
alytics, calling for creative ideas and novel solutions. Recently, Wang and Shen, 2005, 2006; Wang et al., 2007). The focus later
we presented a sketch-based interface for semi-automatic stream shifted to statistical, correlation, importance, and influence anal-
surface generation (Tao and Wang, 2016, 2018). The VisLab is ysis and visualization (Wang and Ma, 2008; Wang et al., 2008;
developing a machine learning assisted visual analytics approach Sukharev et al., 2009; Gu and Wang, 2010; Chen et al., 2011;
for understanding 3D complex flow surfaces. Leveraging tech- Wang et al., 2011) as well as transforming the high-dimensional
niques from deep learning, shape analysis, and visual analytics, spatiotemporal data into abstract views for visual reasoning, min-
we aim to develop a new framework that supports (1) selection of ing, and analytics (Gu and Wang, 2011, 2013; Gu et al., 2016;
representative surfaces through feature learning, projection, and Tao et al., 2016a). The VisLab is investigating representative se-
clustering powered by GNNs, (2) exploration of surface patterns lection for summarizing isosurfaces, time steps, and variables to
via a principled vocabulary-based method for shape-invariant support effective visual exploration and understanding of large-
partial flow surface querying and matching, and (3) comparative scale time-varying multivariate data sets (Imre et al., 2017, 2018;
analytics of flow surfaces for studying seeding sensitivity via a Tao et al., 2019; Porter et al., 2019). Deep learning techniques for
river-like visual metaphor. representation learning will be employed in this study.
2.4. Visual analytics
2.3. Time-varying multivariate data visualization
Visual analytics enables analytical reasoning facilitated by in-
Many scientific simulations produce time-varying multivariate teractive visual interfaces and gains popularity as the fastest-
volume data that can span hundreds or thousands of time steps growing branch of visualization research because it applies to a
and consist of tens of variables. Additionally, ensemble data sets wide variety of domains and applications. Since 2015, the VisLab
are common nowadays, where a simulation is conducted in multi- has applied visual analytics techniques to explore large image and
ple runs with different configurations. This leads to the multiplied text collections (Gu et al., 2015, 2017a), eye-tracking data (Gu
amount of data to be studied. Understanding the underlying et al., 2017b), global ocean shipping networks (Tao et al., 2017),
physical phenomena in this kind of data often requires key in- conference navigator data (Bailey et al., 2018), course clickstream
sights to be discovered through observations. This need places and student performance data (Goulden et al., 2019; Deng et al.,
analysis and visualization of time-varying multivariate data at 2019), and ant movement data (Hu et al., 2020). Fig. 4 shows
the heart of scientific visualization. Fig. 3 shows examples of examples of our visual analytics research works.
time-varying multivariate data visualization generated from our Teaming up with scientists, designers, and engineers from
research. Notre Dame Learning, members of the VisLab are focusing on
65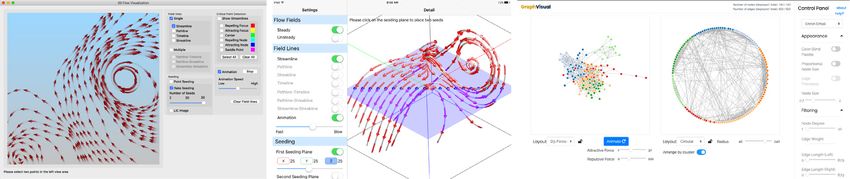
C. Wang                                                                                                                         Visual Informatics 4 (2020) 63–68

Fig. 5. The user interfaces of (a) FlowVisual desktop and (b) FlowVisual app show rake seeding for streamline tracing and animated streamline visualization in 2D
and 3D, respectively. (c) The web interface of GraphVisual shows the same graph data set in two different layouts.

learning analytics research. Our goal is twofold. First, we aim to                     • computational resources: over 25,000 CPU cores in systems
identify and help to close the academic performance gaps result-                         of various architectures and interconnects with associated
ing from disparities in student backgrounds and preparations in                          disk systems for short-term storage;
college-level science, technology, engineering, and mathematics                        • storage resources: approximately 3 PB of data storage in-
(STEM) gateway courses. Second, we aim to analyze the impact                             cluding disk-based systems for high-performance and user-
of STEM gateway course performance on downstream required                                space storage of data and tape-based systems for long-term
courses and identify common pathways to academic success.                                storage;
The research outcome is expected to benefit major stakeholders,                        • specialized resources: visualization systems, systems for vir-
including students, instructors, advisors, and administrators.                           tual hosting, prototype architectures, and infrastructure for
                                                                                         high-throughput computing; and
2.5. Visualization in education                                                        • access and interface to the TeraGrid and Open Science Grid.
                                                                                       Prof. Wang is a co-PI of an NSF CRI grant in which we re-
    Visualization has become an indispensable means for analyz-                     quested a GPU cluster for computer science research. The first
ing data generated from a wide variety of applications that span                    version of the cluster has been up and running since October
many STEM fields. As more and more colleges and universities                        2016, which includes
pay attention to research and education in data science and
human-centered computing, adding a new course of Data Visual-                          • eight Quantum TXR231-1000R servers with dual Intel Xeon
ization into the curricula becomes a growing trend. Following this                       12-core CPU E5-2650 v4 @ 2.20 GHz, 128 GB RAM, and four
trend is a significant need for high-quality curriculum materials                        NVIDIA Titan Xp GPU accelerators;
that can assist in teaching visualization knowledge and train-                         • eight Quantum TXR231-1000R servers with dual Intel Xeon
ing the STEM workforce for tomorrow. Although visualization                              12-core CPU E5-2650 v4 @ 2.20 GHz, 128 GB RAM, and four
research has advanced for 30 years, visualization education has                          NVIDIA Tesla P100 GPU accelerators.
lagged: visualization textbooks only started to emerge in the past
                                                                                    The Fall 2018 upgrade includes three NVIDIA Titan Xp and two
decade, and pedagogical software tools that assist the teaching
                                                                                    NVIDIA Tesla V100 GPU accelerators, further boosting the per-
and learning of data visualization are scarce.
                                                                                    formance of deep learning algorithms. The GPU cluster has led
    Along the direction of visualization in education, the Vis-
                                                                                    to transformative research in computer science by enabling the
Lab’s research is to develop the VisVisual software toolkit (Anon,
                                                                                    discovery of novel algorithms and methods previously inaccessi-
2020b) for teaching and learning important yet challenging visu-                    ble, incubating new research projects, and enhancing multidisci-
alization concepts and algorithms. The proposed toolkit consists                    plinary collaboration between computer scientists and their peers
of four tools: VolumeVisual, FlowVisual, GraphVisual, and TreeVi-                   in other disciplines. Members of the VisLab are active users of this
sual. Together they cover scalar and vector field visualization in                  GPU cluster.
scientific visualization and graph and tree drawing in information
visualization. The pilot FlowVisual tool (Wang et al., 2013, 2016)                  4. International collaborations
has proven successful: since 2013, the website has been visited
22,000+ times, and the tool has been downloaded 1700+ times.                            The VisLab has received support from Notre Dame’s Luksic
Fig. 5(a) and (b) show the interfaces of FlowVisual desktop and                     Family Collaboration Grant Program, Global Collaboration Initia-
app versions. GraphVisual (Imre et al., 2020) has recently com-                     tive Program, and Asia Research Collaboration Grant Program.
pleted its development and deployment. Fig. 5(c) shows the web                      Members of the VisLab have collaborated with oversea institu-
interface of GraphVisual. The VisLab is developing VolumeVisual                     tions, including the Pontifical Catholic University of Chile, the Chi-
and TreeVisual.                                                                     nese Academy of Sciences, Zhejiang University, Shandong Univer-
                                                                                    sity, Sun Yat-sen University, and Technical University of Munich.
3. Facilities                                                                       These collaborative efforts have led to 13 papers (11 published,
                                                                                    two under review). Since 2016, the VisLab has hosted 20 under-
   Members of the VisLab have access to Notre Dame’s Center                         graduate students from leading universities in China and Ireland
for Research Computing (CRC). The CRC is a member of the Open                       for various summer research projects through Notre Dame’s In-
Science Grid and is home to the Northwest Indiana Computational                     ternational Summer Undergraduate Research Experience (iSURE)
Grid—a consortium of research institutions including Argonne Na-                    Program and Naughton Fellowships Program. These joint efforts
tional Laboratory, Purdue University, and the University of Notre                   have led to ten papers (eight published including one award-
Dame. The CRC provides the following services and resources in                      winning paper, two under review). Many of these undergraduate
support of research and education within Notre Dame and the                         students later pursued their graduate study and research at pres-
local community:                                                                    tigious universities such as Carnegie Mellon University, Columbia
                                                                               66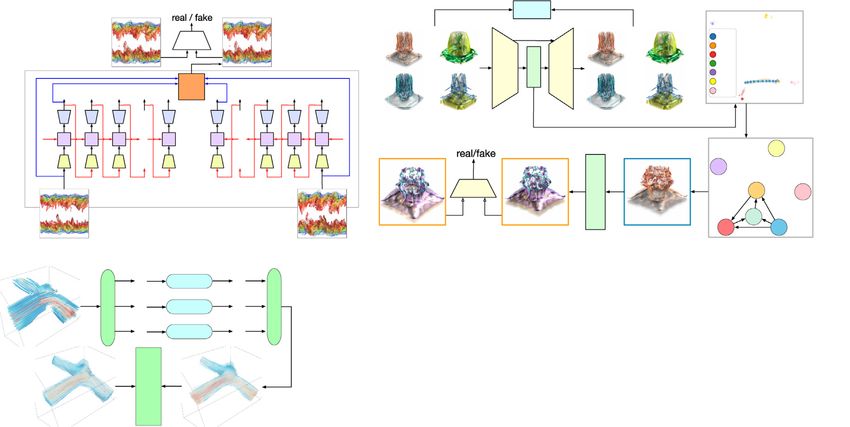
C. Wang                                                                                                                                          Visual Informatics 4 (2020) 63–68

University, University of California, Berkeley, University of Cam-                            Hu, T., Zheng, H., Liang, C., Zhu, S., Imirzian, N., Zhang, Y., Wang, C., Hughes, D.P.,
bridge, University of Illinois at Urbana–Champaign, University of                                  Chen, D.Z., 2020. Antvis: A web-based visual analytics tool for exploring ant
Southern California, and University of Wisconsin–Madison.                                          movement data. Vis. Inf. 40 (1), 58–70.
                                                                                              Imre, M., Chang, W., Wang, S., Trinter, C.P., Wang, C., 2020. GraphVisual: Design
                                                                                                   and evaluation of a web-based visualization tool for teaching and learning
Declaration of competing interest                                                                  graph visualization. In: Proceedings of American Society for Engineering
                                                                                                   Education Annual Conference, pp. 28.501.1–28.501.15.
    The authors declare that they have no known competing finan-                              Imre, M., Tao, J., Wang, C., 2017. Efficient GPU-accelerated computation of
cial interests or personal relationships that could have appeared                                  isosurface similarity maps. In: Proceedings of IEEE Pacific Visualization
                                                                                                   Symposium. Visualization Notes. pp. 180–184.
to influence the work reported in this paper.                                                 Imre, M., Tao, J., Wang, C., 2018. Identifying nearly equally spaced isosurfaces
                                                                                                   for volumetric data sets. Comput. Graph. 72, 82–97.
Acknowledgments                                                                               Li, Y., Wang, C., Shene, C.-K., 2014. Streamline similarity analysis using bag-of-
                                                                                                   features. In: Proceedings of IS&T/SPIE Conference on Visualization and Data
   The research works described in this article have been sup-                                     Analysis. pp. 90170N–1–90170N–12.
                                                                                              Li, Y., Wang, C., Shene, C.-K., 2015. Extracting flow features via supervised
ported by the U.S. National Science Foundation through grants IIS-                                 streamline segmentation. Comput. Graph. 52, 79–92.
1017935, CNS-1229297, IIS-1456763, IIS-1455886, CNS-1629914,                                  Ma, J., Tao, J., Wang, C., Li, C., Shene, C.-K., Kim, S.H., 2019. Moving with the
DUE-1833129, and IIS-1955395.                                                                      flow: An automatic tour of unsteady flow fields. J. Vis. 22 (6), 1125–1144.
                                                                                              Ma, J., Walker, J., Wang, C., Kuhl, S.A., Shene, C.-K., 2014b. FlowTour: An
References                                                                                         automatic guide for exploring internal flow features. In: Proceedings of IEEE
                                                                                                   Pacific Visualization Symposium. pp. 25–32.
                                                                                              Ma, J., Wang, C., Shene, C.-K., 2013. Coherent view-dependent streamline selec-
Anon, 2020a. CSrankings: Computer science rankings. http://csrankings.org/.
                                                                                                   tion for importance-driven flow visualization. In: Proceedings of IS&T/SPIE
Anon, 2020b. VisVisual. https://sites.nd.edu/chaoli-wang/visvisual/.
                                                                                                   Conference on Visualization and Data Analysis. pp. 865407–1–865407–15.
Bailey, S.M., Wei, J.A., Wang, C., Parra, D., Brusilovsky, P., 2018. CNVis: A
                                                                                              Ma, J., Wang, C., Shene, C.-K., 2013. FlowGraph: A compound hierarchical
    web-based visual analytics tool for exploring conference navigator data.
                                                                                                   graph for flow field exploration. In: Proceedings of IEEE Pacific Visualization
    In: Proceedings of IS&T Conference on Visualization and Data Analysis. pp.
                                                                                                   Symposium. pp. 233–240.
    376–1–376–11.
                                                                                              Ma, J., Wang, C., Shene, C.-K., Jiang, J., 2014a. A graph-based interface for visual
Chen, C.-K., Wang, C., Ma, K.-L., Wittenberg, A.T., 2011. Static correlation
                                                                                                   analytics of 3D streamlines and pathlines. IEEE Trans. Vis. Comput. Graphics
    visualization for large time-varying volume data. In: Proceedings of IEEE
                                                                                                   20 (8), 1127–1140.
    Pacific Visualization Symposium. pp. 27–34.                                               Porter, W.P., Xing, Y., von Ohlen, B.R., Han, J., Wang, C., 2019. A deep learning
Deng, H., Wang, X., Guo, Z., Decker, A., Duan, X., Wang, C., Ambrose, G.A.,                        approach to selecting representative time steps for time-varying multivariate
    Abbott, K., 2019. Performancevis: Visual analytics of student performance                      data. In: Proceedings of IEEE VIS Conference (Short Papers). pp. 131–135.
    data from an introductory chemistry course. Vis. Inf. 3 (4), 166–176.                     Sukharev, J., Wang, C., Ma, K.-L., Wittenberg, A.T., 2009. Correlation study of
Goulden, M.C., Gronda, E., Yang, Y., Zhang, Z., Tao, J., Wang, C., Duan, X.,                       time-varying multivariate climate data sets. In: Proceedings of IEEE Pacific
    Ambrose, G.A., Abbott, K., Miller, P., 2019. CCVis: Visual analytics of student                Visualization Symposium. pp. 161–168.
    online learning behaviors using course clickstream data. In: Proceedings of               Tao, J., Huang, X., Qiu, F., Wang, C., Jiang, J., Shene, C.-K., Zhao, Y., Yu, D., 2016a.
    IS&T Conference on Visualization and Data Analysis. pp. 681–1–681–12.                          VesselMap: A web interface to explore multivariate vascular data. Comput.
Gu, Y., Wang, C., 2010. A study of hierarchical correlation clustering for                         Graph. 59, 79–92.
    scientific volume data. In: Proceedings of International Symposium on Visual              Tao, J., Imre, M., Wang, C., Chawla, N.V., Guo, H., Sever, G., Kim, S.H., 2019.
    Computing. pp. 437–446.                                                                        Exploring time-varying multivariate volume data using matrix of isosurface
Gu, Y., Wang, C., 2011. Transgraph: Hierarchical exploration of transition rela-                   similarity maps. IEEE Trans. Vis. Comput. Graphics 25 (1), 1236–1245.
    tionships in time-varying volumetric data. IEEE Trans. Vis. Comput. Graphics              Tao, J., Ma, J., Wang, C., Shene, C.-K., 2013. A unified approach to streamline
    17 (12), 2015–2024.                                                                            selection and viewpoint selection for 3D flow visualization. IEEE Trans. Vis.
Gu, Y., Wang, C., 2013. iTree: Exploring time-varying data using indexable tree.                   Comput. Graphics 19 (3), 393–406.
    In: Proceedings of IEEE Pacific Visualization Symposium. pp. 137–144.                     Tao, J., Wang, C., 2016. Peeling the flow: A sketch-based interface to generate
Gu, Y., Wang, C., Bixler, R., D’Mello, S., 2017b. ETGraph: A graph-based approach                  stream surfaces. In: Proceedings of ACM SIGGRAPH Asia Symposium on
    for visual analytics of eye-tracking data. Comput. Graph. 62 (1), 1–14.                        Visualization. pp. 14–1–14–8.
Gu, Y., Wang, C., Ma, J., Nemiroff, R.J., Kao, D.L., 2015. iGraph: A graph-                   Tao, J., Wang, C., 2018. Semi-automatic generation of stream surfaces via
    based technique for visual analytics of image and text collections. In:                        sketching. IEEE Trans. Vis. Comput. Graphics 24 (9), 2622–2635.
    Proceedings of IS&T/SPIE Conference on Visualization and Data Analysis. pp.               Tao, J., Wang, C., Chawla, N.V., Shi, L., Kim, S.H., 2018. Semantic flow graph: A
    939708–1–939708–15.                                                                            framework for discovering object relationships in flow fields. IEEE Trans. Vis.
Gu, Y., Wang, C., Ma, J., Nemiroff, R.J., Kao, D.L., Parra, D., 2017a. Visualization               Comput. Graphics 24 (12), 3200–3213.
    and recommendation of large image and text collections toward effective                   Tao, J., Wang, C., Shene, C.-K., 2014. FlowString: Partial streamline matching
    sensemaking. Inf. Vis. 16 (1), 21–47.                                                          using shape invariant similarity measure for exploratory flow visualization.
Gu, Y., Wang, C., Peterka, T., Jacob, R., Kim, S.H., 2016. Mining graphs for under-                In: Proceedings of IEEE Pacific Visualization Symposium. pp. 9–16.
    standing time-varying volumetric data. IEEE Trans. Vis. Comput. Graphics 22               Tao, J., Wang, C., Shene, C.-K., Kim, S.H., 2014b. A deformation framework for
    (1), 965–974.                                                                                  focus+context flow visualization. IEEE Trans. Vis. Comput. Graphics 20 (1),
Guo, L., Ye, S., Han, J., Zheng, H., Gao, H., Chen, D.Z., Wang, J.-X., Wang, C.,                   42–55.
    2020. SSR-VFD: Spatial super-resolution for vector field data analysis and                Tao, J., Wang, C., Shene, C.-K., Shaw, R.A., 2016b. A vocabulary approach to
    visualization. In: Proceedings of IEEE Pacific Visualization Symposium. pp.                    partial streamline matching and exploratory flow visualization. IEEE Trans.
    71–80.                                                                                         Vis. Comput. Graphics 22 (5), 1503–1516.
Han, J., Tao, J., Wang, C., 2020. FlowNet: A deep learning framework for clustering           Tao, J., Xu, J., Wang, C., Chawla, N.V., 2017. HoNVis: Visualizing and explor-
    and selection of streamlines and stream surfaces. IEEE Trans. Vis. Comput.                     ing higher-order networks. In: Proceedings of IEEE Pacific Visualization
    Graphics 26 (4), 1732–1744.                                                                    Symposium. pp. 1–10.
Han, J., Tao, J., Zheng, H., Guo, H., Chen, D.Z., Wang, C., 2019. Flow field reduction        Wang, C., Gao, J., Li, L., Shen, H.-W., 2005. A multiresolution volume rendering
    via reconstructing vector data from 3D streamlines using deep learning. IEEE                   framework for large-scale time-varying data visualization. In: Proceedings of
    Comput. Graph. Appl. 39 (4), 54–67.                                                            Eurographics/IEEE VGTC Workshop on Volume Graphics. pp. 11–19.
Han, J., Wang, C., 2020a. TSR-TVD: Temporal super-resolution for time-varying                 Wang, C., Garcia, A., Shen, H.-W., 2007. Interactive level-of-detail selection using
    data analysis and visualization. IEEE Trans. Vis. Comput. Graphics 26 (1),                     image-based quality metric for large volume visualization. IEEE Trans. Vis.
    205–215.                                                                                       Comput. Graphics 13 (1), 122–134.
Han, J., Wang, C., 2020b. SSR-TVD: Spatial super-resolution for time-varying data             Wang, C., Ma, K.-L., 2008. A statistical approach to volume data quality
    analysis and visualization. IEEE Trans. Vis. Comput. Graphics Under Minor                      assessment. IEEE Trans. Vis. Comput. Graphics 14 (3), 590–602.
    Revision.                                                                                 Wang, C., Shen, H.-W., 2004. A Framework for Rendering Large Time-Varying
Han, J., Zheng, H., Xing, Y., Chen, D.Z., Wang, C., 2021. V2V: A deep learning                     Data Using Wavelet-Based Time-Space Partitioning (WTSP) Tree. Tech. Rep.,
    approach to variable-to-variable selection and translation for multivariate                    (OSU-CISRC-1/04-TR05), Department of Computer and Information Science,
    time-varying data. IEEE Trans. Vis. Comput. Graphics 27 (2) (in press).                        The Ohio State University.

                                                                                         67
C. Wang                                                                                                                                Visual Informatics 4 (2020) 63–68

Wang, C., Shen, H.-W., 2005. Hierarchical navigation interface: Leveraging mul-         Wang, M., Tao, J., Wang, C., Shene, C.-K., Kim, S.H., 2013. FlowVisual: Design
  tiple coordinated views for level-of-detail multiresolution volume rendering            and evaluation of a visualization tool for teaching 2D flow field concepts.
  of large scientific data sets. In: Proceedings of International Conference on           In: Proceedings of American Society for Engineering Education Annual
  Information Visualisation. pp. 259–267.                                                 Conference. pp. 23.609.1–23.609.20.
Wang, C., Shen, H.-W., 2006. LOD map - a visual interface for navigating                Wang, C., Yu, H., Grout, R.W., Ma, K.-L., Chen, J.H., 2011. Analyzing information
  multiresolution volume visualization. IEEE Trans. Vis. Comput. Graphics 12              transfer in time-varying multivariate data. In: Proceedings of IEEE Pacific
  (5), 1029–1036.                                                                         Visualization Symposium. pp. 99–106.
Wang, M., Tao, J., Ma, J., Shen, Y., Wang, C., 2016. FlowVisual: A visualization        Wang, C., Yu, H., Ma, K.-L., 2008. Importance-driven time-varying data
  app for teaching and understanding 3D flow field concepts. In: Proceedings              visualization. IEEE Trans. Vis. Comput. Graphics 14 (6), 1547–1554.
  of IS&T Conference on Visualization and Data Analysis. pp. 476–1–476–10.

                                                                                   68
You can also read