Water and Climate Update - September 16, 2021
←
→
Page content transcription
If your browser does not render page correctly, please read the page content below

Water and Climate Update
                                                                 September 16, 2021
The Natural Resources Conservation Service produces this weekly report using data and products from the National
Water and Climate Center and other agencies. The report focuses on seasonal snowpack, precipitation, temperature,
and drought conditions in the U.S.

Precipitation ............................................................... 2    Other Climatic and Water Supply Indicators ............ 12
Temperature............................................................... 6       More Information ...................................................... 18
Drought ...................................................................... 8

                  Drought and water shortages continue in the West

Per the U.S. Drought Monitor West Summary for September 16:

             “…Most areas of the West had no change in the drought depiction; however, changes in the
             Northwest were a mix of slight improvement and minor degradation, mostly due to assessment of
             earlier precipitation events, water-supply reports, and vegetation health. According to the U.S.
             Department of Agriculture, topsoil moisture was rated 100% very short to short on September 12 in
             Washington, followed by 96% in Montana, 85% in California, 83% in Oregon, 79% in Wyoming, and
             73% in Idaho. Meanwhile, USDA reported that at least one-half of the acreage devoted to rangeland
             and pastures was rated in very poor to poor condition is [sic] eight of the eleven Western States, led
             by Washington (96%), Montana (88%), and Oregon (87%). At the end of August, California’s 154
             intrastate reservoirs contained 13.8 million acre-feet of water, just 60% of average for the date.
             Preliminary reports indicated that statewide reservoir holdings were less than one-half of the end-of-
             August average in Nevada, New Mexico, and Oregon.”

Related:
The West’s historic drought in 3 maps – Mercury News (CA)
Drought haves, have-nots test how to share water in the West – Associated Press
Utah’s water outlook slightly improved, but West remains in grip of long-term drought – The Salt Lake Tribune
(UT)
Montana farmers and ranchers face low yields, hay shortages in drought year – Bozeman Daily Chronicle (MT)
Petaluma enters Stage 4 water emergency amid drought concerns – Santa Rosa Press Democrat (CA)
Drought drying Carson River hits Nevada pastures, ranchers – Las Vegas Sun (NV)
Idaho has been hit by a tough drought. How do dry conditions impact local fisheries? – Idaho Statesman (ID)
Drought hit Washington hard and fast. Here’s what it has meant for farmers, wildfires – The Seattle Times (WA)
Washington Logs One Of Its Driest Stretches On Record – Patch.com (WA)

           The Natural Resources Conservation Service provides leadership in a partnership effort to help people
                         conserve, maintain, and improve our natural resources and environment.
Water and Climate Update

 Precipitation

Last 7 Days, NRCS SNOTEL Network
                                                      7-day precipitation
                                                      percent of average
                                                      map

                                                      See also:
                                                      7-day total precipitation
                                                      values (inches) map

 Alaska 7-day
 precipitation
 percent of
 average map

 See also:
 Alaska 7-day
 total
 precipitation
 values (inches)
 map

9/16/2021                                                             Page 2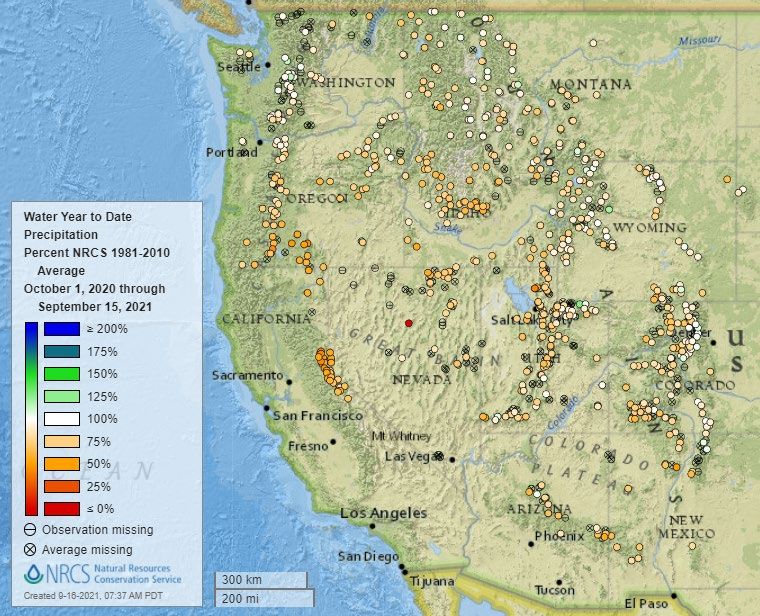
Water and Climate Update

Last 7 Days, National Weather Service (NWS) Networks
Source: Regional Climate Centers

 7-day precipitation
 percent of normal
 map for the
 continental U.S.

 See also: 7-day
 total precipitation
 values (inches)
 map

Last 7 Days, National Weather Service (NWS) Networks
Source: Regional Climate Centers

7-day precipitation
anomaly map for
Alaska.

See also:
7-day total
precipitation
values (inches) map

9/16/2021                                                     Page 3

Water and Climate Update

Month-to-Date, All Available Data Including SNOTEL and NWS Networks
Source: PRISM

                                                              Month-to-date national
                                                              total precipitation
                                                              anomaly map

Last 3 Months, All Available Data Including SNOTEL and NWS Networks
Source: PRISM

 June through
 August 2021
 precipitation
 anomaly map

9/16/2021                                                                Page 4
Water and Climate Update

 Water Year-to-Date, NRCS SNOTEL Network
                                                      2021 water
                                                      year-to-date
                                                      precipitation
                                                      percent of
                                                      average map

                                                      See also:
                                                      2021
                                                      water year-to-
                                                      date
                                                      precipitation
                                                      values (inches)
                                                      map

                                                      Alaska 2021
                                                      water year-
                                                      to-date
                                                      precipitation
                                                      percent of
                                                      average
                                                      map

                                                      See also:
                                                      Alaska 2021
                                                      water year-to-
                                                      date
                                                      precipitation
                                                      values (inches)
                                                      map

9/16/2021                                                 Page 5
Water and Climate Update

 Temperature
Last 7 Days, National Weather Service (NWS) Networks
Source: Regional Climate Centers

7-day temperature
anomaly map for the
contiguous U.S.

See also: 7-day
temperature (° F)
map

Last 7 Days, National Weather Service (NWS) Networks
Source: Regional Climate Centers

7-day temperature
anomaly map for
Alaska.

See also:
7-day temperature
(° F) map

9/16/2021                                                     Page 6

Water and Climate Update

Month-to-Date, All Available Data Including SNOTEL and NWS Networks
Source: PRISM

 Month-to-date
 national daily
 mean
 temperature
 anomaly map

Last 3 Months, All Available Data Including SNOTEL and NWS Networks
Source: PRISM

                                                              June through August
                                                              2021 daily mean
                                                              temperature anomaly
                                                              map

9/16/2021                                                               Page 7
Water and Climate Update

 Drought

U.S. Drought Monitor                                                    U.S. Drought Portal
Source: National Drought Mitigation Center                              Source: NOAA

9/16/2021                                                                              Page 8

Water and Climate Update

Current National Drought Summary, September 16, 2021
Source: National Drought Mitigation Center

“Open weather across much of the country favored summer crop maturation and fieldwork, including harvest
efforts and winter wheat planting. By September 12, more than one-third (37 percent) of the U.S. corn was
fully mature, while 38 percent of the soybeans were dropping leaves, versus respective 5-year averages of
31 and 29 percent. Meanwhile, among the 13 major production states that have planted some winter wheat,
all except Oregon were at or ahead of the 5-year average pace. Oregon’s delay—4 percent planted, versus
7 percent on average—can be attributed to producers’ hesitancy to sow winter wheat due to drought. Rain
was observed, however, in several regions, including parts of the South and East. Portions of the Gulf Coast
region had to contend with Hurricane Nicholas, the eighth Atlantic Basin tropical cyclone to make a U.S.
landfall in 2021. Nicholas, briefly a Category 1 hurricane, moved ashore on Texas’ Matagorda Peninsula
around 12:30 am CDT on September 14, delivering heavy rain and gusty winds to the middle and upper
Texas coast. Aside from the western Gulf Coast region, some of the heaviest rain (locally 4 inches or more)
fell in northern New England, chipping away at lingering, long-term drought. Locally heavy showers also
dotted the lower Southeast, including Florida’s peninsula. Lower Southeastern rainfall was enhanced by the
arrival and passage of minimal Tropical Storm Mindy, which made landfall on St. Vincent Island, Florida, at
8:15 pm CDT on September 8. Mindy’s sustained winds were briefly near 45 mph, followed by weakening
the following day as the remnant circulation moved northeastward across northern Florida and southeastern
Georgia. Late in the drought-monitoring period, showers and thunderstorms provided some limited drought
relief in the upper Great Lakes region. Elsewhere, fleeting showers dampened some of the driest areas of
the West, temporarily aiding wildfire containment efforts. However, hot, dry weather soon returned across the
West, limiting the overall benefit of the precipitation. In fact, temperatures broadly averaged above normal
across the western half of the country.”

9/16/2021                                                                                         Page 9

Water and Climate Update

Changes in Drought Monitor Categories over Time
Source: National Drought Mitigation Center

                       1 Week                                                 1 Month

                      6 Months                                                1 Year

                Changes in drought conditions over the last 12 months for the contiguous U.S.

Highlighted Drought Resources
    •   Drought Impact Reporter
    •   Quarterly Regional Climate Impacts and Outlook
    •   U.S. Drought Portal Indicators and Monitoring
    •   U.S. Population in Drought, Weekly Comparison
    •   USDA Disaster and Drought Information

9/16/2021                                                                                       Page 10
Water and Climate Update
Wildfires: USDA Forest Service Active Fire Mapping
Highlighted
Wildfire
Resources
• National
Interagency
Fire Center
• InciWeb
Incident
Information
System
• Significant
Wildland
Fire
Potential
Outlook
9/16/2021 Page 11Water and Climate Update
Other Climatic and Water Supply Indicators
Soil Moisture
Source: NOAA National Centers for Environmental Prediction
Modeled soil moisture percentiles as of September 11, 2021
Soil Moisture Percent of Saturation
Source: NRCS SNOTEL and Soil Climate Analysis Network (SCAN)
9/16/2021 Page 12Water and Climate Update Soil Moisture Source: NRCS Soil Climate Analysis Network (SCAN) This chart shows the precipitation and soil moisture for the last 30 days at the Lind #1 SCAN site in Washington. Precipitation of 0.13 inches fell on September 10, producing a slight change in soil moisture at the -2-inch sensor. The total precipitation for the past 30 days was 0.14 inches, and the soil moisture sensors report very dry conditions at the site. Soil Moisture Data Portals • USCRN Soil Moisture • National Soil Moisture Network • NOAA Climate Prediction Center Soil Moisture • NASA Grace 9/16/2021 Page 13
Water and Climate Update

Streamflow, Drought, Flood, and Runoff
Source: U.S. Geological Survey

                        WaterWatch: Streamflow, drought, flood, and runoff conditions

Reservoir Storage

Hydromet Teacup Reservoir Depictions
Source: U.S. Bureau of Reclamation

      •     Upper Colorado
      •     Pacific Northwest/Snake/Columbia
      •     Sevier River Water, Utah
      •     Upper Missouri, Kansas, Oklahoma, Texas

9/16/2021                                                                               Page 14
Water and Climate Update
Current California Reservoir Conditions
Source: California Department of Water Resources
Current California Reservoir Conditions
9/16/2021 Page 15Water and Climate Update Agricultural Weather Highlights Author: Brad Rippey, Agricultural Meteorologist, USDA/OCE/WAOB National Outlook, Thursday, September 16, 2021: “During the next several days, loosely organized shower activity across the South could result in additional rainfall totaling 2 to 4 inches or more. Meanwhile, a fast-moving cold front across the North will be followed by a stronger system, which is due to arrive in the Pacific Northwest on Friday. During the weekend, precipitation will push eastward across the northern Rockies and southward into northern California. Five-day precipitation totals could reach 4 inches or more in coastal and favored high-elevation sites in the Pacific Northwest. By early next week, a significant storm system will emerge from the northern Rockies and cross the northern Plains, delivering widespread precipitation and high winds. In contrast, negligible precipitation will fall during the next 5 days across the nation’s southwestern quadrant, from central and southern California to the southern half of the Plains. The NWS 6- to 10-day outlook for September 21-25 call for the likelihood of below-normal temperatures from the Great Basin to northern sections of the Rockies and High Plains, while warmer-than-normal weather will prevail along and east of a line from southeastern Arizona to Minnesota. Meanwhile, below-normal precipitation across much of the western half of the U.S. should contrast with wetter-than-normal conditions in the Pacific Northwest and from the Mississippi Valley eastward, excluding the northern Atlantic States.” Weather Hazards Outlook: September 18 – 22, 2021 Source: NOAA Weather Prediction Center 9/16/2021 Page 16
Water and Climate Update

Seasonal Drought Outlook: September 16 – December 31, 2021
Source: National Weather Service

Climate Prediction Center 3-Month Outlook
Source: National Weather Service

                   Precipitation                                    Temperature

          October-November-December 2021 precipitation and temperature outlook summaries

9/16/2021                                                                                  Page 17
Water and Climate Update More Information The NRCS National Water and Climate Center publishes this weekly report. We welcome your feedback. If you have questions or comments, please contact us. 9/16/2021 Page 18
You can also read