Wave energy resources in nearshore area of Dongluo Island, Sanya - IOPscience
←
→
Page content transcription
If your browser does not render page correctly, please read the page content below
IOP Conference Series: Earth and Environmental Science

PAPER • OPEN ACCESS

Wave energy resources in nearshore area of Dongluo Island, Sanya
To cite this article: Bo Li et al 2020 IOP Conf. Ser.: Earth Environ. Sci. 467 012079

View the article online for updates and enhancements.

 This content was downloaded from IP address 176.9.8.24 on 25/04/2020 at 11:45
EEEP 2019 IOP Publishing
IOP Conf. Series: Earth and Environmental Science 467 (2020) 012079 doi:10.1088/1755-1315/467/1/012079

Wave energy resources in nearshore area of Dongluo Island,
Sanya

 Bo Li1,2,3,4, Junmin Li1,2,3,4,6, Junliang Liu1, Ping Shi1,2,3,4, Wuyang Chen1, Huanlin
 Xing1 and Gaolong Huang1,4,5
 1
 State Key Laboratory of Tropical Oceanography, South China Sea Institute of
 Oceanology, Chinese Academy of Sciences, Guangzhou 510301, China;
 2
 Southern Marine Science and Engineering Guangdong Laboratory (Guangzhou),
 Guangzhou 511458, China;
 3
 Innovation Academy of South China Sea Ecology and Environmental Engineering,
 Chinese Academy of Sciences, Guangzhou 510301, China;
 4
 Guangdong Key Laboratory of Ocean Remote Sensing, South China Sea Institute of
 Oceanology, Chinese Academy of Sciences, Guangzhou 510301, China;
 5
 University of the Chinese Academy of Sciences, Beijing 100049, China
 6
 Email: jli@scsio.ac.cn

 Abstract. Based on a bottom-mounted monitoring system, wave characteristics to the northeast
 shore of Dongluo Island, Sanya, are investigated from July 12 to August 27, 2018. Wave
 energy resources of the surveying point are evaluated. Analyses demonstrate that, during the
 observation period, the significant wave height of the surveying point lies in the range of 0.13-
 1.28 m, the peak period is 1.68-9.57 s, and the main wave direction is mainly southeast. The
 wave energy density ranges from 0.041 to 2.615 kW m-1, with a mean of 0.222 kW m-1,
 suggesting relative low wave energy. The wave energy density from southeast-east and
 southeast directions accounts for about 65.2% of the total. The significant wave height range
 from 0.2 to 0.5 m, with a period range from 4 to 9 s has prominent contributions (83.71%) to
 the total wave energy. The northwest of the South China Sea, where Dongluo Island located, is
 controlled by southwest monsoon during the observation period, and the wave from the
 southwest may be attenuated by the island during its northward propagation. The surveying
 point in this study may not be the best location for wave energy converter, which can be further
 optimized.

1. Introduction
In recent years, the development and utilization of new energy have attracted much attention. China
has a long coastline of 1.8×10⁴ km. Oceanic renewable energy resources such as wave energy resource
are abundant in China. There are many coastal islands in China, and many small islands rely mainly
on diesel engines and photovoltaic power generation. With the accelerating utilization of islands, the
vigorous development of wave energy is of great strategic significance to alleviate the energy
problems caused by the shortage of conventional energy.
 Dongluo Island (18.326°N, 108.990°E, see Figure 1a), with a small area of 0.1316 km2, is located
in the south of Sanya, Hainan. It is 3.2 km offshore from the main part of Hainan Island and 50 km
away from the urban area of Sanya. As an underdeveloped small island, there is no permanent
population at present. Diesel engines are temporarily used to generate electricity and the actual peak

 Content from this work may be used under the terms of the Creative Commons Attribution 3.0 licence. Any further distribution
 of this work must maintain attribution to the author(s) and the title of the work, journal citation and DOI.
Published under licence by IOP Publishing Ltd 1
EEEP 2019 IOP Publishing
IOP Conf. Series: Earth and Environmental Science 467 (2020) 012079 doi:10.1088/1755-1315/467/1/012079

power consumption is about 1.0 kW. In the future development, it is necessary to construct a power
generation device that can meet the requirement of at least 24 kW. Thus wave energy is considered as
one of the potential power supply modes in line with economic benefits and environmental protection
policies according to the power consumption scale of the island. In order to better design appropriate
wave energy converter (WEC), improving its working performance and prolonging its service life, it is
necessary to obtain detailed wave data to accurately evaluate wave energy resources before exploiting
and utilizing it [1-2].
 Base on modeling data, e.g. ERA40, literature has evaluated the wave energy of the South China
Sea [3-8], showing significant seasonal variability of the wave energy due to the monsoon [9].
However, the wave energy near Hainan Island and its nearby small islands was still not well
documented. Numerical model is a convenient means to obtain wave parameters and evaluate wave
energy resources [10]. However, to facilitate the construction of engineering facilities and pipeline
connections, as well as the maintenance of equipment, WEC is usually installed in shallow waters near
shore [11]. Because of the small scale and the complex topography, it is difficult for numerical models
to effectively characterize the wave elements in these areas [12-13]. Still, the observation study of the
wave energy of Dongluo Island has not been reported. For this reason, we have laid a set of bottom-
mounted wave observation system in the offshore area northeast to the island. Based on the
observation, we analyze the exploitability of wave energy resources in the sea area, mainly focus on
the evaluation indicators related to WEC design and operation. This work may provide scientific
guidance for the development and utilization of wave energy resources in the island area.

 Figure 1. Geographical positions of the Dongluo Island (black point in a) and the
 observation site of AWAC system (cross in b).

2. Data and methodology

2.1. Wave observation equipment
In this study, a Nortek acoustic wave and current profiler (AWAC) was placed at the site (cross in
Figure 1b) to obtain wave elements. The distance between the AWAC and the coastline of the island is
about 70 m. AWAC uses acoustic surface tracking firmware (AST) to measure the wave parameter.
The AST, like a standard acoustic sounder, measures a series of wave samples to obtain the wave
spectrum [14-15]. It is also equipped with a temperature sensor, a pressure sensor, a compass and a tilt,
which can automatically identify up and down. It can observe directional wave spectrum, velocity

 2
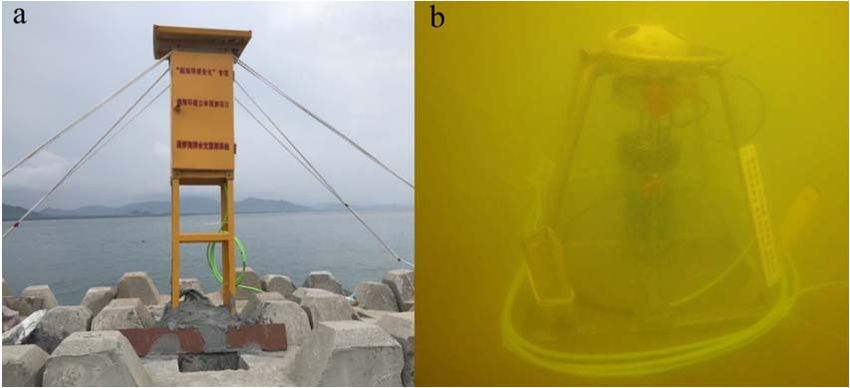
EEEP 2019 IOP Publishing
IOP Conf. Series: Earth and Environmental Science 467 (2020) 012079 doi:10.1088/1755-1315/467/1/012079

profile and tide level under harsh conditions. Because of the shallow depth (about 7.3 m) at the site, an
AWAC with a frequency of 1 MHz is adopted.
 Considering there are many fishing boats and diving tourists in the area, and the equipment and
data operations are thus very risky, the AWAC runs in an online mode for real-time monitoring.
Firstly, a shore-based operation station (Figure 2a) was established. Then, the AWAC fixed on the sea
bottom with a mounting rack (Figure 2b) was connected to the station by a cable. The station supplied
power to AWAC through solar energy and sent back data to the laboratory. The advantage of this real-
time observation system is that it can be monitored remotely. In case of an emergency such as man-
made damage, people can take action timely to protect equipment and data security.

2.2. Test settings
The AWAC was set to sample 2048 wave samples every half hour for 17 minutes. Detailed
configuration parameters for AWAC deployment are shown in Table 1. The measuring time was 46
days from 17:30, July 12 to 18:30, August 27, 2018. Through quality control, 2125 sets of observation
data were obtained.

 Figure 2. Pictures of (a) the shore-based operation station and (b) the
 bottom-mounted AWAC underwater.

 Table 1. AWAC deployment settings.
 Parameter Value Unit
 Profile interval 1800 s
 Number of cells 20 -
 Cell size 0.50 m
 Average interval 180 s
 Blanking distance 0.40 m
 Number of wave samples 2048 -
 Wave interval 1800 s

2.3. Data analysis
Wave energy density is commonly used to characterize the quantity of wave energy. In addition, the
wave energy period represents the period of a sinusoidal wave with the same energy, which has a wide
application in the wave energy assessments for electrical purposes [16-17]. In this paper, the wave
energy density of the site is estimated by using the formula proposed by Electric Power Research
Institute [18], and the wave energy period is approximately equal to the spectrum peak period [19]:
 Pm =0.42 H S2TP 1

 3
EEEP 2019 IOP Publishing IOP Conf. Series: Earth and Environmental Science 467 (2020) 012079 doi:10.1088/1755-1315/467/1/012079 2 where Pm is wave energy density (kW m-1), TE is wave energy period (s), HS is significant wave height (m) and TP is spectrum peak period (s). HS and TP are calculated directly from the wave spectrum based on AWAC observations. It is important to evaluate the stability of wave energy for the development and utilization of WEC. The more stable the wave energy is, the more advantageous it is to the acquisition and conversion of energy. In the unstable case, it is not conducive to the acquisition of energy and would even damage the WEC elsewhere. Therefore, the coefficient of variation of Pm is estimated by the formula: 1/ 2 n 2 Cv Pmi Pm / n 1 / Pm 3 i 1 where Cv is the variation coefficient of Pm, Pm is the mean of Pm, Pmi is the samples of Pm and n is the sample number of Pm. 3. Results and discussion 3.1. Observational wave parameters Wave parameters during the observation period are shown in Figure 3. The ranges of the mean wave height and HS are 0.14-0.91 m and 0.13-1.28 m, respectively (Figures 3a-b), with maximum appearing at 8:00 on July 18. Although the measured values are relatively low, it seems that there is no external factor beyond natural ocean conditions influencing the results. Because the island is undeveloped and far from the vessel channel. The accuracy of AST methods (~1% of the measured value) is high enough to measure those values. The maximum wave height confines in 0.21-2.34 m, whose maximal value can be found at 11:00 on July 18 (Figure 3c). The concurrent remarkable rises of the wave height are due to the activity of the storm nearby. It is reported that, before dawn on July 18, the tropical storm Son-Tinh made its landfall over Hainan Island [20]. During the observation period, the TP of the wave is from 1.68 to 9.57 s (Figure 3f), and the mean wave period is between 1.88 and 6.18 s (Figure 3g). There is no remarkable fluctuation of the wave periods during the passing by of the tropical storm Son-Tinh. The Pm ranges from 0.041 to 2.615 kW m-1, with a mean of 0.222 kW m-1, revealing a relatively low wave energy resources. The variation coefficient (Cv) of the Pm is calculated as 0.65, less than the value in the open ocean based on ERA-Interim data [4-5], suggesting a higher stable Pm near the Dongluo Island coast. During this summer survey, as mentioned, the tropical storm Son- Tinh was just passing by and the Pm also reflects the response of the storm well, showing a peak at 11:00 on July 18, corresponding to an HS of 1.14 m and a TP of 4.79 s. According to the spatial pattern of the Pm from existing literature [3-7], the seasonal ratios of the Pm near the south coast of Hainan Island can be estimated and averaged as 3.6: 2.1: 5.5: 6.0. Therefore, the seasonal variation and the annual average of the Pm near Dongluo Island can be estimated (Table 2). Table 2. Seasonal estimate of wave energy density (Unit: kW m-1). Season spring (MAM) summer (JJA) fall (SON) winter (DJF) annual mean Value 0.381 0.222 0.581 0.655 0.460 The main wave direction and the direction at TP both mainly distribute in 80-140° (Figures 3d, h), illustrating an east-and-southeast wave direction. Comparing to the main wave direction, the TP has more distribution of northwest direction, suggesting a probable resource of the relatively huge wave from the northwest. 4
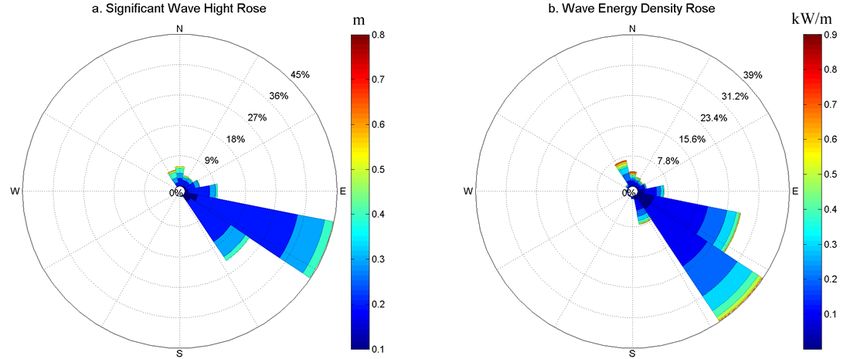
EEEP 2019 IOP Publishing
IOP Conf. Series: Earth and Environmental Science 467 (2020) 012079 doi:10.1088/1755-1315/467/1/012079

 Figure 3. Observational wave parameters.

3.2. Directional distribution of wave energy propagation
It is of great significance to make good use of wave transmission direction for improving the
conversion efficiency of WEC. Generally, the incident wave in the direction orthogonal to the WEC is
the most efficient to absorb [21]. In this paper, we use 46-day observation data to study the direction
of wave energy propagation in summer, calculating the percentage of energy distribution in all
directions, and drawing rose charts of HS and Pm (Figure 4).
 As illustrated in Figure 4a, HS near the northeast coast of Dongluo Island is mainly from the
southeast-east and southeast, the proportion of which in total direction is 69.3% (44.9% from the
southeast-east and 24.4% from the southeast). The Pm also mainly distributes in southeast and
southeast-east, accounting 65.2% (38.8% from the southeast to the east and 26.4% from the southeast)
in total direction (Figure 4b). This characteristic is beneficial for offshore or floating devices located in
the south and east side of the island, while it is disadvantageous for WEC installed near the north and
west coast of the island because the coastline may block the waves prorogation from the southeast,
which weakens the northward wave from coastal attenuation.
 In addition, the northern South China Sea is controlled by the southwest monsoon in summer, and
most of the waves in the open ocean come from the southwest [3]. Dissemination of the southwest
wave suffers from the diffraction effect around the island. In fact, the maximum wave with higher
energy generally appears in the north or northwest direction with low occurrence frequency (dark red
in Figure 4). It may be due to the fact that the measuring point faces the open sea in the north, and
there is no island shelter decreasing the wave energy from the north.

3.3. Joint distribution of wave height and period of wave energy
Based on the observation samples of 46 days, the total Pm (the cumulative average of wave power
density multiplied by hours during the whole period, kWh m-1) in the ranges of wave heights and wave
periods is counted according to HS interval of 0.1 m and TE interval of 1 s. Pm in each HS-TE unit is
calculated as a percentage of the total wave energy.
 The results are exhibited in Figure 5. The color of the rectangle represents the percentage, and the
corresponding percentage from black to light grey is 0~13%. The number indicates the sampling times
in each HS-TE unit. The wave heights and wave periods of observatories which have outstanding
contributions to the total energy range from HS: 0.2 to 0.5 m, TE: 4 to 9 s, accounting for 83.71% of the

 5
EEEP 2019 IOP Publishing
IOP Conf. Series: Earth and Environmental Science 467 (2020) 012079 doi:10.1088/1755-1315/467/1/012079

total. Among them, the highest energy percentage occurs when the wave heights and wave periods lie
in 0.2 to 0.3 m and 5 to 6 s, accounting for 12.58% of the total energy. The wave occurrence times in
this HS-TE unit during the whole observation period is 415, which is also the most-occurred times
among all ranges. The range of HS and TE, which have the most prominent contribution to total energy,
is the same as the range of wave height and wave period with the highest occurrence frequency. This
characteristic can be referenced for the design of a WEC to meet the needs of energy acquisition.

 Figure 4. Distribution roses of the significant wave height (a) and the wave energy density (b).

 Figure 5. Distributions of total wave energy density
 according to significant wave height and wave period.

4. Conclusions
In this study, a real-time observation system is proposed to effectively monitor the wave energy for
underdeveloped islands. The system was well employed at the northeast shore of Dongluo Island,
Sanya, Hainan, operated for 46 days from July 12 to August 27, 2018. According to the data obtained
during the period, the wave characteristic and energy resources near Dongluo Island in summer are
evaluated. Main conclusions are summarized as follows:

 6
EEEP 2019 IOP Publishing
IOP Conf. Series: Earth and Environmental Science 467 (2020) 012079 doi:10.1088/1755-1315/467/1/012079

 During the observation period, the significant wave height ranges from 0.13 to 1.28 m, with its
maximum peak appearing during the transit of tropical storm Son-Tinh over Hainan Island. The peak
period of wave ranges from 1.68 to 9.57 s, and the wave direction is mainly southeast. The wave
energy density ranges from 0.041 to 2.615 kW m-1, with a mean of 0.222 kW m-1, and is estimated to
be 0.460 kW m-1 on average over the year. It suggests a relatively low exploitability of the wave
energy at the surveying point. The point locates near the northeast shore of Dongluo Island, thus the
waves from the south may be attenuated by topographic shielding.
 The significant wave height and wave energy density are mainly from the southeast in general,
accounting for 69.3% and 65.2% among the total direction, respectively. This characteristic is not
beneficial for WEC installed near the northwest coast of the island, because the wave prorogation
would be blocked from the south. The result provides a basis for optimizing site selection of the WEC
in the future.
 The significant wave heights and energy periods that contribute most to the total wave energy are
0.2-0.5 m and 4-9 s, respectively. The wave energy density in this range accounts for 83.71% of the
total. The wave height and period interval with the highest percentage are also covers the largest
sampling times during the observation period, which can be referenced for the detailed design of WEC.

Acknowledgment
This study is supported by the Strategic Priority Research Program of the Chinese Academy of
Sciences (XDA13030304), the National Key Research and Development Program of China
(2017YFC1405404, 2017YFC1405402), Southern Marine Science and Engineering Guangdong
Laboratory (Guangzhou) (GML2019ZD0303, GML2019ZD0302) and Innovation Academy of South
China Sea Ecology and Environmental Engineering, Chinese Academy of Sciences (ISEE2019ZR02).

References
[1] Folley M, Whittaker T 2009 Renew. Energy 34 7
[2] Magagna D, Uihlein A 2015 International Journal of Marine Energy 11
[3] Zheng C, Zhou L 2012 Acta Energiae Solaris Sinica 33 8 (in Chinese)
[4] Wan Y, Zhang J, Meng J, Wang J 2015 Acta Oceanologica Sinica 34 9
[5] Shi H, You Z, Luo X, Hu C, Zhang P, Song Y 2017 Transactions Oceanol. Limn. 6 (in Chinese)
[6] Wang Z, Duan C, Dong S 2018 Ocean Engineering 163:58-75
[7] Wan Y, Fan C, Dai Y et al. 2018 Energies 11 398
[8] Zheng C, Xiao Z, Zhou W et al. 2018 21st Century Maritime Silk Road: A Peaceful Way
 Forward [M]. Singapore: Springer, ISBN: 978-981-10-7976-4
[9] Wyrtki K 1962 NAGA Report. Vol.2. La Jolla, California, 195
[10] Pontes M 2005 J. Offshore Mech. Arct. 127 3
[11] Johanning L, Smith G, Wolfram J. 2007 Ocean Eng. 34 14-15
[12] Rusu E, Pilar P, Soares C G 2008 Ocean Eng. 35 13
[13] Delpey M T, Ardhuin F, Collard F, Chapron B 2010 J. Geophys. Res.-Oceans 115 C12
[14] Pedersen T, Nylund S 2004 Oceans IEEE
[15] Pedersen T, Siegel E, Wood J 2006 Oceans IEEE
[16] Vicinanza D, Contestabile P, Ferrante V 2013 Renew Energy 50 506-521
[17] Caloiero T, Aristodemo F, Ferraro D A 2019 Theoretical and Applied Climatology
[18] Hagerman G, Bedard R 2003 Guidelines for preliminary estimation of power production by
 offshore wave energy conversion devices. Electric Power Research Institute
[19] Hagerman G 2001 New England wave energy resource pentential [C] // Proceeding Building
 Energy 2001. Boston
[20] Wikipedia 2018 https://en.wikipedia.org/wiki/Tropical_Storm_Son-Tinh_(2018)
[21] Wang C, Lu W 2009 Analysis methods and reserves evaluation of ocean energy resources.
 Beijing: Ocean Press 104-129

 7
You can also read