Welcome to the Science You Can Use Spring 2022 Webinar Series - Presented by: Rocky Mountain Research Station
←
→
Page content transcription
If your browser does not render page correctly, please read the page content below
Welcome to the
    Science You Can Use
Spring 2022 Webinar Series

          Presented by:
  Rocky Mountain Research Station
      The USDA is an Equal Opportunity Employer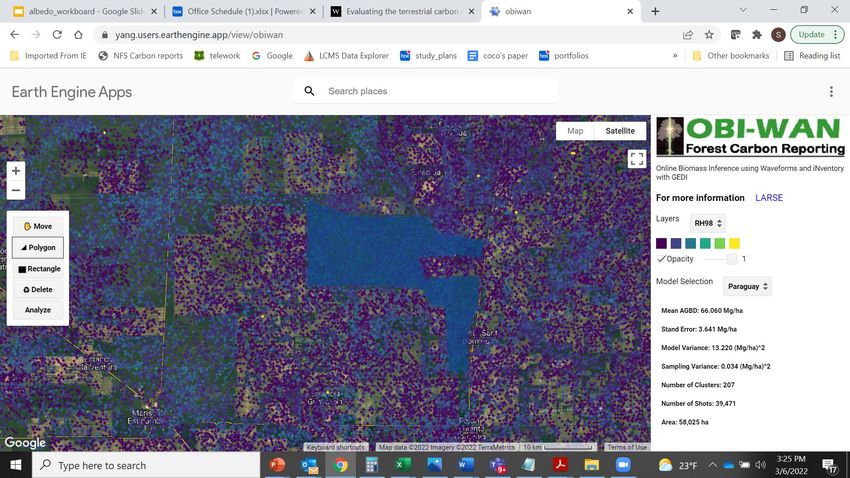
Today's Presentation
     The OBIWAN App: Estimating Property-Level
       Carbon Storage Using NASA's GEDI Lidar

     Sean Healey                                Zhiqiang Yang
sean.healey@usda.gov                      zhiqiang.yang@usda.gov

           Forest Inventory and Monitoring

              Facilitator: David Wright
               The USDA is an Equal Opportunity Employer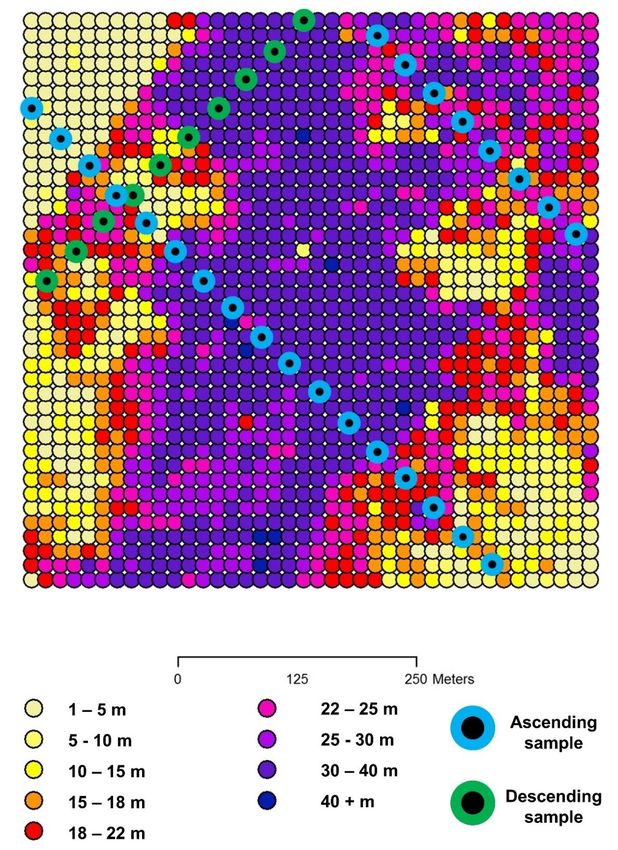
Sean Healey, Zhiqiang Yang
USFS Rocky Mountain Research Station
Why care about carbon
                                              storage at the level of a
                                                    property?

                                              • Carbon offset
                                                markets
                                              • REDD+ accounting
                                              • 2012 Planning Rule
                                                requirements for
                                                National Forest
                                                System

https://www.fs.usda.gov/sites/default/files/Carbon-Graphics-June-2019.pdf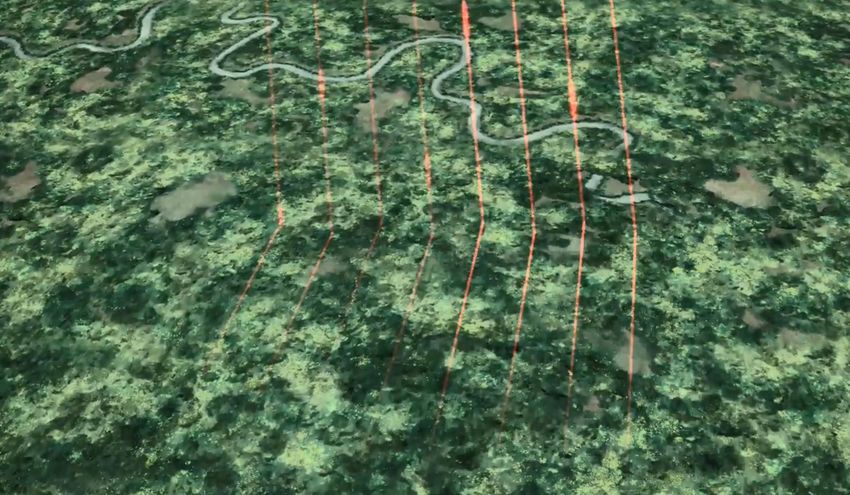
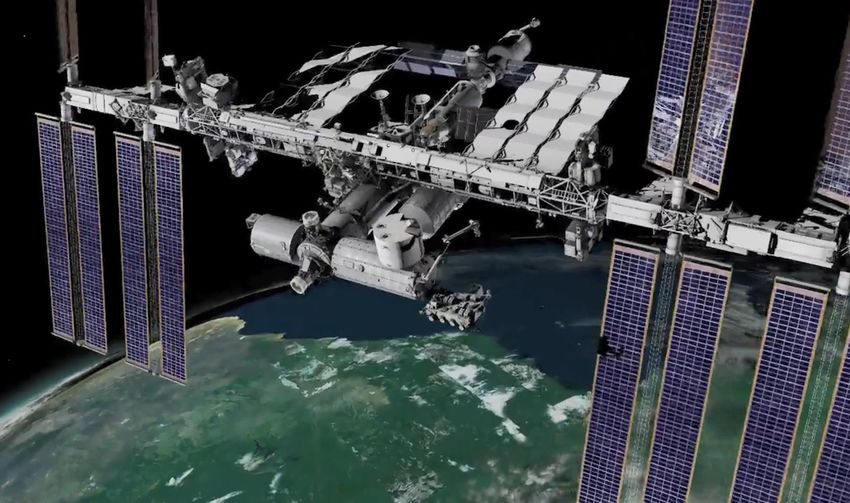
The Global Ecosystem Dynamics Investigation
                                                              (GEDI)

                                           •   Launched in December, 2018
                                           •   Operational in April, 2019
                                           •   Mounted on the ISS
                                           •   NASA Earth Venture Class Mission led by the
                                               University of Maryland (PI: Dubayah)

• Nominal 2-year mission life
• Orbit covers 51.6°N to 51.6°S
• 3 lasers providing ~20m waveform lidar
  returns
GEDI collects waveforms related
                          to the vertical profile of the
                          canopy       25 m

                    Dubayah et al. 2020. The Global Ecosystem Dynamics
9   GLOBAL ECOSYSTEMInvestigation.    Science of Remote Sensing 1 (2020): 100002.
                     DYNAMICS INVESTIGATION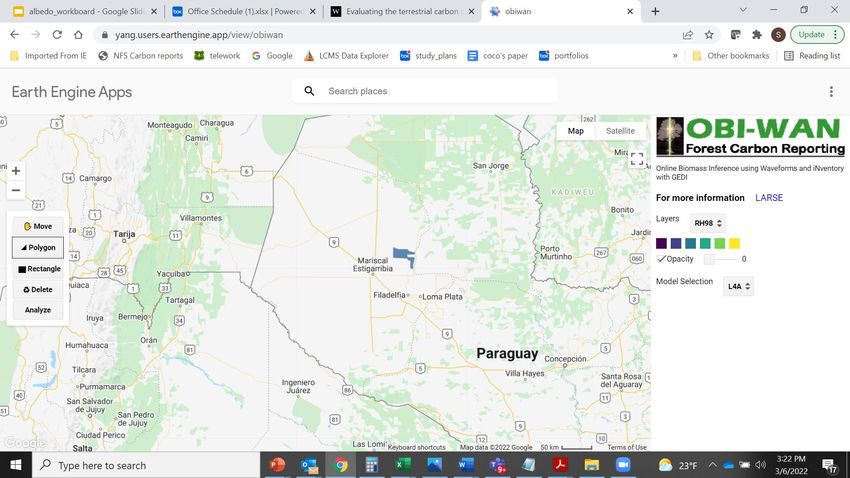
GEDI’s L4a Footprint
Biomass Products
predicts AGBD from co-
located lidar/field data

Duncanson et multi alii, 2022. Aboveground biomass density models for NASA’s Global Ecosystem Dynamics Investigation
(GEDI) lidar mission. Remote Sensing of Environment 270: 112845
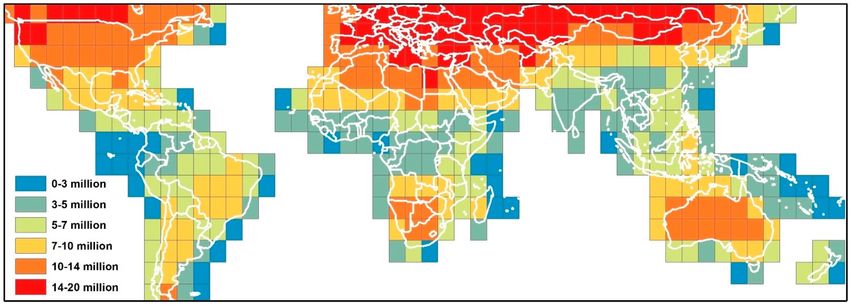
Statistical estimates of mean
biomass for 1-km grid cells
                               Baseline Requirement:
              Biomass estimates in at least 80% of the 1 km cells will be
               estimated with a standard error of less than 20% (or 20
                     Mg/ha if estimate is less than 100 Mg/ha).

  GEDI gives us a sample, so
  we use sampling theory to
  estimate mean biomass and
  uncertainty
Main estimation strategy: hybrid model-based inference Sampling uncertainty: based upon properties of the sample Model uncertainty: based upon parameter uncertainty in the model that produces biomass predictions Patterson, Healey, Ståhl, Saarela, Holm, Andersen, Dubayah, Duncanson, Hancock, Armston and Kellner (2019) "Statistical properties of hybrid estimators proposed for GEDI—NASA’s global ecosystem dynamics investigation." Environmental Research Letters 14, no. 6: 065007.
GEDI L4B
Gridded
Biomass
Product, V1
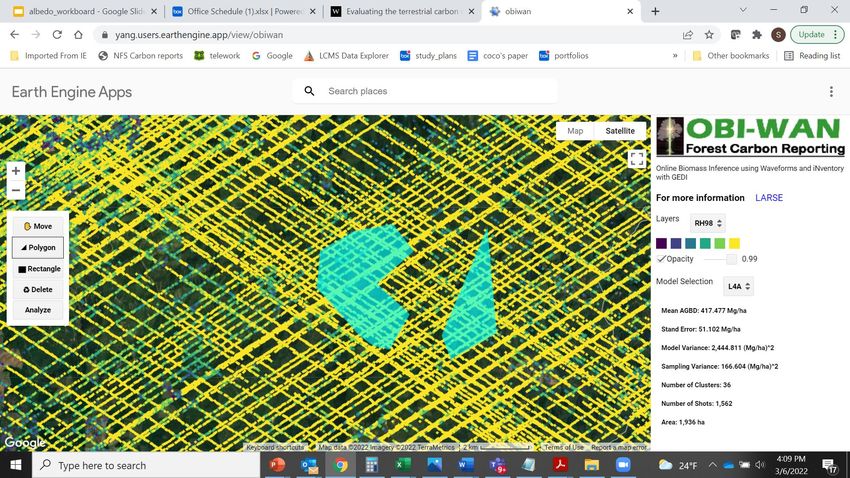
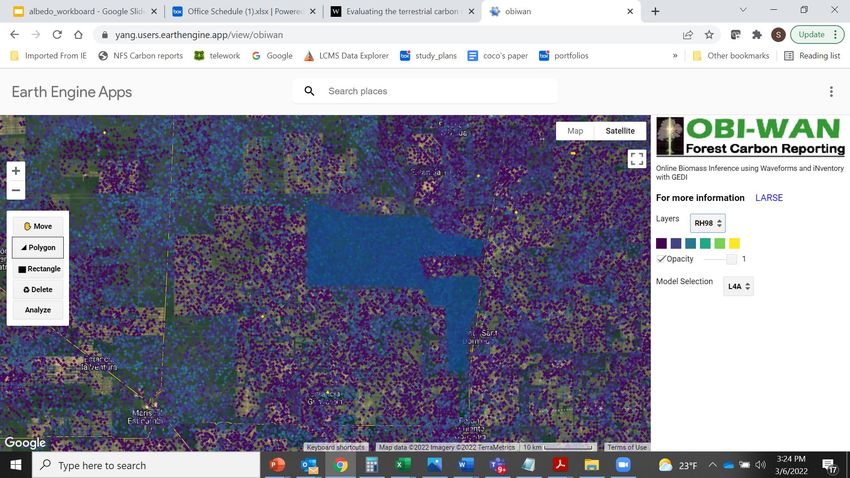
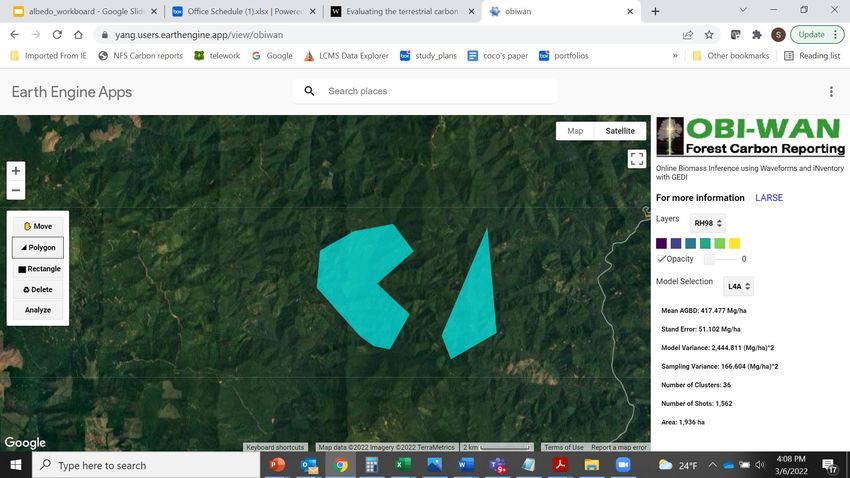
OBI-WAN
Online Biomass Inference using
Waveforms And iNventory

 How it works…
OBIWAN – New Source of
                                         Forest Emission Factors
                                         • Adapts models and statistical
                                           estimators used to create standard
                Forest                     GEDI average biomass estimates to
                                           address user-specified areas
                Reserve
                                         • Returns standardized carbon report,
                                           documenting sample properties and
                                           uncertainties
                                         • Currently limited to areas up to
                                           10,000 hectares (25,000 acres)

GEDI overpass             GEDI 1km grid cell
Google now maintains a rasterized version of the GEDI
waveform data on Earth Engine (officially released yesterday!!)
Healey et al., 2020 Remote Sensing12(17),
2840; https://doi.org/10.3390/rs12172840Why you can’t just add up pixels from your favorite biomass map • The pixel-level predictions have errors that are correlated: small differences in model parameters can affect many pixels in the same way. If the predictions aren’t independent, you can’t simply sum their uncertainties • GEDI’s approach uses an analytical approach to appropriately account for dependencies as we estimate biomass and uncertainty for a large area Where GEDI’s statistics can go wrong • GEDI uses the largest global calibration dataset ever assembled, but many areas are not well represented. If GEDI’s global biomass models don’t fit in an area, the estimates and their variances can be wrong by an unknown amount.
Why you can’t just add up pixels from your favorite biomass map
• The pixel-level predictions have errors that are correlated: small differences in model
  parameters can affect many pixels in the same way. If the predictions aren’t
  independent, you can’t simply sum their uncertainties
• GEDI’s approach uses an analytical approach to appropriately account for
  dependencies as we estimate biomass and uncertainty for a large area

Where GEDI’s statistics can go wrong
• GEDI uses the largest global calibration dataset ever assembled, but many areas are
  not well represented. If GEDI’s global biomass models don’t fit in an area, the
  estimates and their variances can be wrong by an unknown amount.
For verification purposes, it may be worthwhile
to build local modelsIf you match your field plots to nearby on-orbit GEDI data (or to simulated GEDI data from airborne lidar), you can make and use your own footprint- level biomass model.
We currently limit queries to
                                                            10,000 hectares

                                                            Different places have different
                                                            sample probabilities, which we
                                                            are still working on
                                                            accommodating
                                                                  • Orbital resonance
                                                                  • Variable cloud cover
                                                                  • Latitude

https://daac.ornl.gov/resources/workshops/esa-2021-workshop/GEDI_ESA_20210724.pdf
You can mask out non-forest from your query using
one of many land cover maps on Earth Engine
Copernicus Global Land Cover,
Collection 3
National Land Cover Dataset
Landscape Change Monitoring System
Copernicus 100-m
MODIS MCD-12
Global Forest Cover Change 30-m
Hansen Global Forest ChangeWhere are we? • OBIWAN is expected to support carbon storage verification for offset markets, voluntary contributions, sustainability assessments, REDD+ • Turning OBIWAN on will require reprocessing of GEDI data on Google Earth Engine (fixing shot id field) ~ several weeks • OBIWAN may look different if it gets a new host • OBIWAN inherits GEDI’s focus on formal inference, allowing straightforward confidence intervals
More to come!
Continue to join us
for more Science
You Can Use
Webinars this spring!
You can also read