What's Trending? Mining Topical Trends in UGC Systems with YouTube as a Case Study
←
→
Page content transcription
If your browser does not render page correctly, please read the page content below
What’s Trending? Mining Topical Trends in UGC Systems
               with YouTube as a Case Study

                      Colorado Reed                                        Todd Elvers                    Padmini Srinivasan
                      University of Iowa                                University of Iowa                    University of Iowa
                        Iowa City, IA                                     Iowa City, IA                         Iowa City, IA
                       colorado-                                todd-elvers@uiowa.edu                          padmini-
                    reed@uiowa.edu                                                                      srinivasan@uiowa.edu

ABSTRACT                                                                             has become ubiquitous in web culture through applications
User-generated content (UGC) systems such as Twitter, Face-                          including digital videos, forums, social networking, [micro]
book, and YouTube are quickly becoming the dominant form                             blogging, wikis, user-reviews, and non-commercial (open-
of information exchange on the web: shifting informational                           source) software. This UGC boom has generated immense
power from media conglomerates to individual users. Under-                           amounts of data1 . Accordingly, UGC research has evolved
standing the popularity trends in UGC content has proven                             into a vast and variegated field with areas of research ranging
problematic as traditional content popularity techniques (e.g.                       from the study of social networks and recommender systems
those developed for television) are not suited for the dis-                          to the investigation of the societal impact of microblogging
parate origins and ephemeral lifecycle of UGC. Content-                              [16, 17].
based trend detection with UGC systems has been an in-                                  An important branch of UGC research is the detection
tensely growing field of research in recent years, yet surpris-                      of popularity trends in UGC activities (posting, viewing,
ingly, there is no single method or approach that can be used                        downloading, etc.). Understanding these trends is neces-
to track and compare trends in user posts across multiple                            sary for the implementation of fast and accurate informa-
UGC sources. Therefore, in this work, we develop a standard                          tion retrieval and recommender systems, as well as for di-
system for detecting emerging trends in user posts for UGC                           rected advertising and marketing. Consequently, significant
that contains some form of textual data. We demonstrate                              research effort is being devoted to characterizing and analyz-
the use and implementation of this system through a case                             ing popularity trends for UGC systems such as Twitter[19],
study with approximately 2 million YouTube video posts.                              YouTube[10], and Digg[15]. Not surprisingly, we also see
Furthermore, to help facilitate future comparative studies in                        various commercial applications for detecting UGC posting
UGC trend analysis, we have made this system open-source                             trends, for instance, Twitter posting trends: Trendistic[27],
and straightforward to integrate with various UGC systems                            Twitscoop[28], hashtags.org[13], and Twopular [29].
(Twitter, Facebook, Flickr, Digg, Blogger, etc.).                                       Despite the fact that trend detection is a hot topic, to
                                                                                     the best of our knowledge no single method or approach ex-
                                                                                     ists to track trends for different UGC sources. Typically,
Categories and Subject Descriptors                                                   trend detection is tailored to the UGC it serves. For ex-
H.3.3 [Information Storage and Retrieval]: Information                               ample, the methods designed for analyzing Twitter posting
Search and Retrieval—Information filtering, Selection pro-                           trends cannot be readily applied to a different UGC such
cess; H.3.1 [Information Storage and Retrieval]: Con-                                as YouTube (we discuss this aspect in detail later). Thus
tent Analysis and indexing                                                           our first goal is to develop a general method for detecting
                                                                                     emergent topic trends in any UGC system, so long as the
General Terms                                                                        UGC consists of textual entries or objects accompanied by
                                                                                     textual entries in the UGC. A general trend detection sys-
Algorithm                                                                            tem will allow for a standard method of comparison across
                                                                                     various UGC services. We may then investigate why/how
1.     INTRODUCTION                                                                  emerging topics vary across different UGC systems. Our sec-
   Over the past six years, web publishing of User Generated                         ond goal in this paper is to demonstrate the application of
Content (UGC) has rapidly reshaped both the dissemina-                               our general UGC-emerging-topic-detection (ETD) through
tion and accessibility of information—shifting informational                         the detection of popularity trends in YouTube video posts,
power from traditional news sources to individuals[4]. UGC                           which is by far the preeminent source for UGC video con-
                                                                                     tent (as of March 2011, YouTube had an Alexa Rank[1] of 3,
                                                                                     behind only Google and Facebook)—specific motivation for
                                                                                     this choice of UGC is provided in the following paragraph.
Permission to make digital or hard copies of all or part of this work for               Understanding emerging popularity trends of UGC videos
personal or classroom use is granted without fee provided that copies are
not made or distributed for profit or commercial advantage and that copies           1
bear this notice and the full citation on the first page. To copy otherwise, to        In August 2010, Google CEO Eric Schmidt said that
republish, to post on servers or to redistribute to lists, requires prior specific   “every two days [humans] create as much information
permission and/or a fee.                                                             as we did from the dawn of civilization up until 2003.”
MDMKDD‘11, August 21, 2011, San Diego, CA, USA.                                      http://techcrunch.com/2010/08/04/schmidt-data.
Copyright 2011 ACM 978-1-4503-0841-0 ...$10.00.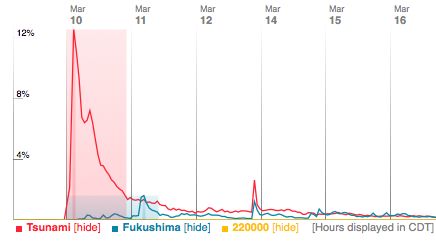
has become an important topic to both the business and             33,000 individuals) over a three month period and used the
technology domain as the number of users of these services         popularity characteristics present in the viewing patterns to
has skyrocketed in recent years (recently YouTube reported         develop a caching system that could potetially reduce the
that their website has over 3 billion views per day, see foot-     load of YouTube’s servers. [12] also examined basic statis-
note 7). Consequently, in recent years a substantial body          tics of the ≈ 600k video posts collected during this period
of research has addressed this issue (see for example [4, 5,       (average length, average video duration, and distribution of
6, 9, 10, 25]). In short, this collection of research seeks to     the video categories). In 2008, [2] used the popularity trends
answer the question: what UGC videos are people watching           of videos as well as user preferences and viewing patterns to
and why? However, the detection and analysis of emerg-             develop a video recommendation system. In the develop-
ing topics in UGC video posts remains virtually unexplored.        ment of this system, the authors investigated the co-view
The underlying question here is: what UGC videos are peo-          relationship of videos and found that using a random walk
ple posting and why?. We present an answer by analyzing            model (treating the related videos as out-links) to weight the
the textual data in YouTube video posts using our general          relationships between videos had predictive power in deter-
ETD system. To the best of our knowledge, this is both             mining the popularity lifecycle of a given video.
the first generalized UGC-ETD system and the first study              Applications in the viewing trends of YouTube videos have
of popularity trends in UGC video posts.                           also experienced significant gains in recent years in response
   Our ETD system was inspired by the work of [3] (hereby          to the massive amount of video-based UGC data available
referred to as Cataldi et. al.), who developed an ETD system       on the web. Notable applications include YouTube’s offi-
for Twitter posts. We selected this system (described in de-       cial Trends Dashboard 3 and YouTube’s official trends blog:
tail in §2) because of its ability to recognize general emerging   YouTube Trends.4 These two applications “leverage inter-
topics without requiring a priori information from the user        nal YouTube data to uncover viral videos as they become
—unlike the aforementioned commercial applications which           popular.” Viral is the term used to describe a video that be-
require a query phrase from the user. Furthermore, Cataldi         comes widely popular in a short time period through UGC-
et. al.’s system is more general than competing methods such       based websites. Neither application explains precisely how
as [30], which focuses on large scale events (natural disasters,   they determine that a specific video is becoming “trendy,”
wars, etc.), or [24], which detects emerging Twitter topics        however both sites (which appear to use the same underly-
through “retweets” (a feature specific to Twitter).                ing system) frequently cite the number of views for a video
   Despite the strengths of Cataldi et. al.’s approach, we have    in the past twenty-four hours. In our investigation we will
had to make significant changes and extensions to better suit      therefore look to uncover emerging topics in YouTube video
our goals. These are explained in detail in the following sec-     posts during twenty-four hour time periods as this should
tion, here we provide a few key examples: their methods            correspond, at least loosely, to the time period of interest
prioritize the contributions from influential users, while we      for emerging topics in YouTube video views.
treat all UGC contributors as equals; they determine the              The above applications and research are a small sample
emergence of terms based on an absolute measure of emer-           of the field of research devoted to the characterization of
gence, while we use a ranking-based strategy that depends          popularity trends in YouTube video views (see [6, 10, 25]
on the relative importance of a term in a given timeframe.         and their citations for further investigations). As preluded
Our novel contributions through this work can be summa-            in §1, there is a dearth of information regarding the popu-
rized as follows:                                                  larity trends of UGC video postings. Various works include
                                                                   basic statistics on their collected (usually crawled) YouTube
     - we create a general UGC emerging-topic recognition
                                                                   datasets: for example [6] crawled the meta-data of nearly
       system that can be readily implemented for arbitrary
                                                                   38 million YouTube video posts and provided information
       UGC types2
                                                                   about this dataset such as the most popular video post-
     - we use this system to uncover and analyze emerging          ing categories (45% of the videos are classified in either the
       topics in textual data from YouTube video posts             M usic or Entertainment category), and the temporal dis-
                                                                   tribution of video posts (daily video posting rates peak at
This paper is organized in the following way: in §2 we dis-        1 p.m., weekly video posting rates peak on Sunday). Nev-
cuss research related to our work, in §3 we provide a detailed     ertheless, a thorough investigation of related literature indi-
description of our ETD system, in §4 we address our general-       cated that the topical characteristics of YouTube video posts
ized data collection technique, in §5 we discuss our empirical     has not been previously examined.
results from a case study with YouTube data, and in §6 we             On the other hand, several applications exist for detecting
summarize this work and address future extensions.                 emerging topics in Twitter posts. The methods developed
                                                                   by Cataldi et. al. form the basis for our work as these meth-
2.    RELATED WORK                                                 ods are the most generally applicable methods found in a
   A substantial body of research has investigated viewing         survey of modern techniques. This method was shown to
trends of YouTube videos. In 2007, [4] studied the popu-           empirically reveal emerging topics in Twitter posts, such as
larity lifecycle of videos and found that the power-laws and       the five-term emerging topic {eyjafjallajökull, volcano, air-
Pareto distributions that define the popularity of YouTube         ports, iceland, close} following the 2010 eruptions of Mt.
videos are similar to non-UGC video content (i.e. NetFlix),        Eyjafjallajökull.
but that the video popularity lifetimes were much shorter.            Unfortunately, this system has several Twitter-specific fea-
Also in 2007, [12] monitored YouTube usage of students, fac-       tures and constraints that inhibit its implementation in other
ulty, and staff at the University of Calgary (approximately
2                                                                  3
 http://code.google.com/p/emerging-youtube-topics/ con-                http://www.youtube.com/trendsdashboard
                                                                   4
tains the source code for this system                                  http://youtube-trends.blogspot.com/
UGC systems: the use of a streaming API (this feature is not 2. represent each returned post, j, as a vector of terms,
available for a number of UGC APIs, including YouTube, vjI of length NtI , where NtI is the number of terms in
Flickr, and Blogger), calculation of a PageRank weight term the period of interest, I
for a given user’s post (recent API query limits make this
3. weight each entry in vjI by the max term frequency in
calculation infeasible for both Twitter and YouTube), the
provided life cycle model for a given term (the model is sus- the post multiplied by 1/NuI , where NuI is the number
ceptible to statistical fluctuations and is not a true indica- of posts made by the posting user, u, in I
tor of emerging terms for non-Twitter UGC), and the auto- 4. sum the weighted term vectors in I
mated technique for determining the set of emerging terms
(the automated clustering methods provided by Cataldi et. 5. assign a rank to each term in I, where a rank of 1 is
al. can often yield undesirable results). This system and its given to the term with the largest combined weight
constraints are discussed further in the following section. 6. model the emergence of each term in I by performing a
weighted linear regression using the rank of each term
3. DETECTING EMERGING TOPICS in the previous s time periods and then calculate the
In this section we first provide a summarized account of fraction of error between the predicted (P ) and actual
Cataldi et. al.’s system for ETD in twitter posts, and then (A) rank value in I via (P − A)/P
provide a detailed comparison to our general ETD system. 7. terms with the fraction of error close to 1 are consid-
For the rest of this work, we define an emerging topic as a ered emerging terms for time period I
set of semantically related terms that experience a sudden
increase in interest during a specific time period. 8. create a navigable directed graph, where terms repre-
sent nodes and weighted links represent the semantic
3.1 Cataldi et. al.’s System for ETD relationship between term pairs
Cataldi et. al. formulated the following process for ETD 9. extract emerging topics by locating strongly connected
with Twitter posts: components in the graph such that all of the edge
1. collect Twitter data via Twitter’s streaming API5 weights are above a given threshold and the graph con-
tains at least one emerging term
2. represent the collected Twitter posts as vectors of terms
weighted by the relative frequency of the terms Choosing a time interval, I, in which emerging topics are
3. create a directed graph of the users where an edge of interest is the first component in our system. Cataldi
from node a to node b indicates user a “follows” user et. al. studied emerging topics in Twitter posts in fifteen
b’s Twitter posts, and weight a given user’s posts by minute intervals as they were seeking to uncover breaking
his/her PageRank[20] score in this directed graph news before it was reported by news sources. As discussed
in §2, emerging YouTube viewing trends likely happen in
4. model the life cycle of each term in the Twitter post by approximately 24-hour intervals, so this seems an appropri-
subtracting the relative combined weight of the term ate interval for posting trends as well. The large difference
in previous time intervals from its combined weight in in intervals of interest between these types of UGC can be
the given time interval attributed to the frequency of user posts: 140 million Twit-
5. determine the emerging terms through a user-defined ter posts per day6 , and an estimated 100 thousand YouTube
threshold or an automated clustering-based approach posts per day.7 Therefore, it is not possible to choose a rigid
on the values obtained from the previous step time interval that is applicable to all UGC systems, and so
6. use a directed graph of the emerging terms to create a we introduce this time-interval as the first parameter in our
list of emerging topics by weighting the links between system.
the terms via a co-occurance measure A UGC post, in the context of our system, is defined as
the textual information provided by the user when post-
7. select emerging topics by locating strongly connected ing his/her content. We represent each post as a vector of
components in the graph with edge weights above a weighted terms and make no distinction between the vari-
given threshold ous fields in a given post. For example, YouTube and Flickr
In the following section, this method will be thoroughly com- posts contain three text fields (title, tags, and description),
pared with the general ETD system we develop. while Twitter posts only contain one text field.
For our system, we combine all fields into a single weighted
3.2 Generalized ETD term vector vjI , where j denotes the j th post in the time
Since our goal is to formulate a system for detecting emerg- period I. The length of all post vectors in I is NtI : the total
ing topics in general UGC systems, we describe our system number of terms from all posts in I. Each term, denoted tx ,
without specific reference to a given type of UGC. The only in post j of time-period I, denoted pIj , is weighted via:
constraint is that the UGC must contain textual data. When
tf (pIj , tx )
appropriate, we include additional details and examples spe- W (pIj , tx ) = (1)
cific to textual data from YouTube video posts. For refer- arg maxi tf (pIj , ti ) × NuI
ence, here is a condensed overview of our ETD system given where the numerator is the term frequency of tx and the de-
a time interval of interest (I): nominator is the maximum term frequency in pIj multiplied
1. use a large dictionary of broad terms to query a given 6
http://blog.twitter.com/2011/03/numbers.html
UGC system and obtain recent UGC posts 7
http://youtube-global.blogspot.com/2011/05/thanks-
5
http://dev.twitter.com/pages/streaming api youtube-community-for-two-big.htmlby the number of posts the posting user, u, made in I. If We recognize that particular studies could find counter-
tx does not appear in pIj then W (pIj , tx ) = 0. Each post can examples to our weighting system, and therefore provide one
then be represented as a vector of weighted term-scores in further justification as to why we avoided a user-authority-
the following way: based weighting scheme. Namely, that it is becoming im-
n o practical to form complete graphical representations of user
vjI = W (pIj , t1 ), W (pIj , t2 ), . . . , W (pIj , tN I ) (2) communities in various UGC services. In the past year,
t
Twitter and YouTube have decreased the number of queries
In order to justify the above term weights, which differ from allowed to their authenticated APIs, which provide infor-
the term-weights used by Cataldi et. al., we must first define mation such as the number of followers or subscribers for a
the nutrition of tIx in period I as the sum of the term’s user. Twitter allows 350 requests to this service per hour,
weights over all posts in I, or formally: and given the 170 million (and quickly growing) Twitter
NI
p
accounts, it would take around fifty years to obtain the
complete user-network needed to calculate a true PageR-
X
nutrxI = W (pIj , tx ) (3)
j=1
ank value (approximately five years for YouTube). Various
work-arounds are possible, but as our focus is on usability
where NpI is the number of posts in I. The nutrition for a across multiple UGC services, we have explicitly avoided this
term is a biological metaphor that represents the importance technique.
of a term in a given time interval—the larger the nutrition, Before finding emerging topics in I, we must first uncover
the more prevalent the term is in the given period. This emerging terms that will be used to form the root of the
biological metaphor was coined in [7] and was adopted in the topics. A term is considered emergent if it experienced a
work of Cataldi et. al. Our particular term-weighting serves significant, unexpected increase in nutrition in a given time
to mitigate the influence of individual users on determining period. We define this measure of emergence as the energy
the nutrition value of a given term. Specifically, through of the term in I—this biological metaphor was also taken
this implementation, a user can contribute a maximum of 1 from [7] and adopted in the work of Cataldi et. al. In our
to the total nutrition of a term. Also, the user’s influence is approach, the energy of a given term in I, energytIx , is de-
diminished if the user posts several times in I, which serves termined by first obtaining a predicted nutrition rank (NR)
primarily as an anti-spam measure. In brief, the provided of tx in I and calculating the fraction of error between the
term-weighting ensures that the interests of the crowd, not predicted and actual NRs via:
individuals, is apparent in the relative nutrition scores of I.
Cataldi et. al. also used the sum of term weights to deter- P I (s, tx ) − AI (tx )
energytIx = (5)
mine the nutrition scores in a given time period. Using the P I (s, tx )
same notation as above, their term weights were defined as
follows: where P (s, tx ) is the predicted NR of tx in I, s is the num-
! ber of previous time intervals to take into account for the
I tf (pIj , tx ) prediction, and AI (tx ) is the actual NR of tx in I. The
W (pj , tx ) = P R(u) 0.5 + 0.5 (4)
arg maxi tf (pIj , ti ) NR of a term is its relative rank in nutrition in the given
timeframe—where the term with the greatest nutrition in I
where P R(u) is the damped PageRank (PR) of the user will have an NR of 1, the term with second greatest nutri-
that made the Twitter post pIj . The PR algorithm is a well- tion will have a NR of 2, etc. P I (s, tx ) is then calculated by
known method used to measure the importance of a node performing a weighted linear regression on the normalized
in a directed network[20]. Cataldi et. al. used a directed NRs for the previous s time periods, obtaining a normalized
graph of the Twitter user’s followers/followings network to predicted NR for I, and multiplying this normalized NR by
calculate the PR of the posting users. the number of terms in I to determine the actual predicted
For our purposes, this weighting scheme can often create NR. The value of s, our second parameter, depends on the
undesirable nutrition scores in a given time period. For ex- type of UGC under investigation. It is important to choose
ample, say a highly-influential user (super-user) had a PR an s value that allows for an accurate prediction of the NR
value that was 1000 times the value of an average user. If while not including too large of a timeframe that could blend
the super-user made a one-word post consisting of the term distinct phases of emergence for a given term.
“cat,” then this would be equivalent to 1000 average users We used a weighted least-squared linear regression to pre-
posting the term “cat”—while in our system the collective dict the NR in I as it is a non-parametric model that can
posts of 1000 average users is 1000 times more influential be efficiently applied to a wide range of s values. In the
than a single post from one super-user. In other words, linear regression fit, we apply a 1/h weight-factor to the
Cataldi et. al.’s weighting scheme creates an oligarchy, while fit-distance of the hth previous NR value so as to bias our
we assume a democracy for ETD. Furthermore, Cataldi et. prediction towards recent NRs of the given term. The justi-
al.’s weighting is susceptible to spamming users. To con- fication for this bias is that the energy of a term in I should
tinue the above example, if the aforementioned super-user be more heavily influenced by the deviation of the term’s
made 500 posts in I consisting of the term “cat” then this nutrition from recent nutrition scores, rather than earlier
would contribute to the nutrition of “cat” 500 times more nutrition scores. We recognize that this model is limited
than 1000 users making single posts of the term “cat.” While through the assumption that the NR of a term follows a
in our system the super-user would still only contribute 1 to linear model. However, we find this assumption to yield
the nutrition of “cat” and the 1000 users would contribute reasonable results in our YouTube case study and plan to
1000. Therefore, a term in our system can only be con- explore the necessity of non-linear models in future work.
sidered important if it is popular with a large number of The fraction of error between P I (s, tx ) and AI (tx ) was
posters. chosen to represent the energy of tx in I because this def-inition favors predicted NR deviations towards the higher in a given FOM (in our case, the energy of a keyword) de-
ranked nutrition scores. For example a 10 NR deviation be- fines the boundary between the two clusters. We applied
tween a predicted NR of 100 and an actual NR of 90 yields this procedure to our YouTube dataset and found that the
an energy of (100 − 90)/100 = 0.1, while a 10 NR deviation maximum FOM change is nearly always between the high-
between a predicted NR of 20 and an actual NR of 10 yields est and second-highest energy-ranked terms: there is usually
an energy of (20 − 10)/20 = 0.5. As desired, the second one anomalous term with an energy significantly larger than
example has a greater level of emergence than the first. The the energy values of the other terms. This creates a cluster
energy has a practical range of (−NpI , 1), where positive of size one in which we are to find the mean FOM differ-
(negative) values indicate the term is more (less) popular in ence—an undefined scenario since a difference requires at
I than predicted. least two terms. In addition, using a relative FOM-difference
Using the same notation, Cataldi et. al. determined the can produce undesirable results in the selection of emerging
energy of a given term in I via: terms. For example, the last and penultimate energy-sorted
I−1 terms may have a large relative-FOM-difference, and from
(nutrtIx )2 − (nutrthx )2
the definition provided by Cataldi et. al., we should include
X
CenergytIx = (6)
I −j the term with the lowest energy in our emerging terms list:
h=I−s
clearly something that should be avoided.
where the C indicates that this is the energy formulated by Consequently, we have implemented the following auto-
Cataldi et. al. This relies on the weighted sum of the differ- mated method to determine the emerging terms:
ence of the squared nutrition values for the previous s time
intervals. A key difference between the Cenergy and energy 1. Rank all terms in I in descending order by energy
is that the Cenergy uses the absolute nutrition values of a
2. Remove all terms that have a non-positive energy
term, not the NR values. We transform nutrition values to
NR so that terms with consistently large nutritional values 3. Compute the mean and standard deviation of the pos-
would not be considered emergent due to small statistical itive distribution
variations in their nutrition.
4. Label all terms that are greater than two standard
An example we found in our YouTube post analysis was
deviations larger than the mean as emerging terms
that ubiquitous terms, such as “video,” tend to have nu-
trition values that are an order of magnitude greater than Chebyshev’s inequality places an upper bound of 25% on the
their neighbors. As a result of using the Cenergy, “video” number of terms that can have energy values larger than two
was considered emerging every Sunday simply due to the standard deviations from the mean value [14]; however, we
larger number of video posts that take place on this day[6], find that in practice the actual number of terms is usually
even though its relative importance across different time pe- around 10-50 (0.003-0.01% of the total terms in I).
riods did not change (it was consistently the most popular Once a list of emerging terms is formed for I, the final step
term). The rankspace transformation of our energy met- is to extract a set of emerging topics. To do this, we explore
ric alleviates this problem as uniform fluctuations in the semantic relationships among the terms in I using direc-
total number of posts do not change the normalized rank- tional co-occurrence as a metric, e.g. if “Obama” only ap-
ings across time intervals. Thus terms such as “video” will pears when “Barack” appears then we can say “Barack” has
not have a large energy, and consequently, are not iden- a strong semantic relationship with “Obama,” (although the
tified as emergent by our system. One could argue that converse can not directly be inferred, “Barack” may appear
the use of an appropriate stop-word list could rectify the quite frequently without “Obama”). Extracting the emerg-
Cenergy; however, this presents two problems: (1) remov- ing topics is important because they provide context for the
ing the consistently-highest-nutrition terms simply creates emerging terms. Cataldi et. al. used a weighted correlation
new high-nutrition terms that have periodic emergence, (2) vector to express a semantic relationship between terms.
this list would be unique for each UGC service, and as a Specifically, they used the following probabilistic feedback
result, make our system less general. mechanism developed in [22] to express the semantic corre-
Cataldi et. al. used both a user-defined threshold-technique lation, cIk,z , from term k to term z:
and an automated threshold-technique for determining the !
emerging terms in a given time interval. As we wish to keep nk,z / nk − nk,z
cIk,z = log
the number of parameters in our system as small as possi-
nz − nk,z / N − nz − nk + nk,z
ble, we have chosen not to implement a user-defined thresh-
nk,z nz − nk,z
old. The automated technique determines the emerging- × −
nk N − nk
term threshold in the following way:
1. Rank all terms in descending order by energy where:
- nk is the number of posts that contain k in I
2. Let max(dropI ) ≡ the maximum change in energy (drop)
between adjacent terms in the sorted list - nz is the number of posts that contain z in I
- nk,z is the number of posts that contain k and z in I
3. For all terms that are ranked before max(dropI ), com-
pute the average drop between adjacent terms - N is the number of total posts in I
Cataldi et. al. used this probabilistic metric to imitate a
4. The first drop which is higher than the computed av-
typical information retrieval problem of locating documents
erage drop defines the threshold for emerging terms
that are correlated with a user’s query. Instead of a query
This technique essentially separates a figure-of-merit (FOM) and relevant documents, however, Cataldi et. al. used a pair
ordered list into two clusters, where the maximum change of keywords where one keyword can be viewed as the queryincrease the minimal edge-weights.
4. DATA ACQUISITION
In this section we describe a data acquisition process that
may be applied to arbitrary UGC systems, allowing for fu-
ture comparative studies. We then present the specific pro-
cess used to build the dataset for our YouTube case study.
For this study, we retrieved the text contents of approxi-
mately 2.2 million YouTube videos. Acquiring all of the
YouTube video posts for a given timeframe is a challenging,
if not impossible, task for a non-YouTube affliate. There-
fore, instead of attempting to gather all of the videos for a
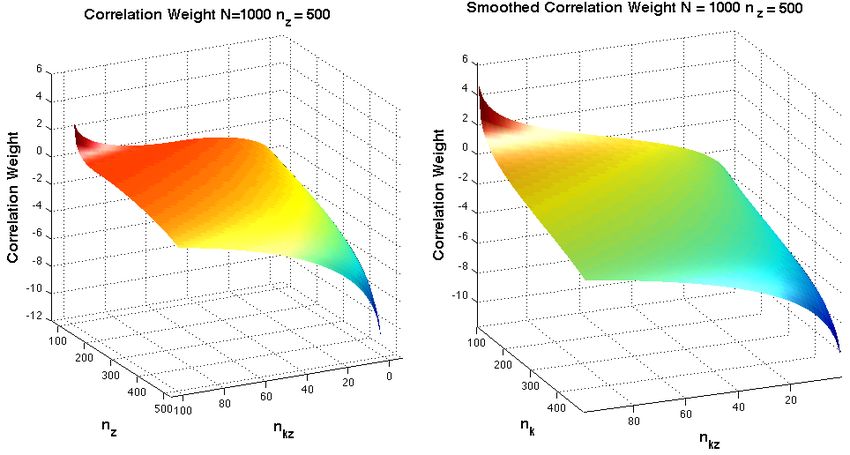
Figure 1: Standard (left) and smoothed (right) cor- given timeframe, our aim was to uniformly sample all of the
relation weight function (N = 1000, nz = 500). YouTube video posts within a given timeframe—our justi-
fication being that general background noise (non-emerging
topics, spam, etc.) will be sampled at the same rate as
and the other as a document. The correlation weight then
emerging topics, and since classification of emerging top-
represents the directed correlation between two terms rather
ics is a relative (not absolute) measure, the same emerging
than the correlation between a query and a document. Note
topics should be prevalent in a scaled dataset. We did not
that in the above equation the first term increases as the
use stop-lists, but removed all punctuation symbols, web
number of posts that contain both k and z increase, and the
addresses, and single-letter words from our dataset.
second term decreases as the number of posts that contain
We used the YouTube Data API8 (YDA) to collect our
k but not z increases. Given a term, k, it is then possible to
corpus of video posts. The YDA does not have the abil-
form a correlation vector :
ity to return a large, uniformly random sample of YouTube
cvkI = hck,1 , ck,2 , ..., ck,v i (7) video posts. Furthermore, unlike the Twitter API, YouTube
does not have a streaming-data API that returns a mixture
which is used to represent the relationship between k and all of realtime results. Twitter, YouTube, and several other
of the other |v| keywords in I. In our YouTube data analysis UGC APIs (Digg, Facebook, Blogger, Flickr) have a query
we found this to be a reliable method of inferring semantic based functionality that lets users query a particular phrase
correlations of the terms in a given period; however, we en- and obtain relevant results. We exploit this similarity to de-
countered a problem with this specific implementation as the velop a data collection method that should work consistently
correlation vector is not defined if nk,z = nk or nk,z = nz . across diverse UGC APIs. Specifically, we used the individ-
A solution to this problem was found through the smoothed ual terms from the Enron corpus[18] as query phrases in
correlation metric also introduced in [22]: the YouTube API. The Enron corpus contains 28,101 terms
! from the collection of publicly released Enron emails.
nk,z + nk /N / nz − nk,z + 1 The Enron corpus was chosen as it consists of a large num-
cIk,z = log
nk − nk,z + nk /N / (N − nk − nz + nk, z + 1) ber of broadly defined terms that return a diverse range of
UGC content. Using a particular corpus, as opposed to ran-
As can be seen in Fig. 1, the two forms of correlation have dom words chosen from a dictionary, allows for consistency
very similar shapes for a given N and nz . As is discussed across data collection periods and UGC types, an important
in [22], these correlation metrics tend to yield virtually in- requirement for comparative studies. We justify the use of
distinguishable relative rankings, and to make our system the Enron corpus in several ways. First, we found that only
as general as possible, we have used the smoothed correla- 8.8% of the 28101 terms in the Enron corpus did not return
tion metric to determine the directed semantic relationships any video results when used as a query term, and the median
between terms. number of videos returned for each term was 166 (mean 879).
After the formation of the correlation vectors, we created Using the same number of query terms randomly sampled
a directed, edge-weighted graph, G, of the emerging terms from the PubMed abstracts corpus (a corpus heavily biased
and all of the first and second order co-occuring terms. A towards scientific terminology) [11], we found that 45.2% of
first-order co-occuring term appears in the same post as the terms did not return any video results and the median
an emerging term, and a second-order co-occuring term ap- number of videos returned for each term was 1 (mean 335).
pears in the same post as one of the first-order co-occuring This test serves to show that the Enron corpus is capable of
terms. The emerging topics are then found by extracting returning a large number of videos, as opposed to a selective
the strongly-connected-components (SCCs) from G for var- subset as would be expected for a heavily biased corpus such
ious threshold values of the correlation weights, where the as PubMed.
threshold values are chosen iteratively so that each emerging We also examined the categorical distribution of the re-
term appears in at least one SCC. We then rank the SCC’s turned videos to address the possibility that the collected
by the average energy of the emerging terms in the SCC videos may be biased towards a particular category (e.g. our
and return an interactive graph to the user (see §5). Cataldi dataset could contain a disproportionate amount of M usic
et. al. included techniques for determining the minimal set videos). Each video post is assigned a predefined category
of terms in an emerging topic. Instead, we opt to keep all from the submitting user. The predefined categories for
strongly correlated terms and produce a highly interactive videos have frequently changed in recent years, as of May
graph that allows the user to explore the different relation-
8
ships in the SCCs and interactively determine whether to http://code.google.com/apis/youtube/overview.html2011 there are 18 predefined categories, in 2007 there were
14 predefined categories. The two most popular video cate-
gories, Music and Entertainment, have remained unchanged.
Using the Enron and PubMed corpuses, we collected data
on three distinct occasions and recorded the categorical dis-
tributions of the collected videos. In Table 1 we compare the
percentage of collected videos in the Music and Entertain-
ment category with the results from four previous studies
that used breadth-first crawlers to collect YouTube posts.
Our categorical distribution is in relative agreement with the
other studies, and we accept this as evidence that a broad
query based approach (supplied with terms from the Enron
corpus) can sample data at least as uniformly-random as a
breadth-first crawler.
Table 1: A categorical comparison of previous
crawler-based studies and our query-based study.
Figure 2: Top emerging topic for March 11 2011.
Data % (Ent. + Music) Size [Millions] Collect. Year
The red squares indicate emerging terms, and the
[9] 40.7 2.68 2007
directed edges indicate a high rate of co-occurance.
[8] 48.1 5.14 2008
[23] 43.04 0.81 2008
[6] 45.0 37.9 2010
enron 41.9 2.71 2011 first-hand recordings and music tributes.
pubmed 33.2 1.42 2011 Examining only the top emerging terms for March 11th,
12th, and 16th essentially provides a summary of the emerg-
The YDA does not allow for the query of videos within a ing topics: {tsunami, earthquake, japan, magnitude} indi-
specific timeframe, e.g., it is not possible to request videos cates that an earthquake and tsunami took place near Japan,
from 9/20/08 to 9/22/08. Instead, the user may restrict the {fukushima, explosion, nuclear, sendai} indicates that a nu-
video query to the following (inexact) timeframes: today, clear explosion took place near Fukushima or Sendai, and
this week, this month, all time. We collected two weeks of {sadiq, batcha, suicide, death} indicates that someone with
data using the this week parameter on 3/12/11 and 3/19/11. the name Sadiq or Batcha was involved in either a suicide or
Staying within the query confines of the YouTube API, we death. These summarized topics show that our ETD system
were able to obtain approximately 2.2 million (unique) video can recognize news events, even though the UGC medium
posts during this time frame from an estimated 40 million (YouTube) was not explicitly designed for this purpose.
(non-unique) available video posts.
Table 2: Top emerging topics for March (9th, 11th,
5. CASE STUDY: YOUTUBE VIDEO POSTS 12th, 16th) detected using our UGC-ETD system.
In this section we discuss the implementation of the UGC- Date Top Emerging Topic
ETD system formulated in §3 for the detection of emerging 9 {momsen, beuty, gossip, badgley}
topics in YouTube video posts. We examine emerging top- 11 {tsunami, earthquake, japan, magnitude}
ics in 24-hour time periods (I=24 hours) from 2.2 million 12 {fukushima, explosion, nuclear, sendai}
YouTube video posts with posting dates between 3/5/2011 16 {sadiq, batcha, suicide, death}
and 3/19/2011. We used a historical time range of 5 solar
days for predicting the nutrition-rank of a given term, s = 5
days. This s value was chosen for two reason: the predicted In Figure 2 we display the complete strongly connected
rank of a term from the regression analysis seldom changed component (SCC) for the foremost emerging topic for March
for s > 5 (because of the least-squared weighting term), and 11th. In addition to the most emergent (summarizing) terms,
because an s value of 5 enabled us to place the necessary the March 11th SCC also displays non-intuitive correlations
analysis data into the main memory of our workstations, with terms that have smaller energies. For example, 220000
greatly increasing the speed of the analysis. Furthermore, and japan were found to be highly co-occuring. As it turns
each day has an average of over 150,000 posts, which attests out, 220000 was the frequently-cited estimated-number of
to the statistical stability of regression analysis: even though casualties from the U.S.’s nuclear attack on Japan during
the analysis is based on a small number of data points, each World War II. After the earthquake and tsunami, many
data point is drawn from a large amount of data. YouTube video posts described the tsunami as the worst
In table 2 we report sample emerging topics found by our Japanese tragedy since the 220000 Japanese civilian deaths
system that display both the strengths and weaknesses of our in WWII. Other interesting correlations can be found in
generalized implementation. We first note the two emerg- this SCC such as the correlation between “10meter” and
ing topics (on March 11th and 12th) related to the magni- “tsunami” (stemming from posts claiming the tsunami was
tude 9.0 earthquake and resulting tsunami that spawned off generating 10-meter high tidal waves), and the correlation
the Japanese coast on March 11th 2011, which then caused between “shutdown” and “earthquake,” which is not bidirec-
malfunctions at the Fukushima nuclear power plant in the tional (“earthquake” nearly always accompanied the term
following days[26]. Video posts relating to this catastrophic “shutdown” but not vice versa).
event ranged from news reports and video-diary entries to The foremost emerging topic for March 12th stems fromFigure 3: Temporal volume of Twitter posts for
tsunami, fukushima, and 220000 [27].
the March 11th catastrophe, and it is interesting to note that
according to Trendistic[27], the same delayed emergence be-
tween the terms tsunami and fukushima was also present in Figure 4: A slice of the March 11th, 2011 emerging
Twitter posts [Fig. 3]. On the other hand, Fig. 3 shows that topic graph after all emerging terms are included
the term “220000” was unique to YouTube postings. This ob- in at least one SCC. Red squares indicate emerg-
servation supports the claim that future comparative studies ing terms (and consequently emerging topics) and a
will be able to use our system to study the unique qualities green ring is drawn around the top emerging topic.
in posting trends from various UGC systems. We also note
that smaller-scale news events can be perceived as emerging
YouTube topics. A prime example is the foremost emerging
topic for March 16th, {sadiq, batcha, suicide, death}, which
was related to the suicide of Sadiq Batcha, a key aide to the
allegedly corrupt telecommunications minister Andimuthu
Raja[21]. This topic became emerging through the large
number of video-posts that discussed suspicions of foul-play
underlying his suicide.
The SCC in Fig. 2 is a small piece of the full March
11th interactive graph displayed in Fig. 4—note that this
graph includes both emerging and non-emerging SCCs that
can be explored by the users of our system, where emerg-
ing topics contain red dots (emerging terms). These large
generated topic graphs are an integral part of our system
as they allow the user to interactively explore large SCCs
and uncover non-summary terms that are unique to a UGC-
system: 220000 was the 13th ranked emerging term in Fig.
Figure 5: Top emerging topic for March 16 2011:
2 and would probably not have appeared in the small, typi-
this provides an example of a spammed topic.
cally 4 or 5 term, minimum-spanning SCCs implemented by
Cataldi et. al. These graphs are created using a hybrid im-
plementation of the open-source JGraphT Java library9 in at the same time, it could incorrectly bias Twitter posts as
combination with the open-source graph visualization soft- Twitter has a feature that allows a user to directly copy an-
ware ZGRViewer.10 other user’s posts. Therefore, removing these posts could be
Our system is not perfect; however, and we find that cer- detrimental to the detection of emerging Twitter topics, and
tain kinds of spammed posts can be perceived as emerg- as a result, negatively impact the generality of our system.
ing topics. For example, the foremost emerging topic for In future work, we will study these spam characteristics in
March 9th [Fig. 5] was formed due to the posting of ap- the context of multiple UGC systems.
proximately 600 YouTube videos from different users that
contained nearly the exact same textual data (a good indi-
cation that these videos were actually from a spammer that 6. CONCLUSION
created multiple user accounts to avoid YouTube’s spam fil-
ters). These posts lured YouTube users to a website that In this paper we presented a general UGC-ETD system
allegedly contained pirated episodes of the tv-show Gilmore- and showed its implementation for the textual data of 2.2
Girls (featuring actress Taylor Momsen). This type of spam million YouTube video posts published between 3/5/2011
presents a difficult challenge for our general system, and and 3/19/2011. To the best of our knowledge, this is the
other systems as well, because these spammed posts orig- first general UGC-ETD system created to date. We are
inate from multiple users. One way we could address this currently in the process of including more types of UGC into
problem is by removing posts with similar text contents. our system and exploring nonlinear trending models, and
This technique may be successful for YouTube posts, but we plan to display these results in a follow-up publication.
In addition, we plan to use human-based classification of
9
http://www.jgrapht.org/ emerging topics to statistically characterize the reliability of
10
http://zvtm.sourceforge.net/zgrviewer.html our system.7. REFERENCES social network analysis, p.56–65. ACM, 2007.
[1] Alexa. http://www.alexa.com/. [17] H. Kautz, B. Selman, and M. Shah. Referral Web:
[2] S. Baluja, R. Seth, D. Sivakumar, Y. Jing, J. Yagnik, combining social networks and collaborative filtering.
S. Kumar, D. Ravichandran, and M. Aly. Video Communications of the ACM, 40(3):63–65, 1997.
suggestion and discovery for youtube: taking random [18] B. Klimt and Y. Yang. Introducing the Enron corpus.
walks through the view graph. In Proceeding of the In First conference on email and anti-spam (CEAS),
17th international conference on World Wide Web, 2004.
p.895–904. ACM, 2008. [19] M. Mathioudakis and N. Koudas. Twittermonitor:
[3] M. Cataldi, L. Di Caro, and C. Schifanella. Emerging trend detection over the twitter stream. In Proceedings
topic detection on Twitter based on temporal and of the 2010 international conference on Management
social terms evaluation. In Proceedings of the Tenth of data, p.1155–1158. ACM, 2010.
International Workshop on Multimedia Data Mining, [20] L. Page, S. Brin, R. Motwani, and T. Winograd. The
p.1–10. ACM, 2010. PageRank Citation Ranking: Bringing Order to the
[4] M. Cha, H. Kwak, P. Rodriguez, Y. Ahn, and Web. 1999.
S. Moon. I tube, you tube, everybody tubes. In [21] L. Polgreen. India Scandal Has Andimuthu Raja,
Proceedings of the 7th ACM SIGCOMM conference on Ex-Minister, at Heart. The New York Times, Nov.
Internet measurement IMC 07. ACM Press, 2007. 2010.
[5] M. Cha, H. Kwak, P. Rodriguez, Y. Ahn, and [22] I. Ruthven and M. Lalmas. A survey on the use of
S. Moon. Analyzing the video popularity relevance feedback for information access systems. The
characteristics of large-scale user generated content Knowledge Engineering Review, 18(02):95–145, 2003.
systems. IEEE/ACM Transactions on Networking [23] A. Sharma and M. Elidrisi. Classification of
(TON), 17(5):1357–1370, 2009. multi-media content (videos on youtube) using tags
[6] G. Chatzopoulou, C. Sheng, and M. Faloutsos. A first and focal points. Unpublished manuscript. Retrieved
step towards understanding popularity in YouTube. In from http: // www-users. cs. umn. edu/ ~ankur/
2010 INFOCOM IEEE Conference on Computer FinalReport_ PR-1. pdf , 2008.
Communications Workshops, p.1–6. IEEE, Mar. 2010. [24] J. Story and J. Wickstra. Discovering trending topics
[7] C. Chen, Y. Chen, Y. Sun, and M. Chen. Life cycle on twitter via retweets. Unpublished manuscript.
modeling of news events using aging theory. Machine Retrieved from
Learning: ECML 2003, p.47–59, 2003. http: // cs. uiowa. edu/ ~jwikstr/ finalPaper. pdf ,
[8] X. Cheng, K. Lai, D. Wang, and J. Liu. Ugc video 2011.
sharing: Measurement and analysis. Intelligent [25] G. Szabó and B. Huberman. Predicting the popularity
Multimedia Communication: Techniques and of online content. CoRR, abs/0811.0405, 2008.
Applications, p.367–402, 2010. [26] H. Tabuchi. Company believes 3 reactors melted down
[9] X. Cheng, J. Liu, and C. Dale. Understanding the in japan. New York Times, p.12–13, May 24, 2011Âa,
characteristics of internet short video sharing: A 2011.
youtube-based measurement study. IEEE [27] Trendistic. http://trendistic.com/.
Transactions on Multimedia, 2010.
[28] Twitscoop. http://www.twitscoop.com/.
[10] F. Figueiredo, F. Benevenuto, and J. Almeida. The
[29] Twopular. http://twopular.com/.
tube over time: characterizing popularity growth of
[30] Y. Wu, Y. Ding, X. Wang, and J. Xu. On-line hot
youtube videos. In Proceedings of the fourth ACM
topic recommendation using tolerance rough set based
international conference on Web search and data
topic clustering. Journal of Computers, 5(4):549–556,
mining, p.745–754. ACM, 2011.
2010.
[11] A. Frank and A. Asuncion. UCI machine learning
repository [http://archive.ics.uci.edu/ml].
University of California, Irvine, School of Information
and Computer Sciences, 2010.
[12] P. Gill, M. Arlitt, Z. Li, and A. Mahanti. Youtube
traffic characterization: a view from the edge. In
Proceedings of the 7th ACM SIGCOMM conference on
Internet measurement, p.15–28. ACM, 2007.
[13] hashtags.org. http://hashtags.org/.
[14] R. Hogg and A. Craig. Introduction to mathematical
statistics. Prentice Hall, 1994.
[15] S. Jamali and H. Rangwala. Digging digg: comment
mining, popularity prediction, and social network
analysis. In Web Information Systems and Mining,
2009. WISM 2009. International Conference on,
p.32–38. IEEE, 2009.
[16] A. Java, X. Song, T. Finin, and B. Tseng. Why we
twitter: understanding microblogging usage and
communities. In Proceedings of the 9th WebKDD and
1st SNA-KDD 2007 workshop on Web mining andYou can also read