Wiring Matters Issue 89 - March 2022 - IET Electrical
←
→
Page content transcription
If your browser does not render page correctly, please read the page content below
Wiring
 Matters
 Issue 89
March 2022
Hello and welcome back to Wiring Matters for 2022! In
                                            the March issue we start our year with three in-depth
                                            articles from our regular contributors. This year is a
                                            particularly exciting one for us, as I'm sure you are
                                            aware we are mere weeks away from the publication
                                            of BS 7671:2018+A2:2022, the much prophesized
                                            'Amendment 2'. We anticipate that this will drive a
                                            large part of the discussion that will find its way into
                                            our page for this year, so if you want to be a part of
                                            those discussions, or if you have questions for our
                                            Technical Regulations team, don't hesitate to email us
                                            at wiringmatters@theiet.org.

Cameron Fraser, Editor                          The first article of this issue comes from Allan Burns
                                                and is a continuation of Steven Devine's series
regarding DC integration. This article deals with fixed wiring DC installations and how they might
be used in the future. Allan has included several case studies in this article, which we hope you
find interesting in illustrating the potential uses of DC.

Frequent IET and Wiring Matters contributor Graham Kenyon brings us an investigation into
resistance readings for Step 3 of the final ring circuit. We hope you find this illustrated guide
useful reference material going forward.

Finally for this issue IET Senior Engineer Michael Peace has written an article around Insulating
Piercing Connectors (IPCs). These are becoming increasingly common in electrical installations
and Michael wanted to bring an article to us that showed both the uses of such devices as well
as where standards stand around their use.

We're excited to be back for 2022, especially given the imminent publication of Amendment 2.
We look forward to bringing you more articles looking at the changes in that book, as well as
inside reports on other forthcoming IET Codes & Guidance book. Our next issue will be out in
May, until then thank you for your interest in Wiring Matters and we look forward to seeing you
next time.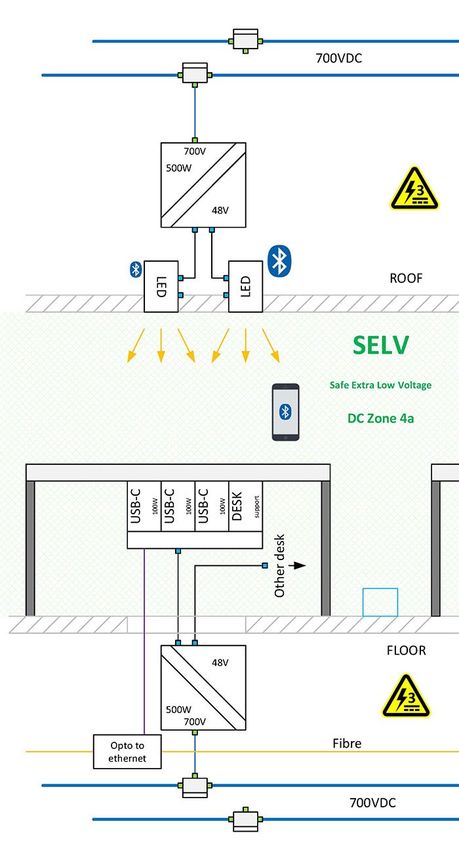
DC Realisation in the 21st Century
By: Allan Burns of Telemental, with thanks to the IET’s 48V DC Realisation Forum and the Michael
Faraday House project team for their contribution.

This article is part two of a four-part series taking us through the history of DC
evolution to the benefits of modern-day application.

The first article in this series outlined the history of electricity distribution and the
losses entailed with distribution via the AC grid equipment we have in service now.

Introduction
This article will outline some ways DC fixed wire installations have been implemented in
buildings and some considerations for electrical designers wishing to implement, or just be
future-ready for, similar arrangements.
Readers should note that this article considers consumer-side final circuits (and some
appliances) to be part of ‘the grid’, as opposed to it being the destination of the grid. This
blurring of the boundary is the first thing that needs to be looked at if we are to understand
the DC opportunity.
For decades, electrical distribution has looked as it is depicted in Figure 1.

Figure 1

In reality, this arrangement would be more like a web with interconnected generators and
cables serving all end-use points. However, the arrows shown pointing left to right here would
have been accurate in relation to ~99% of the national grid until relatively recently. One
notable exception was Dinorwig power station commissioned in 1984 which could use
electricity at off-peak times to pump water against gravity to be released again to generate
at peak times. Dinorwig’s peak output was 1728 MW, which represents about 6% of our
average demand in the UK today. Its contribution can be represented as shown in Figure 2.
Figure 2

Dinorwig arguably represents the earliest iteration of the ‘smart grid’ concept which is
revolutionising the energy industry today.

Why DC Now
The argument, and strategy, for morphing the grid to accommodate DC relies on a number of
changes since Dinorwig was commissioned including:
1. The exponential increase of places like Dinorwig where significant energy flow can be bi-
directional. Much of this is battery energy storage which means it is DC. In February 2021
there was more than 1 GW of operational battery storage capacity in the UK, with a huge
increase projected as shown in Figure 3 by REGEN SW.

Figure 3

2. A massive increase in DC assets embedded at the local/micro level in the form of
microgeneration (mainly PV) and battery energy storage.
3. On the subject of Battery Energy Storage we cannot ignore EVs. International standards are
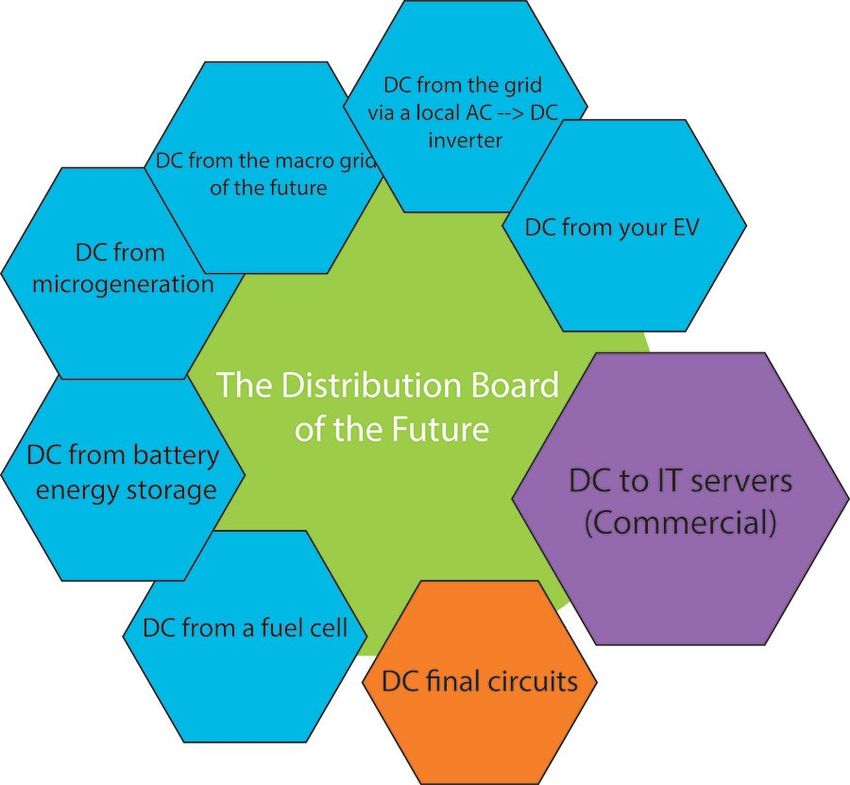
being developed to encourage their use, IEC 60364-8-82, and in particular clause 8.5 “electric
vehicles” is intended to give guidance for prosumers’ electrical installations. There are an
estimated 370,000 Battery Electrical Vehicles on the road in the UK today. If we ballpark their
individual capacity at 10 KWh that gives us 3.7 GWh of storage. If all were to be connected at
one time, 370 MW of instantaneous power could be harvested if we took 1KW from each EV.
Vehicle to Grid (V2G) technology is in its infancy but we can’t dismiss its potential while
considering the architecture of a sustainable grid. That would be equivalent to two Dinorwigs
- and electrical batteries can get up to speed a lot faster than Dinorwig’s 16 seconds!
The three points above inform this high-level view of where DC can be found:

Figure 4

Note: Large Wind Turbines typically output AC, they are included in this diagram to reflect
their potential to contribute to a stored energy grid.
The diagram shows that we have DC generation and storage on both sides of the Macro Grid.
This article focuses on strategies for enabling the uptake of DC on the right-hand side of the
macro grid; Utilising DC micro-generation + DC micro storage to create more energy-efficient
DC opportunities in the built environment.
This is not to say that the Macro Grid cannot ever transmit DC, it could and in some instances
already does, but this article is for a readership that typically is more involved on the ‘micro’
side.

Fixed wire DC installations in the built environment
The previous article in this series explained the status quo. We have a large amount of
infrastructure to turn AC into DC and back again over and over but it produces huge amounts
of unwanted heat (I2R losses) and energy embodied in billions of manufactured conversion
devices. So how can electrical designers help with this clearly undesirable situation?
In 2022 they can create an infrastructure that is AC/DC agnostic. It should be said however
that delivering a fully DC domestic or commercial environment is, in 2022, still a very
challenging endeavour! Global manufacturing is still set up for AC, not DC, so designing out
AC completely is not currently a realistic aim for any but a few specialised pioneers whose
work we will come to later in this article.
So the conversation here is about how we can ‘future-ready’
Future-ready factor 1 – Create space for
adjustments and later additions, particularly at the
origin
If we accept that a transition to DC from AC will not be instantaneous or complete then we
are faced with a reality where AC and DC circuits must exist in proximity to one another at
least for a time. This situation has existed with respect to band 2 (Low Voltage) and band 1
(Extra Low Voltage, typically telecommunications cables) circuits for decades. The issue of
segregation becomes more challenging where we are looking to deliver power to all
appliances – not just telecommunications to electronic devices.
Figure 5, taken from the Guide to Smart Homes for Electrical Installers, encapsulates the
method that smart home installers already employ to give themselves wiggle-room.
Figure 5

Smart homes typically use 24 VDC for lighting and sensors alongside 230 V AC. Enclosures for
this purpose as shown above tend to be much larger e.g 90x80 cm and even with this room to
play with option C above will probably get you in a lot of difficulty with segregation.

In many cases a multiple-enclosure approach is taken:

Figure 6

The arrangement above affords extra latitude for segregation and later addition of equipment
and cables.
Big plant rooms – in the right place
Having a fabulous cluster of enclosures, what smart home designers call a ‘head end’ at the
origin isn’t necessarily going to be enough though. Forward planning is needed to allow for
the integration of other related plant which can be harmonised with DC, the possibilities are
endless, some of which are shown in Figure 7.

Figure 7

If we consider the scenario in the diagram above with 6 elements in addition to the final
circuits for domestic, and seven for commercial – clearly the hallway or under the stairs is not
a future-ready location for the distribution board of the future.
Commercial and industrial electrical designers will not need to be told they need to factor in a
Plant Room. But do they need to revisit the criteria for sizing, location, and connectivity?
Maybe architects need to be in on this discussion? Consider that a roof without PV is a
missed opportunity, but also consider that EVs are coming and that they will function as a
load and a supply. The plant room for our DC future needs therefore to be somewhere
between the PV and the parking. It also needs some space for some pretty big boxes (which
have not been designed yet) and ducting for cables that can manage EV level DC energy.

Future-ready factor 2: what equipment?
Exactly – no one knows for sure.
Two assumptions I will bet on:
          1.   The modern premises already has >90% of the appliances it’s ever going to have

               and >90% of those are already more or less where they are going to stay within

               that habitat.

          2. Those appliances that can, will drift over to a form where they can be fed DC

               direct within the next 20 years. The exception being big thermal appliances e.g.,

               space and water heaters.

*meaning places people congregate, not specialized workplaces.
So, the prize goes to the designer who can design final circuits for now which can transition
from AC to DC when required.

Future-ready factor 3: Which voltage?
A good question with many answers, all with qualifying factors which in turn have their own
qualifying factors . . .
Some flags in the ground for now:
          •    5 V USB DC is going to be around for a while yet. It is very safe and ubiquitous.
               It is limited in the power it can deliver and is subject to high transmission
               losses.
          •    700 VDC is the highest DC voltage I have seen proposed for a building
               designated for habitation. It’s good for cutting transmission losses over distance
               and therefore better for higher power applications. It is more challenging to
               make safe for human proximity
          •    350 VDC is beginning to resolve as a good level to transmit electricity over
               longer distances (>10 m) through premises. It would usually be found out of
               touch range and be galvanically isolated from touchable appliances.
          •    48 VDC is beginning to resolve as a good level to step down to from 350 VDC
               locally to end-user appliances. It’s a happy medium for reasons including:
                           o Transmission losses (voltage drop) are low enough to make
                               powering appliances like refrigeration viable with standard cable
                               sizes over reasonable distances.
                           o The voltage level being this low ameliorates some issues that DC
                               can create e.g., the challenge of extinguishing DC arcs when
                               breaking circuits.
                           o Electronics such as those found in the sensors and processors that
                               smart sustainable buildings need can be adapted to work with 48
                               VDC. This allows us to have one cable that can serve for power,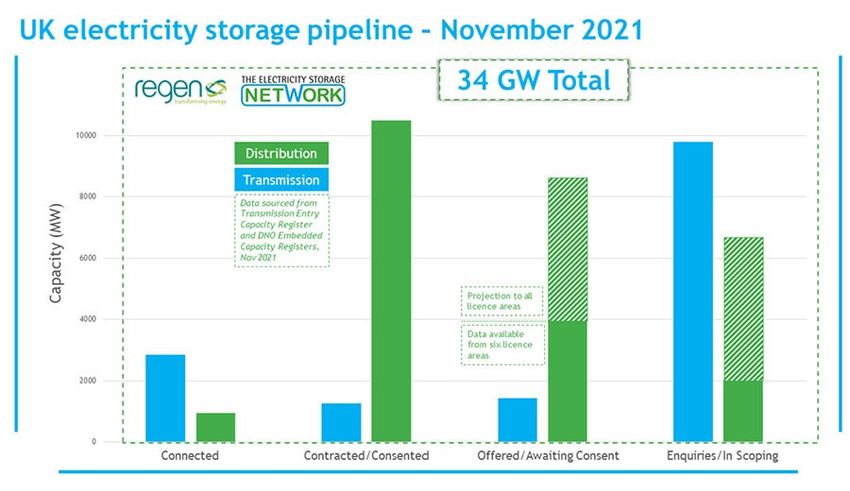
lights, telecommunications and smart-building gadgets. That’s
                             going to mean less cables and more possibilities – what’s not to
                             like about that!
N.B. While we can say that where all other factors are equal, electrical hazard increases as
voltage increases, it is also the case that any voltage can kill given the ‘right’ circumstances.
DC installations require specialist earthing arrangements which are not dealt with in this
article.

The snake in the woodpile – voltage and the final metre
I have been involved in the delivery of the DC demonstration area within the IET’s
refurbishment of its head office at Michael Faraday House. It would be fair to say that the
most complicated aspect of this project has been resolving the real-world issues around
providing the various pre-specified IT products with the energy they require. In short, the
biggest battle has been fought in the final metre between the wall plate and the devices
themselves.
We had the benefit of a team of top-flight electronic engineers and it was still a challenge.
The issues are too many to list here but will be addressed later in this series. The advice for
now is to obtain the full suite of IT equipment intended for DC-direct connection and bench
test it before specifying infrastructure to serve it. In time the world’s electronics
manufacturers will catch up. But until then, if contracted to handover a working DC
environment play safe and bench test before making promises.

Future-ready factor 4: Which cable?
Proprietary DC cables are still niche and so more expensive than standard cables. We do not
yet have set Codes of Practice for DC installations. Therefore, it seems reasonable to go on
using standard cables for a time.
Bear in mind though that a 500 W appliance running at 230 V will draw 2.2 amps, while a 500
W appliance running at 48 V will draw 10.4 amps.
Increasing all cables current carrying capacity by a factor of 4 will not make for a cost-
effective or sustainable installation.
Therefore, either use ample ducting for all runs or give careful consideration to the
following…

Future-ready factor 5: Which topography?
Basically, the Ring Circuit is dead. It was fun and easy to live with but we have to leave it
behind now. Large oversized circuits to serve general zones should be phased out. Radial
circuits targeting specific loads to clusters should be phased in
You must identify where significant loads or load clusters are likely to be and direct
appropriate size cables accordingly. Kitchens with kettles and hobs are likely to stay
predominantly AC for years to come but bedrooms could be flippable sooner, if not now.
Similarly, try to identify zones that will have just IT or AV equipment and let them have a
dedicated cable that can be swapped over to DC later.
Running all final circuits back to a single point will make metering of energy use easier. It will also be a big enabler in terms of functionality, allowing for circuits to be grouped/‘meshed’ to allow efficiency measures like separate circuits for lighting in areas which do not have natural light or having one big efficient central power supply as opposed to multiple less efficient power supplies. This leads us to our next point… Future-ready factor 6: Which converter? Let’s start by making the distinction between an inverter and a converter. An inverter changes DC current to AC current, a transformer-rectifier does AC to DC and a few devices combine both functions. A converter adjusts the voltage of DC from one level to another but keeps it as DC. What we have on premises at the moment is lots and lots of power supplies which are often called transformers or ‘dongles’ which are often integrated into particular appliances e.g. a 5 V USB module within a socket plate or a lump in the line of a laptop supply. These serve to transform 230 VAC into DC at whatever voltage is required by the device. This situation wastes energy as discussed earlier. In a perfect world with friendly physics, we would have one source or converter supplying all of the DC devices with one DC voltage and they would all be happy - in practice this is challenging to achieve. Take laptops as an example of the challenge. There is very little variation in the power requirements of laptops and yet we still have a multitude of voltages and connectors for laptops. The same is true of equally ubiquitous monitors and displays. A standard DC voltage for electronic equipment, which by definition needs DC, is still a way off. The market and manufacturing base for DC appliances like refrigerators is as yet tiny compared to laptops and monitors so the situation is even more problematic for other ‘white goods’ at the moment. Also, the jury is still out on whether 48V DC will emerge as the victor for the wider gamut of DC appliances and devices. So the advice for the aspiring DC designer for the moment is to claim the space for the bigger distribution board and plant room as described earlier. Ensure enough space to safely patch final circuits through to the converter/voltage they need, when they need it. At the time of writing, the wise designer makes space for multiple voltages. An alternative approach for larger buildings is to have a DC power BUS at a high voltage and use DC-DC converters to ‘step down’ local to equipment clusters, this approach is explored in the next case study.
Case study 1 – large commercial
Figure 8
The Michael Faraday House DC
project has benefited from
guidance and equipment from
DC Systems based in the
Netherlands. Being the leader in
innovations for DC applications,
they joined forces with the
global energy management
experts, Schneider Electric.
Together, both companies
reinforce their expertise in
developing safe, resilient
microgrid applications
The illustration in Figure 8
shows how the voltage levels
described above might be
deployed in practice in large
commercial premises in which
DC Systems specialise in.
Note that the 700 VDC line
shown at the top could be run at
350 VDC if distances and
voltage drop allowed.
There is a similar line at the
bottom. Either would probably
be a busbar in practice. Tap offs
with converters are used to step
down to 48 VDC to serve
equipment clusters which here
consist of lighting in the ceiling
and IT equipment on the floor. It
would be possible to supply a
host of other sensors and
actuators from these converters.
An installation on this scale with
this infrastructure would
probably incorporate on-site PV
and battery energy storage and
be capable of providing power for instantaneous hot water taps.
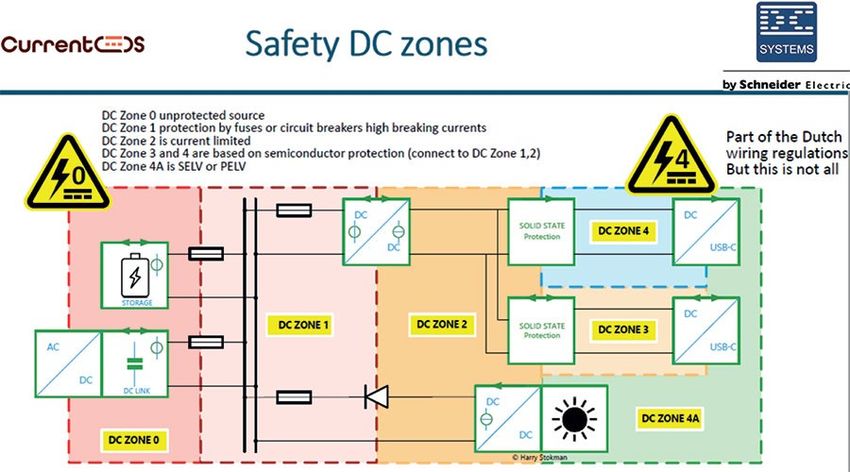
At this scale, trading energy back to a smart grid becomes potentially very attractive.The plant room for an installation like this could have the capacity for fuel cells and hydrogen storage, and also have some extra space for something that no one has thought of yet. Using a higher voltage bus and step down architecture requires robust health and safety strategies. This diagram indicates how DC Systems might zone their commercial installations. DC Zone 0 is for qualified technicians only, DC zone 4A is open to all. The zones in between would need to be carefully assessed on a case by case basis. Figure 9
Case study 2 – domestic expert enthusiast
Figure 10

The illustration above is a grab and simplification of a diagram of a working installation
designed and installed by a member of the 48 VDC realisation forum.
The PV panels shown on the right operate at 48 VDC.
The BYD battery at lower right is also 48 VDC
Together they constitute a stable supply to a 48 VDC busbar.
In this arrangement, they feed the property via an inverter charger which ensures the 48 VDC
battery remains charged and converts 48 VDC to 230 VAC when required by the house.
This arrangement effectively bridges the current lack of affordable 48 VDC appliances.
When they become available, the wiring could be adjusted to supply 48 VDC direct without
conversion losses.
There is no need for a 350 or 700 VDC busbar in this instance because the reduced distances
do not present severe voltage drop problems. Higher current loads should be designed as
close to the origin as possible and specified with larger cables.
This kind of adaptability relies on a well thought out and provisioned distribution centre and
overall installation.
Case study 3 – the Open DC Grid
Figure 11

Not a case study in the same sense as 1 or 2 but illustrative as an example of how
one faction visualises a DC energy world. In this scenario 48 V DC is the maximum and
everything has to live under that ceiling. This fits well with case study 2 but case study 1
becomes a high voltage island in this scenario. Perhaps the ‘open grid’ format would be a
good option for a cluster of properties based around its own dedicated Distributed Energy
Resources (DERs)?
Case study 4 – the islanded micro grid
Figure 12

Illustrative of something grid-privileged people forget, that some parts of the world do not
have a macro grid. Also, that some may choose to live apart from it. This diagram is a gross
simplification. A major challenge in this scenario is matching the DC Voltage of the source to
the required voltage of the appliances. Where DC to DC voltage conversion is required a buck
converter could be used.
Case study 5 – a fully-featured hybrid AC/DC
system
Figure 13

This is a concept, not an actual design but it is entirely achievable, given appropriate
expertise. The biggest barrier to its realisation is the lack of Appliances that can be powered
directly from a DC supply!
Note the use of a 380VDC Bus to feed lower DC voltage branches.

Summary
In 2022 DC buildings are possible but significantly more challenging to deliver than AC
buildings. Simply swapping a traditionally wired AC building over to a DC supply would be
challenging for a variety of reasons including voltage drop, DC arcing and circuit fault
protection.
In 2022 a new-build or rewire of a domestic or commercial premises could be adapted as
described above to make a transition to DC viable when cost-effective solutions to the
challenges are found.
Forward-thinking developers and designers can hang a ‘DC future-ready’ tag on their
properties. The value to the owner of this is boosted by the inclusion of PV / EV / Battery
Storage capability.
DC will probably have to co-exist with existing AC grid connections until the macro-grid is
ready to flip to DC.
Supply follows demand, the macro-grid will only flip to DC when there are enough DC
buildings to make that profitable. The forces of change that will drive the adoption of a DC
macro grid include:
          •   The challenge of managing very large numbers of very small renewable energy
              sources and energy storage devices
          •   The need for an effective islanding capability to build resilience, and support for
              peer-to-peer energy trading
          •   The need to build the additional network capacity to charge electric vehicles
              and exploit vehicle-to-grid (V2G).
These things can be achieved within the existing AC macro grid - but it’s much, much harder.
Some of the technical challenges to overcome include:
          •   The lack of approved DC metering equipment
          •   The immaturity and scarcity of solid state circuit protection to substitute for
              MCBs
          •   The immaturity and scarcity of appliances which are factory-fixed to run on DC
          •   The creation of a macro-protocol for energy management which all stakeholders
              in all parts of the supply chain can adhere to
          •   The lack of an approved Code of Practice for DC installation. While British
              Standard BS 7671 incorporates the provision for systems up to 1500 VDC it is
              fair to say that it’s application to comparably immature DC technology is a
              daunting challenge for most electrical designers.
Yes, it’s a bit of a moon-shot but a DC macro-grid would be a grid fit for our 2050 goals and
those goals mean everything.
So, what are we waiting for, a DC built environment isn’t going to build itself!
Resistance readings for Step 3 of the ring final circuit test By: Graham Kenyon Since the First Edition of IET Guidance Note 3 Inspection and Testing, the guidance has been that, for both Step 2 and Step 3 of the test for continuity of ring final circuit conductors, the readings at each point on the circuit will be substantially the same, disregarding parallel paths. But is this always the case? This article digs a little deeper to find out. Background Someone carrying out inspection and testing on a ring-final circuit will not always see the same reading at each point during Step 3 of the ring-final circuit continuity test, unless the resistance (normally, the cross-sectional area and material) of the line conductor and circuit protective conductor (cpc) are roughly the same. When the resistance per metre of the line and cpc conductors differs, starting at the consumer unit, where the crossed connection is made, readings in Step 3 will, in fact, increase at each test point around a correctly-wired ring, with no parallel paths, reaching a maximum at the mid-point of the ring, and reducing back to the lowest reading at the consumer unit.
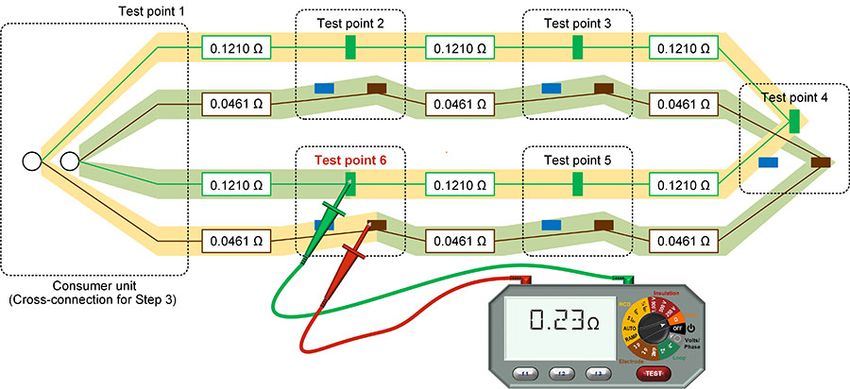
Measurements on a ring final circuit wired with 2.5/1.5 mm2 twin and earth cable shows very
little change in instrument readings at each test point around the ring, even for the longest
circuit lengths meeting voltage drop criteria. There is very little distinguishable change in the
instrument reading during the test. As the difference in cross-sectional area between live
conductors and cpc increases, the difference becomes more noticeable. With longer ring final
circuits wired in 4.0/1.5 mm2 twin and earth cable, the readings no longer appear
approximately the same at each point on the ring, and differences in instrument readings
become more noticeable.
The following example is used to demonstrate how the differences in measurement between
the cross-connection (usually at the origin of the circuit within the consumer unit or
distribution board) and the mid-point in the ring occur.

Example
In this example, we will look at a ring final circuit with five socket outlets, evenly
spaced. There is 10 m of 4.0/1.5 mm2 cable between the consumer unit and the first
socket-outlet, between each socket-outlet, and between the final socket-outlet and
the consumer unit. This is illustrated in Figure 1.
Figure 1: 60m ring final circuit with socket-outlets evenly spaced at 10 m
intervals around the ring

The resistances in Figure 1 are calculated from Guidance Note 3 Table B1 (at 20°C) as
follows:
Resistance of 1.5 mm2 conductor = 12.1 mΩ/m
Resistance of 10 m of 1.5 mm2 conductor = 10×12.1 ÷ 1000 Ω = 0.1210 Ω

Resistance of 2.5 mm2 conductor = 4.61 mΩ/m
Resistance of 10 m of 4.0 mm2 conductor = 10×4.61 ÷ 1000 Ω = 0.0461 Ω

End-to-end tests (Step 1 of the ring final circuit continuity test)
Figure 2: End-to-end tests on the example circuit shown in Figure 1

The predicted readings for the end-to-end tests for r1 (line) and r2 (cpc) are:
r1 = 6 × 0.0461 Ω = 0.2766 Ω
r2 = 6 × 0.1210 Ω = 0.7260 Ω
Resistance measurement predicted by the formula (r1+r2)÷4 = (0.2766+0.7260)/4 Ω
or predicted reading by existing “rule of thumb” = (r1+r2)÷4 = 0.25 Ω
Step 3 of the ring final circuit test

In Step 3, line and circuit protective conductors are cross-connected, and a resistance
measurement is taken between line and circuit protective conductor at each point on the ring
final circuit.
Step 3, resistance at Test Point 1

Figure 3: Resistance at Test Point 1 of the circuit illustrated in Figure 1
Resistance of yellow path ry = 6×0.0461 = 0.2766 Ω
Resistance of green path rg = 6×0.1210 = 0.7260 Ω
Using parallel resistance formula ry // rg = ry×rg ÷ (ry+rg), the predicted measured resistance
is…
Predicted measured resistance = 0.2766×0.7260 ÷ (0.2766+0.7260) = 0.2003 Ω
Step 3, resistance at Test Point 2

Figure 4 Resistance at Test Point 2 of the circuit illustrated in Figure 1

Resistance of yellow path ry = 5×0.0461 + 1×0.1210 = 0.3515 Ω
Resistance of green path rg = 5×0.1210 + 1×0.0461 = 0.6511 Ω
Predicted measured resistance = ry//rg = 0.3515×0.6511 ÷ (0.3515+0.6511) = 0.2283 Ω
Step 3, resistance at Test Point 3

Figure 5: Resistance at Test Point 3 of the circuit illustrated in Figure 1

Resistance of yellow path ry = 4×0.0461 + 2×0.1210 = 0.4264 Ω
Resistance of green path rg = 4×0.1210 + 2×0.0461 = 0.5762 Ω
Predicted measured resistance = ry//rg = 0.4264×0.5762 ÷ (0.4264+0.5762) = 0.2451 Ω
Step 3, resistance at Test Point 4 (mid-point of the ring)

Figure 6: Resistance at Test Point 4 of the circuit illustrated in Figure 1

Resistance of yellow path ry = 3×0.0461 + 3×0.1210 = 0.5013 Ω
Resistance of green path rg = 3×0.1210 + 3×0.0461 = 0.5013 Ω
Predicted measured resistance = ry//rg = 0.5013×0.5013 ÷ (0.5013+0.5013) = 0.2507 Ω
Step 3, resistance at Test Point 5

Figure 7: Resistance at Test Point 5 of the circuit illustrated in Figure 1

Resistance of yellow path ry = 2×0.0461 + 4×0.1210 = 0.5762 Ω
Resistance of green path rg = 2×0.1210 + 4×0.0461 = 0.4264 Ω
Predicted measured resistance = ry//rg = 0.5762×0.4264 ÷ (0.5762+0.4264) = 0.2451 Ω
Step 3, resistance at Test Point 6
Figure 8: Resistance at Test Point 6 of the circuit illustrated in Figure 1

Resistance of yellow path ry = 1×0.0461 + 5×0.1210 = 0.6511 Ω
Resistance of green path rg = 1×0.1210 + 5×0.0461 = 0.3515 Ω
Predicted measured resistance = ry//rg = 0.6511×0.3515 ÷ (0.6511+0.3515) = 0.2283 Ω

Results and conclusion
What is important for the person carrying out the inspection and testing is the predicted
reading of the instrument, which is usually shown to two decimal places. The predicted
readings from our example are shown to two decimal places in Table 1, alongside predicted
readings for a 60 m ring final circuit wired in 2.5/1.5 mm2 cable calculated in the same way.
Table 1: Predicted readings at points around a 60 m ring final circuit

                                       Predicted instrument reading

                                       60 m ring wired      60 m ring wired in
Test point                             in 2.5/1.5           4.0/1.5

                                       0.28 Ω               0.20 Ω
1 Origin of circuit

                                       0.29 Ω               0.23 Ω
2 Clockwise 10 m from origin

                                       0.29 Ω               0.24 Ω
3 Clockwise 20 m from origin

                                       0.29 Ω               0.25 Ω
4 Mid-point, 30 m from origin

                                       0.29 Ω               0.24 Ω
5 Clockwise 40 m from origin
0.29 Ω 0.23 Ω 6 Clockwise 50 m from origin From Table 1, a 60 m 2.5/1.5 mm2 ring final circuit only shows a change of one in the least significant digit in the reading as you move around the ring, but with the same ring final circuit wired in 4.0/1.5 mm2, the change is five in the least significant digit on the instrument. This is a change of 25% of the lowest reading. The lowest reading deviates by 20% from the existing rule of thumb, and the highest reading is predicted by the rule of thumb. The longer the circuit, the more noticeable the difference in reading will be on a test instrument. The type of readings observed with a ring final circuit using 4.0/1.5 mm2 cable might incorrectly be interpreted as a cross-connection or loose connection in the protective conductor of the circuit assuming that the results of Step 2 of the test are as expected, as more ring final circuits are wired in 4.0/1.5 mm2. This is somewhat different to the guidance published in the first eight Editions of IET Guidance Note 3 Inspection and Testing which stated that the readings at each point, should be substantially the same for Step 3, ignoring the effects of instrument accuracy, contact resistance and parallel paths. Whilst existing guidance remains valid for ring final circuits formed with 2.5/1.5 mm2 cables, or single-core insulated cables in containment where the cpc has the same cross-sectional area as the line conductors, the 9th Edition of IET Guidance Note 3 Inspection and Testing will contain additional guidance and rules of thumb to account for line and circuit protective conductor combinations with larger differences in cross-sectional area, such as 4.0/1.5 mm2. The 9th Edition of IET Guidance Note 3 Inspection and Testing, which is due to publish in March 2022, is now available to pre-order via the IET Bookshop. Addendum – If you don’t believe the mathematics You can try an experiment for yourself without having to install 60 m of 4.0/1.5 mm2 for a ring final circuit. We can simulate a ring final circuit using 12 standard value resistors and a multimeter. A good simulation of our example with similar values, but giving readings in kΩ instead of Ω, can be made using six 47 Ω and six 120 Ω resistors to represent the line and cpc conductors of the ring final circuit respectively. As shown in Figure 9, these can be connected as a cross-connected r1 and r2 as in Step 3 of the ring final circuit continuity test.
Figure 9: Simulation using 12 resistors

Set the multimeter to the kΩ range (if not auto-ranging), and measure resistances at the test
points shown above, which mirror the test points in the earlier example.
The predicted readings are shown in Table 2. Note that the actual readings will vary slightly
from the prediction, due to resistor tolerances and measurement accuracy, just as with a real
ring final circuit test.

Table 2: Predicted readings at test points in the resistor simulation

             Predicted instrument reading
             (ignoring resistor tolerance
Test point   and instrument accuracy)

             0.203 kΩ
1

             0.229 kΩ
2

             0.245 kΩ
3

             0.250 kΩ
4

             0.245 kΩ
5

             0.229 kΩ
6
About the author Graham, a Chartered Engineer and IET Member, is Managing Director of consultancy G Kenyon Technology Ltd and Chairs both the IET Wiring Regulations Policy Committee and Sub- Committee D of JPEL/64 of which he is a long-standing member. He is the technical author of a number of IET Guidance Notes and Codes of Practice, including the amendments to the 9th Edition of IET Guidance Note 3 Inspection and testing, due to publish in March 2022.
Insulation Piercing Connectors
By: Michael Peace CEng MIET MCIBSE
Article on the increasingly popular use of insulation piercing connectors on consumer
installations.
There has been a lot of discussion recently on the use of insulation piercing connectors (IPC)
as their use has become increasingly popular on consumer installations, particularly for EV
charging point installers. In this article we look at the use of this type of product.
Executive summary
IPCs have been developed as an effective way of
making a connection on the overhead distribution
network, and in some consumer lighting systems. In
principle, an IPC connector could provide a safe and
reliable connection and, at first glance, they appear to
offer a solution for making easy and economic
connections to consumer meter tails.
However, they must be used in accordance with the
relevant product and installation standards. The use
of IPCs with consumer’s meter tails is outside the
scope of the standard for overhead distribution
connectors, BS EN 50483-4:2009 and until such time
as they have been tested and are covered in a
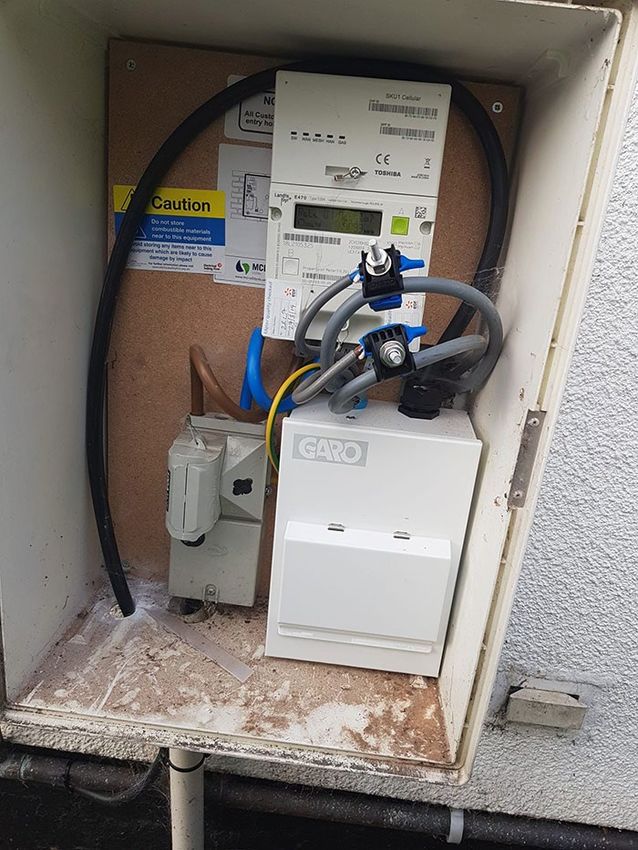
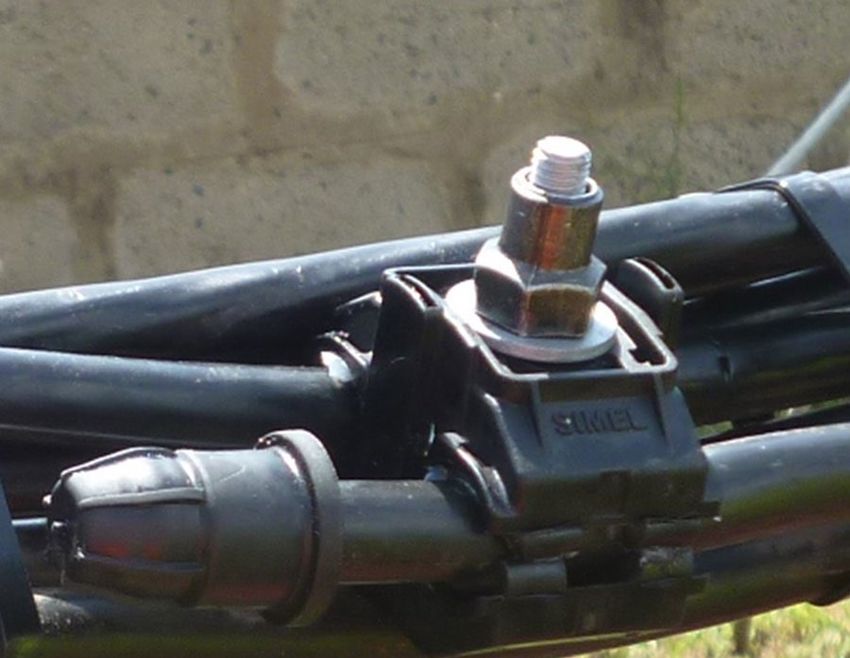
suitable British or Harmonized Standard such as BSEN 61238-1-2:2019, and the ongoing security of pre-existing connections is assured, it is not considered acceptable to use them on the consumer’s side of the installation. To do so results in an installation that presents a high risk of failure or harm and does not comply with recognised standards. What is an insulation piercing connector? IPCs are similar to line taps used for overhead lines, enabling a branch connection to be made to an existing cable without stripping the insulation of the cable, and using a shear head bolt to ensure it is tightened to the correct torque. This is well established technology in some industries and prevalent in the distribution network but not generally used on the consumer’s side of the installation. What are the requirements of BS 7671? Regulation 133.1.1 of BS 7671:2018+A1:2020 requires every item of electrical equipment to comply with the appropriate British or Harmonized Standard. The key word here is appropriate, as the standard often quoted for IPC is ‘BS EN 50483-4:2009 Test requirements for low voltage aerial bundled cable accessories. Part 4: Connectors’. Another standard which might be employed is BS EN IEC 61238-1-2:2019. Regulation 133.1.3 of BS 7671:2018+A1:2020 states that: ‘Where equipment to be used is not in accordance with Regulation 133.1.1 or is used outside the scope of its standard, the designer or other person responsible for specifying the installation shall confirm that the equipment provides at least the same degree of safety as that afforded by compliance with the Regulations. Such use shall be recorded on the appropriate electrical certification specified in Part 6.’ For the reasons outlined in this paper, it is difficult to see how the designer of an installation could provide an adequate justification that the equipment had been proved suitable for use outside the scope of the standard. Therefore, they must not be used for making connections to consumers tails or other non-ABC conductors. What is Aerial bundled conductor (ABC)? Aerial bundled conductor (ABC) or sometimes called aerial bundled cable is used for overhead power distribution cables, it offers a higher level of safety and reliability and lower losses
than bare conductors. The standard for ABC is HD 626 Overhead distribution cables of rated
voltage Uo/U(Um): 0,6/1 (1,2) kV’. ABC is defined in the standard as:
aerial bundled cable (ABC)
‘aerial cable consisting of a group of insulated conductors which are twisted together
including, or not, a non insulated conductor’.
NOTE: The terms bundled conductors, bundled cables, bundled cores, conductor bundles and
bundle could be used as equivalent to the term aerial bundled cable (ABC).

Are IPCs suitable for use on PVC consumer’s tails?
Equipment should only be used within the scope of its standard. The scope of BS EN 50483-
4:2009 states that Part 4 applies to connectors used for the electrical connection of ABC and
the connectors are designed to be installed on ABC defined in HD 626. PVC consumer’s tails
are manufactured to BS 6004 (6181Y). Therefore, they are outside the scope of the standard
and this type of IPC should not be used in consumers’ installations and on PVC consumer tails
in particular.

What are the advantages of using IPC?
Connections made using IPC are less time consuming than using traditional termination
methods and can be made without the need to isolate the supply. This means that their use
falls within the legal definition of ‘live working’. Those who engage in live working must be
able justify it and ensure the work is carried out safely. It is difficult to see how live working
might be justified when the installation can be made dead by withdrawing the main fuse to
the property. The main issue here is that supplier parties who can remove the main fuse may
not provide the service in a time frame that suits the installer, or they may charge for the
service. This is a planning issue and falls within the scope of the Construction, Design and
Management Regulations 2015.

What are the issues with using IPCs on consumer
meter tails?
When the IPC is used for consumer’s tails, it is outside the scope of the standard,
therefore testing has not been carried out to verify suitability.

Compatibility of materials
The insulation material typically used for ABC is cross-linked polyethylene (XLPE), whereas
meter tails are usually manufactured from PVC and are insulated and sheathed, therefore the
overall insulating material is typically thicker and sufficient surface contact area cannot be
assured. The design of IPCs used for meter tails would need to be refined to suit the
application and appropriately tested.

Support for terminations
Once installed, the terminations are generally not supported other than at the point where
they enter the electricity meter or the consumer unit/distribution board. This means that they
can be subject to movement and uncontrolled forces. This is poor installation practice and
must not be adopted. It is difficult to see how, using an IPC, the conductors can be supported
adjacent to the connector. Cable cleats either side of the connection may be needed.
It could be argued that the recognised approach of inserting terminal blocks to provide the
split to the EV equipment can also suffer from the same issue of stress on terminations if not
supported adequately.

Installation method
Whilst the IPC requires a bespoke tool to hold it during the piercing and ‘snap-off’ operation,
the conductors either side of the connector are subject to heavy rotational forces which will
stress the termination at both the electricity meter and the distribution board. Whilst it may
be possible to check the termination on the meter board for tightness using an appropriate
live working regime, the installer cannot access the electricity meter terminals and so cannot
check if their actions have had a detrimental impact on them. This leaves a potentially
dangerous installation.
For this reason, the installation method is not acceptable and must not be used.

Effective insulation
It is unclear if the shroud for the cut end of the newly connected cable has been designed for
the environment and purpose in which it is being used.
The cut end of the branch conductor is protected with an insulated cap sheath that slides
onto the conductor, technically this constitutes non-sheathed cables and should be enclosed
to provide IPXXD or IP4X protection in accordance with the requirements of Regulation
521.10.1 of BS 7671:2018+A1:2020. When installed it is not known how durable it will be.
Failure would result in a live exposed conductor that is protected by the main incoming fuse,
typically a 100A HRC fuse, presenting danger of death to anybody who comes into contact
with it.
IPC connectors can be provided with a captive design of end cap. In summary, products
tested using ABC cable to BS EN 50483-4 cannot be assumed to be compliant - if this sort of
product is going to be used, users should request product that has been tested to BS EN IEC
61238-1-2 on meter tail cable and proven to meet IP4X requirements.

Acknowledgments
Thanks to the Energy Networks Association (ENA) and the British Cables Association (BCA)
for their valued contributions in the production of this article.
You can also read