Woody Species Composition, Vegetation Structure, and Regeneration Status of Majang Forest Biosphere Reserves in Southwestern Ethiopia - Hindawi.com
←
→
Page content transcription
If your browser does not render page correctly, please read the page content below
Hindawi
International Journal of Forestry Research
Volume 2021, Article ID 5534930, 22 pages
https://doi.org/10.1155/2021/5534930

Research Article
Woody Species Composition, Vegetation Structure, and
Regeneration Status of Majang Forest Biosphere Reserves in
Southwestern Ethiopia

 Semegnew Tadese ,1 Teshome Soromessa,1 Tesefaye Bekele,2 and Getaneh Gebeyehu3
 1
 Addis Ababa University, Center of Environmental Sciences, Addis Ababa, Ethiopia
 2
 Ethiopian Environments and Forestry Research Institute, Addis Ababa, Ethiopia
 3
 Assosa University, Department of Biology, Assosa, Ethiopia

 Correspondence should be addressed to Semegnew Tadese; semetade@gmail.com

 Received 20 February 2021; Accepted 19 May 2021; Published 7 June 2021

 Academic Editor: Ahmad A. Omar

 Copyright © 2021 Semegnew Tadese et al. This is an open access article distributed under the Creative Commons Attribution
 License, which permits unrestricted use, distribution, and reproduction in any medium, provided the original work is
 properly cited.
 The aim of this study was to analyse the species composition, structures, and regeneration of woody plant species and the impacts
 of site factors on the natural regeneration of tree species in four study sites of MFBR. The vegetation data were collected
 systematically in 140 plots with the size of 400 m2 for trees; 25 m2 for seedlings, saplings, shrubs, and lianas; and 1 m2 for herbs.
 Individual tree and shrub DBH ≥ 5 cm were measured and counted. The diameter at breast height (DBH), frequency, basal area,
 importance value index (IVI), and density were used for vegetation structure description and regeneration. A total of 158 plant
 species belonging to 115 genera, 56 families, and 80 species (51%) trees, 26 (16%) shrubs, 19 (12%) herbs, and 33 (21%) lianas were
 identified and recorded. The most dominant families were Euphorbiaceae, Rubiaceae, and Moraceae, each represented by 13
 species (7.4%), 12 species (6.8%), and 10 species (5.7%), respectively. The tree densities varied from 1232 to 1478 stem ha−1, sapling
 density 176.8 to 708.7 stem ha−1, and seedling density 534.7 to 1657.5 stem ha−1, with an average basal area of 63.6 m2 in the study
 sites. Dracaena afromontana was the most frequent woody species in the MFBR occurring in 90% followed by Celtis zenkeri (65%)
 and Pouteria altissima (62.5%). The regeneration status of all the woody plant species was categorised as “not regenerate” (9.6%),
 “poor” (30.7%), “fair” (59.5%), and “good” (10.8%) in all sites. The correlation result between natural regeneration and site factors
 revealed both positive and negative relationships. However, the main threat to the biosphere reserve is illegal logging for different
 purposes. Therefore, awareness creation on sustainable forest management, utilisation, conservation of priority species, and
 livelihood diversification to the local community and encouraging community and private woodlot plantation in the transitional
 zone of biosphere reserves are recommended.

1. Introduction flora as well as water sources for the low land area [4, 5].
 However, moist evergreen Afromontane forest resources are
Ethiopia is the centre of biological diversity because of its being dwindled at an alarming rate because of anthropo-
wide range of geographical scale [1, 2]. The various topo- genic disturbance [6, 7].
graphic factors with diverse climatic factors have created Hence, studying plant population structure and regen-
diversified vegetation types in the country. These make eration status is significant to understanding the dynamics of
Ethiopia have above 6000 higher plant species, of which vegetation and their disturbance factors [8]. Stand structure
about 10% are endemic [3]. The vegetation type at Majang is displaying the distribution of an individual in each species
forest biosphere reserves is part of the moist evergreen and provides the general regeneration profile of the forest
Afromontane forest and is found in the southwestern parts [9, 10]. Population structure can show whether or not a
of Ethiopia. Most of these moist evergreen Afromontane continuous regeneration and stable population take place.
forests are very crucial for the conservation of fauna and Inspection of species population structure patterns could
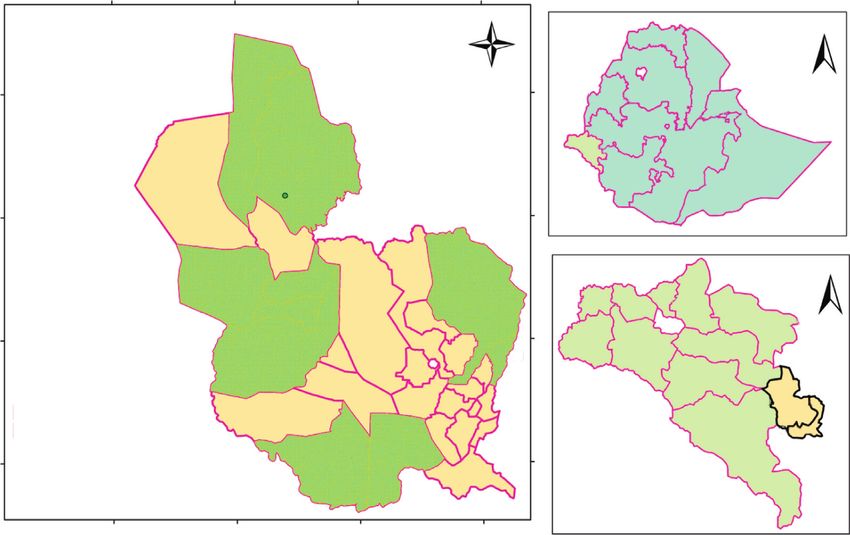
2 International Journal of Forestry Research

provide vital information about the recruitment status and species and (2) to analyse the impacts of site factors on the
the sustainability of population management. It is evidence natural regeneration of tree species of Majang forest bio-
for further planning and conservation strategies and helps sphere reserves.
recognise forest ecosystems and biodiversity [11].
 Regeneration is a vital part of any forest ecosystem 2. Materials and Methods
dynamics, as well as it regulates the existence of species and
restoration of forest land degradation [12], and it could be 2.1. Description of Study Area. This study was conducted in
playing a great role in planning, forest conservation, and the Majang Forest Biosphere Reserve (MFBR), which is
sustainable management [13]. Sustainable forest manage- found in the Majang Zone, Gambella Peoples National
ment and utilisation could be possible if there is sufficient Regional State of Ethiopia. It has unique biogeography and
evidence available on the regeneration dynamics and shares a border with the Illubabor zone of the Oromia re-
factors influencing important canopy tree species [8]. The gional state and Sheka and Bench-Maji zones of the
regeneration status of sample species can be accessed based Southern Nations, Nationalities, and Peoples (SNNP). It
on total seedling and sapling density dynamics in a given covers a total area of 233,254 ha of forest, woodland, agri-
plant community [9, 14]. As a result, the assessment of cultural and rural settlement, and towns (Figure 1). The
population structure and regeneration status is necessary to MFBR is located between 07°08′00″–07°50′00″ latitude and
establish the effective conservation and management of 34°50′00″–35°25′00″ longitude, and the area has an altitude
forest resources base [15]. of 562 m to 2444 m [1].
 Population dynamics of seedlings, saplings, and tree The climate of the zone is generally characterised by a hot
plant species can demonstrate the regeneration profile of a and humid type, which is marked on most rainfall maps of
given species. A population with a sufficient number of Ethiopia as being the wettest part of the country. The annual
seedlings and saplings depicts satisfactory regeneration [16], average rainfall is 1774 mm, and means annual minimum
but a scarce number of seedlings and saplings of the species and maximum monthly temperature ranges between 13.9
show a poor regeneration state [17]. Furthermore, the re- and 31.8°C in the Tinishu Meti metrological station. The
generation status of a species is poor if the number of annual average rainfall is 2053 mm, and means annual
seedlings and saplings is much less than mature individuals minimum and maximum monthly temperature ranges be-
[18]. The major causes for the destruction of natural forests tween 11.8 and 29.7°C in the Ermichi metrological station.
are agricultural expansion and overexploitation for various The maximum average monthly temperature is in February
purposes such as fuel wood, charcoal, construction material, (29.8°C and 31.8°C), while the minimum is in January
and timber [19], which are responsible for the high deg- (11.9°C and 13.9°C) in Ermichi and Tinishu Meti, respec-
radation of regeneration status and population structure of tively. The maximum rainfall is between April and October
the species in Majang forest biosphere reserves [20]. and low rainfall from November to March (NMSA, 2019)
 A biosphere reserve is an area established to conserve (Figure 2).
the biological and cultural diversity of a region while The pattern of land use is changing from time to time
promoting sustainable economic and social development depending on cultural background and socioeconomic
[21]. The requirements of biosphere reserves should, ex- change. There is a changing trend in the major land use/land
plicitly, fulfil three basic functions: conservation function, cover types in Majang forest biosphere reserves [19]
development function, and logistics function [22]. Now- (Table 1).
adays, there are 699 biosphere reserves in 120 countries of According to the vegetation classification of Ethiopia
the world. Out of the total biosphere reserves, 79 are found [25], the major vegetation types of the Majang biosphere are
in 29 African countries, of which Ethiopia has five bio- Montana evergreen forest, low-land semievergreen forest,
sphere reserves such as Kafa besides Yayo, Sheka, Lake and riparian vegetations [26]. Besides, the vegetation of this
Tana, and Majang nominated in 2010, 2012, 2015, and 2017, area has different categories in terms of life forms such as
respectively [23]. high natural forest, woodlands, bushlands, and grasslands.
 The Majang biosphere reserve is located in the Majang The dominant families were Euphorbiaceae, Asteraceae,
zone of the Gambella Peoples National Regional State. The Moraceae, Fabaceae, Poaceae, Solanaceae, Rubiaceae, and
Majang biosphere reserve is a newly established forest Sapotaceae.
biosphere reserve; however, there is no first-hand infor-
mation on vegetation ecology. For effective management
and conservation of the biosphere reserves, detailed 2.2. Sampling Design. A reconnaissance survey was con-
baseline information on species composition, population ducted from 15 February up to 10 May 2020 in Majang
structure, and regeneration status is needed, which are biosphere reserves to inspect a local area. The forest cover
crucial for the conservation and sustainable management and vegetation pattern related to topography and other
of biosphere reserve tree species. The population structure apparent environmental conditions were recognised. Local
of a tree species is indicative of its past distraction and variation of forest cover and management measures was
environment. Moreover, it can be used to forecast its future assessed. Some geographical location of each forest was
status of Majang forest biosphere reserves [24]. Therefore, recorded to delineate the area. Then, the measurement of
the objectives of this study are (1) to assess species com- forest cover (ha) was determined using Google Earth map
position, structures, and regeneration of woody plant and ground survey GPS coordinates (Figure 1).
International Journal of Forestry Research 3

 34°50′0″E 35°0′0″E 35°10′0″E 35°20′0″E
 Ethiopia gambella regions
 Majang zone kebeles (MFBR) N
 N
 E Tigray
 W
 7°40′0″N S Afar
 Amhara
 Dope Beneshangul Gumu
 Dire Dawa
 Site I Addis Ababa
 Gambela Oromia
 Janje Somali
 SNNPR
 7°30′0″N

 Gambella region and zones
 N
 Newe Tingi Kabo
 Lare
 WantawoJikawo
 Site II Fejeji Itang
 Site IV
 7°20′0″N

 Gambela Zuria
 Akobo Jore Abobo
 Baya Gumari
 Gog
 Mengesh

 Dima Godere
 7°10′0″N

 Site III Gelesha
 Gonchi
 0 5 10 20 km

 Study site
 Other kebeles
 Majang zone boundary

 Figure 1: Location of the study area (Site I–IV).

 1277m 22.1°C 1774mm 300 1582 m 20.5°C 2053 mm 300
 °C °C
 mm mm
 50 100 50 100

 40 80 40 80
 Temperature

 Temperature

 31.8 29.8
 30 60 30 60

 20 40 20 40
 13.9 11.9
 10 20 10 20

 0 0 0 0
 J F M A M J J A S O N D J F M A M J J A S O N D
 Months Months
 (a) (b)

Figure 2: Mean annual temperature and rainfall recorded: (a) Tinishu Meti (1987–2017) and (b) Ermichi (1987–2017) metrological stations.
Source: NMA (2020) for climatic data.

 Table 1: Area of land use/land change in MFBR.
 Land use classes (ha)
Study period
 Forestland Farmland Grassland Settlement Water body Total
1987 196,761.6 30,791.8 3,509.2 2,050.4 141.0 233,254
2002 188,403.7 36,902.4 3,072.6 4,734.3 141.0 233,254
2017 181,504.9 40,554.8 3,192.2 7,861.1 141.0 233,254
Mean 188890.1 36083 3258 4881.9 141.0 233,254
Source: [19].

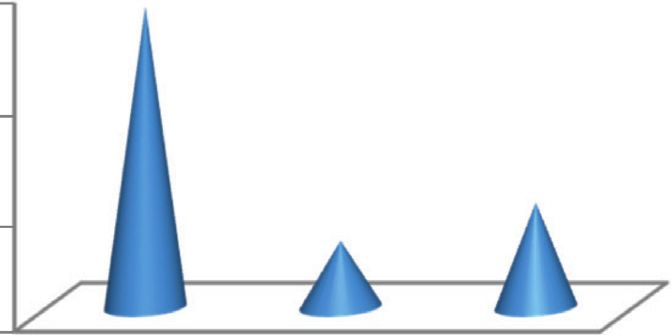
4 International Journal of Forestry Research

 The systematic sampling design was adapted from [27] to The nomenclature of plants in this study follows those
collect vegetation. The studies were arranged in four sites published in the Flora of Ethiopia as well as the Flora of
considering altitudinal deference to represent Majang forest Ethiopia and Eritrea [31, 32].
biosphere reserves: site I (Janje–Dope with an altitude of
1800 m.a.s.l.) (Table 2). relative density, frequency, relative frequency, dominance,
 There are a total of 7–9 parallel transect lines, 2000 m relative dominance, important value index, and Jaccard’s
(2 km) apart from each other. The sizes of quadrates were similarity coefficient (JSC) were analysed using the equations
determined based on the growth forms of plants [27], i.e., provided in Table 3.
400 m2 for trees; 25 m2 for seedlings and saplings, shrubs, For the sake of setting priority for conservation, all
and lianas; and 1 m2 for herbs in a nested plot design. A woody species encountered in the forest were grouped into
total of 140 large quadrats were laid down, i.e., site I, 1–45 five IVI classes based on their total IVI values according to
in “Janje–Dope”; site II, 46–85 in “Newi–Baya”; site III, the criteria developed by the Institute of Biodiversity
86–115 in “Gelesha–Gonchi”; and site IV, 116–140 in Conservation and Research (IBCR). Species that receive
“Gumare–Kabo” of Majang forest biosphere reserves lower IVI values need high conservation priority, while
(Figure 3). species that receive high IVI values need monitoring and
 management (Table 4) [38].
 The regeneration pattern of woody species was assessed by
2.3. Data Collection. In this study, the shrub is defined as a employing a total count of seedlings (woody species of
woody plant that is multistemmed at the base of the plant, height ≤ 1.3 cm and DBH ≤ 2.5 cm) and saplings (woody
whereas a liana is any long-stemmed, woody vine that uses species of height > 1.30 and DBH ≥ 2.5 cm) within the main
trees or other means for vertical support. Seedlings are quadrates [39]. Pattern 1 � If the regeneration results of
defined as woody plants with a height less than 1.30 m and woody species show seedlings > sapling > adults, “good re-
diameter of or ≤ saplings ≤ adults,
of >1.30 m and diameter at breast height (DBH) of 2.5–5 cm; “fair regeneration”, and Pattern 3 � if the woody species
and adult trees as plants with a DBH of ≥5 cm [28]. survive only in the sapling stages, “poor regeneration”. Pattern
 All tree species with diameters (DBH) of ≥5 cm were 4 � If a woody species is present only in the adult stage, it is
counted and recorded. The DBH, height, and crown cover of considered as not regenerating (“not regenerated”) [40].
individuals of the species were measured using a diameter Harvesting index was measured by means counting the
tape, clinometers, and meter tape, respectively. When the stumps individual which was an illegally logged tree inside
branching of multistemmed individuals occurred below the the plot and computed from the relative density of individual
DBH, the DBH of each stem was measured separately and a tree stump [30]. The stump relative density was computed as
common diameter of all stems by summing uptake average the sum of stump density divided by the total density (the
diameter was developed. To determine the diversity and es- sum of the logged stump and live individual tree).
timate the abundance of shrubs and lianas, subplots The variation of basal area and density of seedlings,
(area � 25 m2 each) were established. Similarly, the identity of saplings, and mature trees of all woody species in response to
species and abundance of seedlings and saplings were counted altitude along with study sites and sampling plots were
and recorded in 25 m2 area. The cover-abundance of her- computed using ANOVA (R statistical package). A corre-
baceous was estimated in five subplots (1 m2) visually within lation analysis was performed using the R statistical package
the main plot in 400 m2. And then, cover-abundance of to analyse the status of natural regeneration in response to
herbaceous from each plot was converted into 9 cover- site factors (elevation, slope, canopy openness, harvesting
abundance scale classes: 1 � (75% cover [29]. Excel 2007 software.
 The site factors such as elevation (m) and slope (%),
harvesting index, and canopy openness were measured and 3. Results
documented. Elevation and slope were measured using the
GPS and clinometer, respectively. Canopy openness was 3.1. Species Composition. A total of 158 plant species (Ap-
measured using the densitometer located at the centre of pendix 1) belonging to 115 genera and 56 families were
each plot, while harvesting index was measured by means recorded and identified in the sample plots in the MFBR
counting the stumps individual which was an illegally logged (Table 5). Of these, 80 species (51%) were trees, 26 species
tree inside the plot [30]. Stumps are a small part of a stem (16%) were shrubs, 19 species (12%) were herbs, and 33
that remains after harvesting of trees reaching a minimum species (21%) were lianas (Figure 4). Moreover, the number
diameter of ≥5 cm. of families and species were 43 (77), 45 (78), 44 (82), and 34
 Plants were identified in the field, and for those difficult (84) in study sites I, II, III, and IV, respectively (Table 5).
to identify in the field, specimens were collected, pressed, The most dominant families recorded in the MFBR were
and identified in the National Herbarium (ETH) of Ethiopia. Euphorbiaceae, Rubiaceae, and Moraceae; each represented
International Journal of Forestry Research 5

 Table 2: Locations and topographic characteristics of studied forests.
Study Area Elevation MAR Tmax Tmin Sample
 Aspects Latitude Longitude
site (ha) (m) (mm) (oC) (oC) plots
 NE, NW, SE,
Site I 22,826.1 1042 ± 42.5 7°40′00″–7°30′00″ 35°0′00″–35°10′00″ 1774 31.8 14.8 40
 W, E, SW
Site II 25,220.5 1365 ± 24.6 S, E, NE, SE 7°15′00″–7°26′00″ 34°30′00″–35°10′00″ 1774 31.8 14.8 45
 NW, S, NE, N,
Site III 14,053 1635.8 ± 24.6 7°05′00″–7°12′00″ 35°0′00″–35°15′00″ 1774 31.8 14.8 30
 SE
Site IV 11,783.5 2011.4 ± 42.5 S, N, NE, NW 7°18′00″–7°28′00″ 35°15′00″–35°25′00″ 2053 29.8 12.8 25
MAR � mean annual rainfall, Tmin � minimum temperature, Tmax � maximum temperature. Sites I, II, and III are found in the Tinishu Meti metrological
station, while site IV is found in the Ermichi metrological station. Source: NMA (2020) for climatic data.

 (a) (b)

 (c) (d)

Figure 3: (Photo 1) Feature of the study sites. Source: Semegnew T (2020). (a) Site I (Janje–Dope). (b) Site II (Newi–Baya). (c) Site III
(Gonchi–Gelesha). (d) Site IV (Gumare–Kabo).

 Table 3: List of equations used for the calculation of vegetation parameters.
Vegetation parameters Equation Equation no. Reference
Density D � n/N 1 [33]
Relative density RD � (n/N)∗ 100 2 [34, 35]
Frequency F � (x/y)∗ 100 3 [33]
Relative frequency RF � (Fi/ si�1 (Fi))∗ 100 4 [34, 35]
Basal area BA � (π Db H2 /4 ) 5 [36]
Relative basal area BA � Bi/ si�1 Bi 6 [36]
Dominance Do � si�1 Bi/Bi 7 [36]
Relative dominance Do � Di/ si�1 Di 8 [36]
Important value index (IVI) IVI � RD + RF + RD 9 [33, 35, 36]
Jaccard’s similarity coefficient (JSC) Sj � a/(a + b + c) 10 [37]
a � number of tree species common to sites A and B; b � number of tree species recorded only site A; c � number of tree species recorded only in site B; n: total
number of individuals of the species; N: total number of individuals of all the species; x: total number of quadrats in which the species occurs; y: total number
of quadrats studied; Fi: frequency of one species; Bi: basal area of one species; Di: dominance of one species.
6 International Journal of Forestry Research

 Table 4: Criteria for setting IVI classes and conservation priority based on IVI values.
IVI values % IVI class Priority class Required intervention
>30 1 5 Monitoring and management
20.1–30 2 4 Monitoring and management
10.1–20 3 3 Conservation/restoration
1–10 4 2 Conservation/restoration
 5 m) per hectare. There were a total of 80
3.2. Similarity in Species Composition. The similarities in woody species in all density classes. The species were clas-
species composition were ranged from 2% to 71% between sified into 6 density classes, A–F, as follows: A ≤ 1;
study sites in Majang forest biosphere reserves. There is B � 1.01–10; C � 10.1–20; D � 20.1–35; E � 35.01–50; and
dissimilarity in tree species composition between sites I and F � >50. Based on density classes, 21 (B), 32 (C), 14 (D), 7
IV (2%), sites II and IV (4%), and sites III and IV (2%). The (E), and 6 (F) species exist in each density class respectively,
highest similarity species composition of the tree was 71% while no species exist in density class A (Figure 5). The
between sites I and II, whereas the lowest similarity was 2% highest tree density was in site III (1478 stems ha−1) (Table 5

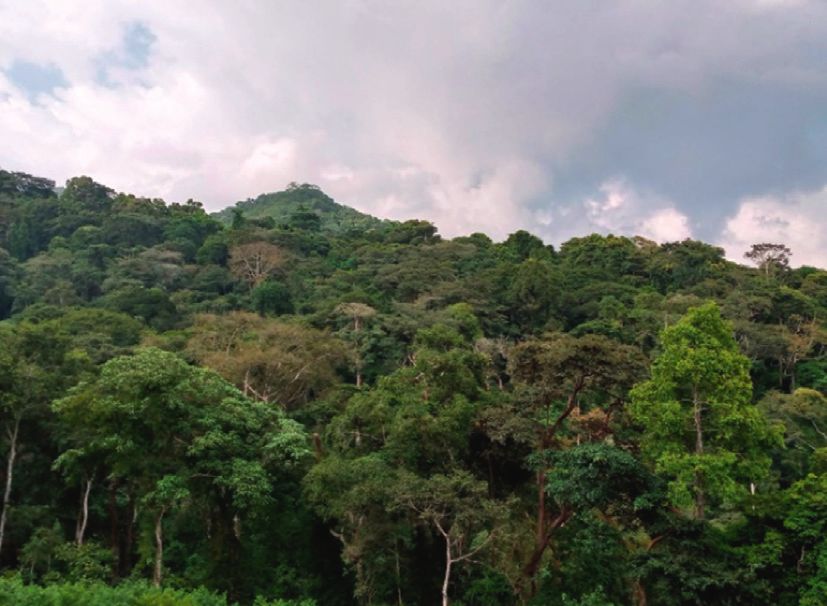
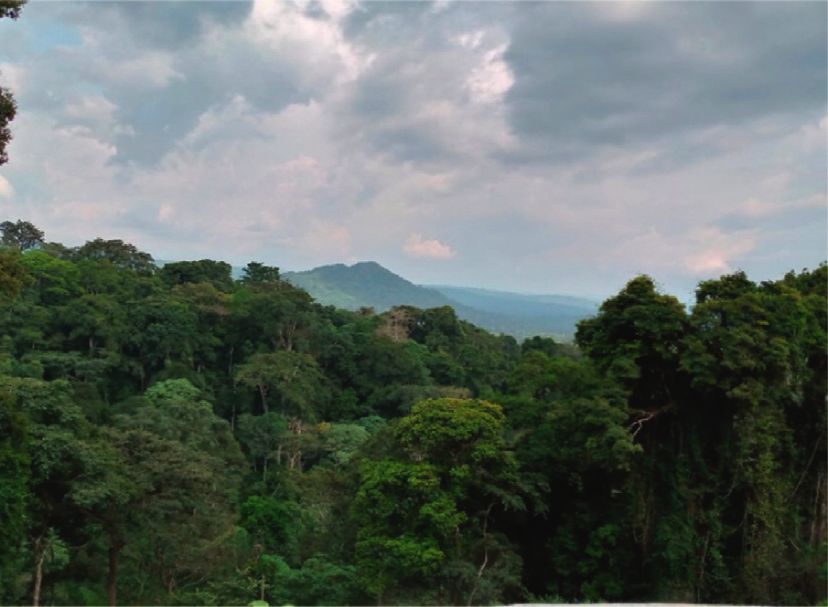
International Journal of Forestry Research 7

 Table 6: Species composition similarity among study sites. Rothmannia urcelliformis, Bersama abyssinica, Ficus thon-
 Jaccard’s similarity coefficient (SJ)
 ningii, Ficus exasperata, Psychotria orophila, Vernonia
Study sites hochstetteri, and Celtis toka (Appendixes 2–6). The fre-
 Site I Site II Site III Site IV
 quency distribution of woody species in the MFBR shows
Site I that the number of tree species found in the first frequency
Site II 0.71
 classes is higher and gradually decreases towards higher
Site III 0.61 0.63
Site IV 0.02 0.04 0.02
 frequency classes (Figure 6). The frequency values of the
 woody species ranged from 0.1% to 99% in the MFBR.
 In the site I, the frequency ranges from 4% to 88%, and the
 Density class distribution most frequent woody species were Celtis zenkeri (88%),
 35
 Pouteria altissima (76%), Diospyros abyssinica (72%), and
 30 Antiaris toxicaria (72%); and the least frequent woody species
 25 were Mimusops lanceolata (13%), Combretum molle (10%),
 No. of species

 20 and Albizia grandibracteata (5%) (Table 7, Appendix 3).
 15 In site II, the frequency ranges from 4% to 100%, and the
 most frequent woody species are Pouteria altissima (100%),
 10
 Celtis zenkeri (84%), Lannea welwitschii (68%), and Leca-
 5
 niodiscus fraxinifolius (64%), while the least frequent woody
 0 species were Tapura guianensis (8%), Teclea nobilis (8%),
 A B C D E F
 Density classes
 Buddleja polystachya (4%), and Dombeya torrida (4%)
 (Table 7, Appendix 4). Celtis zenkeri (95%), Blighia unijugata
Figure 5: Density class distribution of woody species in MFBR. (90%, Pouteria alnifolia (75), and Pouteria altissima (70%)
 were the most frequent woody species, while Apodytes
and Appendix 5), while the lowest tree density ha−1 was in dimidiata (5%), Deinbollia kilimandschrica (5%), and
site I (1232 ha−1) (Table 5 and Appendix 3). There was a Plumbago auriculata (0.1%) were rarely occurred species in
significant difference in density ha−1 between study sites study site III (Table 7, Appendix 5). In site IV, Dracaena
(F � 156.5, df � 56.23, P � 0.000003). Likewise, the tree afromontana (100%), Cyathea manniana (100%), and Ver-
densities were significantly different between site I and site II nonia auriculifera (85%) were the highest frequency value,
(F � 101.1, P � 0.0007), site II and site III (F � 26.16 while Phoenix reclinata (25%), Coffea arabica (20%), and
P � 0.0087), and site III and site IV (F � 176.4, P � 0.0012). Psychotria orophila (15%) exhibited the lowest frequency
The species that showed the highest density were Celtis value.
zenkeri (141 ha−1), Pouteria altissima (102 ha−1), Blighia
unijugata (115 ha−1), and Cyathea manniana (96.25 ha−1) in
sites I, II, III, and IV, respectively (Table 7). The species that 3.3.3. Basal Area. The basal area value ranges from 54.8 to
showed the least density were Albizia grandibracteata 76.3 m2·ha−1 from the study site I–IV, respectively. The
(5 ha−1), Teclea nobilis (2 ha −1), Castanea sativa (3.75 ha−1), lowest and highest basal area values were in the study sites I
and Bersama abyssinica (10 ha−1) in sites I, II, III, and IV, and IV, respectively (Table 5 and Appendixes 9–12). The
respectively (Appendixes 13–16). mean basal area of the four study sites was
 Furthermore, the density of trees species with DBHs 63.6 ± 5.4 m2·ha−1. The ANOVA result indicated that there
5–10 cm, 10.1–20 cm, and >20 were 282.2 (20.9%), 617.50 was a significant difference in the basal area (P < 0.05) be-
(20.9%), and 450.3 (33.4%) individuals per hectare, re- tween study sites (F � 37.5, df � 53.44, P � 0.000003). Simi-
spectively. Accordingly, the ratio of individuals between larly, the basal area was significantly different (P < 0.05)
DBH classes 10.1–20 cm (a) to DBH > 20 cm (b) was 1.4 in between site I and site II (F � 6.123, P � 0.01912), site II and
the study area (Table 8). site III (F � 106.4, P � 0.0000081), and site III and site IV
 (F � 107.7, P � 0.0000075) (Table 5).
 The total dominance was 54.5 m2·ha−1 in site I, the
3.3.2. Frequency of Woody Species. Based on their total highest 4.25 m2·ha−1 (7.79%) and the lowest basal area
frequency percentage, the species were grouped in the fol- 0.05 m2·ha−1 (0.09%) were contributed by Celtis zenkeri and
lowing five frequency classes: A � 0–20%; B � 21–40%; Teclea nobilis, respectively (Appendix 9). About
C � 41–60%; D � 61–80; and E � 81–100%. In this study, 24, 28.92 m2·ha−1 (53.2%) of the total basal area was covered by
16, 10, 5, and 2 species were recorded in frequency classes A, ten large-sized tree species in study site I (Table 9). Cordia
B, C, D, and E, respectively (Figure 6). Dracaena afro- africana exhibited low density and high basal area due to its
montana was the most frequent woody species in the MFBR maximum average DBH value. A total of 25.62 m2·h−1
occurring in 90% of the sample plots followed by Celtis (46.98%) was contributed by 27 species in study site I
zenkeri (65%), Pouteria altissima (62.5%), Triumfetta (Appendix 9).
tomentosa (45%), Polyscias fulva (45%), Schefflera abyssinica In study site II, the total basal area was 56.8 m2·ha−1 with
(45%), and Pouteria adolfi-friederici (45%) (Table 7, Ap- the highest 4.03 m2·ha−1 (7.09%) and the lowest basal area
pendixes 2–6). The least frequent woody species in the 0.04 m2·ha−1 (0.07%) were contributed by P. altissima and
MFBR occurring below 5% of the sampled plots were P. fulva, respectively (Table 9 and Appendix 9). About

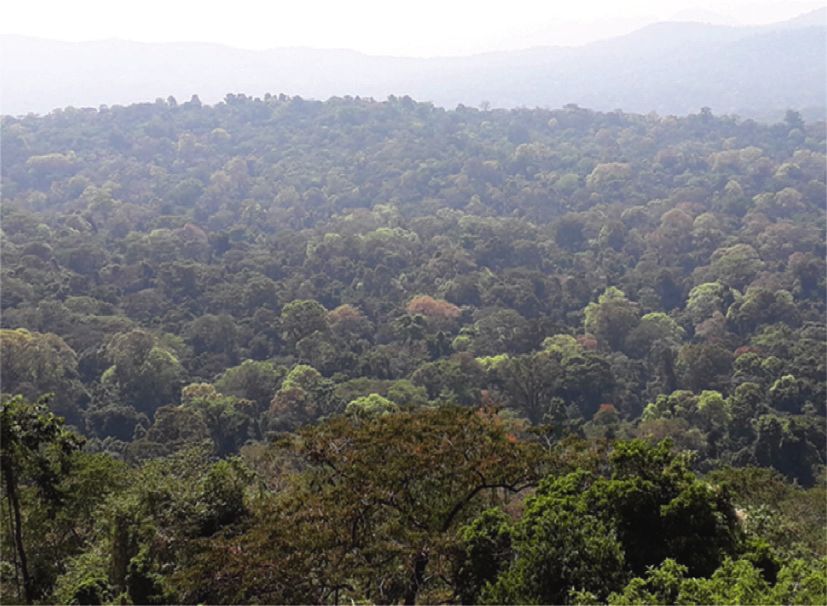
8 International Journal of Forestry Research

 Table 7: The top ten species with the highest IVI value in all the sites of MFBR.
Species scientific name D DO Fr RD RDO RFr IVI CPC
All sites
Celtis zenkeri (A.Rich) Wedd 81.3 34.9 65.0 6.1 0.3 3.37 9.8 2
Pouteria altissima (A.Chev.) Baehni 64.1 38.2 62.5 4.8 0.3 3.24 8.4 2
Blighia unijugata Bak. 45.6 44.7 40.0 0.2 7.8 0.19 8.2 2
Lecaniodiscus fraxinifolius Bak. 59.4 55.0 38.8 4.4 0.5 2.01 6.9 2
Dracaena afromontana Mildbr. 22.5 46.9 90.0 1.7 0.4 4.67 6.8 2
Antiaris toxicaria Resch 48.4 55.0 41.3 3.6 0.5 2.14 6.2 2
Baphia abyssinica Brummit 48.8 55.0 33.8 3.6 0.5 1.75 5.9 2
Celtis toka (Forssk.) Hepper & Wood 32.5 879.3 3.8 3.4 0.4 2.08 5.9 2
Schefflera abyssinica (Hochst. ex A. Rich. 11.3 239.1 45.0 0.8 2.1 2.33 5.3 2
Pouteria adolfi-friederici (Engl.) Baehni 11.3 68.7 41.3 2.4 0.6 2.14 5.2 2
Site I
Celtis zenkeri (A.Rich) Wedd 141 14.1 88 10.7 0.74 6.9 18.3 3
Diospyros abyssinica (Hiern) F.White 86 24.6 72 6.5 1.29 5.6 13.4 3
Antiaris toxicaria Resch 88 16.9 72 6.7 0.89 5.6 13.2 3
Pouteria altissima (A.Chev.) Baehni 81 14.9 76 6.1 0.78 5.9 12.8 3
Morus mesozygia Stapf. 53 53.7 68 4.0 2.81 5.3 12.1 3
Teclea nobilis Del. 18 157.6 32 1.4 8.26 2.5 12.1 3
Lecaniodiscus fraxinifolius Bak. 81 20.2 60 6.1 1.06 4.7 11.9 3
Celtis toka (Forssk.) Hepper & Wood 60 24.7 68 4.6 1.29 5.3 11.1 3
Blighia unijugata Bak. 57 21.2 56 4.3 1.11 4.4 9.8 2
Lannea welwitschii (Hiern) Engl. 33 59.8 44 2.5 3.14 3.4 9.0 2
Site II
Pouteria altissima (A.Chev.) Baehni 102 14.0 100 8.3 3.07 7.3 18.6 3
Celtis zenkeri (A.Rich) Wedd 87 18.1 84 7.1 3.14 6.1 16.3 3
Lecaniodiscus fraxinifolius Bak. 100 20.8 64 8.1 3.52 4.7 16.3 3
Baphia abyssinica Brummit 69 18.2 48 5.6 2.90 3.5 12.0 3
Cordia africana Lam. 59 14.6 60 4.8 2.61 4.4 11.8 3
Antiaris toxicaria Resch 61 25.3 56 5.0 2.59 4.1 11.6 3
Ficus exasperata Vahl 37 42.1 44 3.0 5.28 3.2 11.5 3
Celtis toka (Forssk.) Hepper & Wood 29 42.8 48 2.4 5.14 3.5 11.0 3
Ritchiea albersii Gilg 42 55.9 56 3.4 3.43 4.1 10.9 3
Lannea welwitschii (Hiern) Engl. 43 20.0 68 3.5 1.05 4.9 9.5 2
Site III
Blighia unijugata Bak. 115 32.6 90 7.8 1.02 5.3 14.10 3
Celtis zenkeri (A.Rich) Wedd 93.7 18.9 95 6.3 0.59 5.6 12.53 3
Pouteria alnifolia (Bak.) Roberty 71.2 97.7 75 4.8 3.06 4.4 12.30 3
Pouteria altissima (A.Chev.) Baehni 77.5 25.0 70 5.2 0.78 4.1 10.15 3
Baphia abyssinica Brummit 80 21.2 60 5.4 0.66 3.5 9.61 2
Margaritaria discoidea (Baill.) Webster 48.7 41.3 65 3.3 1.29 3.8 8.42 2
Antiaris toxicaria Resch 57.5 34.1 45 3.9 1.07 2.6 7.61 2
Trichilia prieuriana A.Juss 53.7 41.3 45 3.6 1.29 2.6 7.58 2
Combretum molle R.Br. ex G.Don 53.7 29.7 50 3.6 0.93 2.9 7.51 2
Lannea welwitschii (Hiern) Engl. 47.5 47.9 45 3.2 1.50 2.6 7.36 2
Site IV
Cyathea manniana Hook 96.3 27.2 100 11.2 1.1 4.0 16.3 3
Dracaena afromontana Mildbr. 90.0 19.2 100 10.5 0.8 4.0 15.3 3
Trilepisium madagascariense DC 71.3 23.4 65 6.8 1.0 2.6 10.4 3
Allophylus abyssinicus (Hochst.) Radlk. 45.0 24.8 80 5.5 1.0 3.2 9.7 2
Pouteria adolfi-friederici (Engl.) Baehni 45.0 97.2 80 2.2 4.1 3.2 9.5 2
Vernonia auriculifera Hiern 43.8 61.2 85 2.7 2.6 3.4 8.7 2
Schefflera abyssinica (Hochst. ex A.Rich.) 67.5 59.3 40 4.4 2.5 1.6 8.5 2
Schefflera myriantha (Bak.) Drake 45.0 77.5 60 2.7 3.3 2.4 8.4 2
Ilex mitis (L.) Radlk. 40.0 46.9 80 2.6 2.0 3.2 7.8 2
Galiniera saxifraga (Hochst.) Bridson 35.0 53.3 75 2.5 2.2 3.0 7.8 2
D � density, DO � dominance, Fr � frequency, RD � relative density, RDO � relative dominance, RFr � relative frequency, IVI � importance value index, and
CPC � conservation priority class.
International Journal of Forestry Research 9

 Table 8: Density of tree species by DBH classes in MFBR.
DBH (cm) No. of individuals (ha−1) Percentage (%) Ratio a to b
5–10 282.19 20.9 1.4
10.1–20 (a) 617.50 45.7
>20 (b) 450.3 33.4
 1350 100.0

 Frequency class distribution
 25

 No. of species 20

 15

 10

 5

 0
 A B C D E
 Frequency class
 Figure 6: Frequency class distribution of woody species.

 Table 9: Dominant trees with their BA and percentage in all the sites of MFBR.
Scientific name TD Average DBH BA (m2/ha) % BA
Site I
Celtis zenkeri (A.Rich.) Wedd 141 20.5 4.25 7.79
Pouteria altissima (A.Chev.) Baehni 81 27 3.87 7.09
Cordia africana Lam. 57 44.5 3.21 5.88
Antiaris toxicaria Resch 88 16.6 3.01 5.52
Blighia unijugata Bak. 57 19 2.69 4.93
Lecaniodiscus fraxinifolius Bak. 81 15 2.61 4.78
Baphia abyssinica Brummit 46 20.5 2.57 4.71
Celtis toka (Forssk.) Hepper & Wood 60 15.5 2.32 4.25
Diospyros abyssinica (Hiern) F.White 86 16.7 2.23 4.09
Mimusops lanceolata A.DC 13 23.2 2.16 3.96
Total 710 218.5 28.92 53.0
Site II
Pouteria altissima (A.Chev.) Baehni 102 27 4.03 7.09
Cordia africana Lam. 59 44.5 3.87 6.81
Celtis zenkeri (A.Rich.) Wedd 87 20.5 3.12 5.49
Baphia abyssinica Brummit 69 20.5 3.10 5.46
Lannea welwitschii (Hiern) Engl. 43 28 2.82 4.96
Lecaniodiscus fraxinifolius Bak. 100 15 2.71 4.77
Blighia unijugata Bak. 31 19 2.69 4.73
Trichilia prieuriana A.Juss. 28 20 2.51 4.42
Grewia mollis A.Juss. 32 25.8 2.35 4.14
Antiaris toxicaria Resch 61 16.6 2.23 3.92
Total 612 236.9 29.43 51.79
Site III
Celtis zenkeri (A.Rich) Wedd 93.75 20.5 3.76 5.61
Pouteria altissima (A.Chev.) Baehni 77.5 27 3.44 5.14
Celtis toka (Forssk.) Hepper & Wood 42.5 15.5 3.38 5.04
Baphia abyssinica Brummit 80 20.5 3.30 4.92
Blighia unijugata Bak. 115 19 2.95 4.40
Cordia africana Lam. 22.5 44.5 2.80 4.18
Lecaniodiscus fraxinifolius Bak. 58.75 15 2.74 4.09
Ficus mucuso (Ficatho) 31.25 27.5 2.70 4.03
Diospyros abyssinica (Hiern) F.White 42.5 16.7 2.66 3.96
10 International Journal of Forestry Research

 Table 9: Continued.
Scientific name TD Average DBH BA (m2/ha) % BA
Combretum molle R.Br. ex G.Don 53.75 31 2.34 3.49
Total 617.5 237.2 30.07 44.86
Site IV
Dracaena afromontana Mildbr. 72 25 3.97 5.21
Cordia africana Lam. 16 14 3.46 4.54
Galiniera saxifraga (Hochst.) Bridson 52 18 3.36 4.41
Ficus sur Forssk. 19 17 3.27 4.28
Trilepisium madagascariense DC 57 17 3.27 4.28
Allophylus abyssinicus (Hochst.) Radlk 36 18 3.08 4.04
Cyathea manniana Hook 77 21 2.80 3.68
Schefflera abyssinica (Hochst. ex A.Rich.) Harms 54 18 2.06 2.70
Albizia gummifera (J.F.Gmel.) C.A.Sm. 29 16 2.01 2.64
Dracaena afromontana Mildbr. 35 16 2.01 2.64
Total 447 180 29.29 38.42
BA � basal area, MFBR � Majang Forest Biosphere Reserve, and TD � tree density.

29.43 m2·ha−1 (51.8%) of the total basal area was covered by More in detail, the results of IVI in the four study sites
ten large-sized tree species in study site II. C. africana showed different values. The IVI value ranges from 3.6% to
exhibited low density and high basal area due to its maxi- 18.3%, and the highest IVI values exhibited tree species were
mum average DBH value (Table 9). A total of 27.39 m2·h−1 C. zenkeri (18.3%), D. abyssinica (13.4%), A. toxicaria
(48.2%) was contributed by 31 species in study site I (Ap- (13.2%), and P. altissima (12.8%), whereas the lowest tree
pendix 10). species were M. butugi (4.3%), A. grandibracteata (4.3%),
 In study site III, the total basal area was 67.1 m2·ha−1, the and M. lanceolata (3.6%). About 123.5% of IVI values was
highest 3.76 m2·ha−1 (7.09%) and the lowest basal area contributed by the top ten tree species, whereas 176.5% was
0.07 m2·ha−1 (0.11%) were exhibited by C. zenkeri and contributed by the remaining 27 tree species from the total
Castanea sativa, respectively (Table 9 and Appendix 11). of 300 IVI values in study site I (Table 7, Appendix 3).
About 30.07 m2·ha−1 (44.9%) of the total basal area was In study site II, the IVI values of tree species range from
covered by ten large-sized tree species in study site III. 1.4 to 18.6%; and about 129.4% of IVI was contributed by the
C. africana exhibited low density and high basal area due to top ten tree species, whereas 31 tree species contributed the
its maximum average DBH value (Table 9). A total of remaining 170.5% IVI value. The highest IVI values
36.96 m2·h−1 (55.14%) was contributed by 36 species in study exhibited tree species were P. altissima (18.6%), C. zenkeri
site I (Appendix 11). (16.3%), L. fraxinifolius (16.3%), and B. abyssinica (12%),
 Similarly, in study site IV, the total basal area was whereas the lowest values exhibited tree species were P. fulva
76.3 m2·ha−1, the highest 3.97 m2·ha−1 (5.21%) and the lowest (2.3%), T. nobilis (1.8%), and B. polystachya (1.4%) (Table 7,
basal area 0.64 m2·ha−1 (0.83%) were contributed by Appendix 4).
D. afromontana and B. abyssinica, respectively (Table 9 and The IVI value ranges from 1.29% to 14.1%, and the
Appendix 12). About 29.29 m2·ha−1 (38.42%) of the total highest IVI values exhibited tree species were B. unijugata
basal area was covered by ten large-sized tree species in study (14.1%), C. zenkeri (12.5%), P. alnifolia (13.2%), and
site III. C. africana exhibited low density and high basal area P. altissima (10.2%), whereas the lowest values exhibited
due to its maximum average DBH value (Table 9). A total of tree species were M. butugi (4.3%), A. grandibracteata
46.96 m2·h−1 (61.58%) basal area was contributed by 36 (4.3%), and M. lanceolata (3.6%). From the total tree
species in study site I (Appendix 12). species, about 97.2% of IVI values was contributed by top
 ten tree species and 202.8% IVI was contributed by 37
 species in study site III (Table 7, Appendix 5). In study site
3.3.4. Importance Value Index. The importance value index IV, the IVI values of tree species range from 3.5 to 16.3%,
(IVI) of tree species showed a great variation, ranging from and about 102.5% of IVI was contributed by the top ten tree
1.1% to 9.8% in the overall study site (Appendix 2). The first species, whereas 35 tree species contributed the remaining
top ten leading and ecologically most important tree 197.5% of IVI values.
species in the MFBR were C. zenkeri, P. altissima,
B. unijugata, L. fraxinifolius, D. afromontana, A. toxicaria,
B. abyssinica, C. toka, S. myriantha, and P. adolfi-friederici 3.4. Population Structure Woody Species. Tree species of the
and contributed 68.5% of the IVI (Table 7). About 231.5% study area were divided into seven height and DBH
of the IVI was contributed by the remaining 75 species classes. The overall height and DBH class distribution of all
(Appendix 2). individuals of different sizes showed more or less an
International Journal of Forestry Research 11

inverted J-shape distribution in the MFBR (Figures 7(a) >5 cm, 7 tree species were not represented by seedlings and
and 7(b)). Similarly, the distribution of individuals in 11 tree species were not represented by saplings. Twelve tree
different height and DBH classes was showed more or less species contributed 73.6% and 34.7% of the total seedling
an inverted J-shape distribution in each study site and sapling count, respectively (Table 10). They are D.
(Figures 8(a) and 8(b)). abyssinica, A. toxicaria, P. altissima, B. unijugata, C. zenkeri,
 In this study, six representative patterns of population C. sylvaticus, L. fraxinifolius, B. abyssinica, G. mollis,
distribution based on DBH were revealed for tree species P. alnifolia, D. afromontana, and G. saxifraga (Appendix 7).
(Figures 9(a)–9(f )), which are mentioned as follows: Regeneration status was represented by the following
 four distribution patterns (Figure 10):
 (1) Inverted J-shape, which shows a pattern where
 species frequency distribution has the highest fre- Pattern (1): this pattern was exhibited by C. sativa, L.
 quency in the lower diameter classes and a gradual fraxinifolius, B. abyssinica, A. toxicaria, C. manniana,
 decrease towards the higher classes; e.g., Celtis D. afromontana, and G. saxifrage (Figure 10(a),
 zenkeri and Lecaniodiscus fraxinifolius in study site Tables 11–14)
 II; Blighia unijugata and Antiaris toxicaria in study
 site III; and Schefflera myriantha in study site IV. Pattern (2): this pattern was exhibited by C. zenkeri,
 (2) An increase from DBH class I to DBH class II and L. fraxinifolius, P. altissima, A. toxicaria, D. abyssinica,
 followed by a gradual decrease towards the higher C. toka, B. unijugata, M. mesozygia, P. alnifolia,
 DBH classes; e.g., Celtis zenkeri, Diospyros abyssin- G. mollis, L. welwitschii, F. sur Forssk, B. abyssinica, M.
 ica, Antiaris toxicaria, Pouteria altissima, Lecanio- oppositifolius, S. abyssinica T. tomentosa, S. myriantha,
 discus fraxinifolius, and Celtis toka in study site I; P. adolfi-friederici, and A. abyssinicus (Figure 10(b) and
 Baphia abyssinica in study sites II and III; and 10(c), Tables 11–14)
 Cyathea manniana, Dracaena afromontana, and Pattern (3): this pattern was exhibited by F. mucuso, A.
 Vernonia auriculifera in study site IV. This pattern dimidiata, F. sur Forssk, G. buchananii, M. ferruginea,
 represents more or less a normal population E. fischeri, F. exasperate, C. africana, L. senegalensis,
 structure. A. grandibracteata, D. torrida, S. myriantha,
 (3) U-shape, which shows a type of frequency distri- C. oligocarpum, and E. ampliphylla (Figure 10(d),
 bution in which there is a high number of lowest and Appendixes 9–12)
 highest diameter classes but a very low number of Pattern (4): this pattern was exhibited by R. albersii,
 intermediate classes; e.g., Pouteria altissima in study F. angolensis, C. africana, and A. chinense (Figure 10(e),
 site II, and Ilex mitis and Schefflera abyssinica in Tables 11–14)
 study site IV.
 In addition, the regeneration status of the top ten species
 (4) Irregular shape, which shows a pattern where the in each study site is indicated in Tables 11–14. The regen-
 frequency is high at lower DBH classes but becomes eration status of all the woody plant species was categorised
 irregular towards higher classes. The species that as “not regenerate” (9.6%), “poor” (30.7%), “fair” (59.5%),
 show such pattern are Pouteria altissima, Vernonia and “good” (10.8%) in all sites.
 auriculifera, and Morus mesozygia in study site I;
 In study site I, the total density of the top ten species of
 Antiaris toxicaria n study site II; and Pouteria
 trees, saplings, and seedlings were 313.5 ± 3.8, 176.8 ± 3.5,
 alnifolia, Pouteria altissima, and Trichilia prieuriana
 and 534.7 ± 12.1, respectively (Table 11, Appendix 8).
 in study site III.
 Consequently, the regeneration status of saplings and
 (5) Bell-shaped is a type of frequency distribution in seedlings showed the regeneration categories “not regen-
 which several individuals in the middle diameter erate” (11.1%), “poor” (17.1%), “fair” (65.7%), and “good”
 classes are high and lower in lower and higher di- (2.9%) in study site I (Figure 11). The densities of tree,
 ameter classes; e.g., Cordia Baphia abyssinica in site I; sapling, and seedling were 339 ± 3.1, 225.6 ± 7.5, and
 Cordia africana and Ficus exasperate in study site II; 646.7 ± 15.7, respectively (Table 12, Appendix 9), and the
 and Trilepisium madagascariense in study site IV. regeneration status showed different categories including
 (6) J-shaped; e.g., Allophylus abyssinicus in study site IV. “not regenerate” (7.1%), “poor” (30.2%), “fair” (51.2%), and
 This pattern represents abnormal population dy- “good” (9.3%) in the study site II (Figure 11).
 namics and shows poor reproduction and hampered Similarly, in study site III, the densities of trees, saplings,
 regeneration since either most trees are not pro- and seedlings were 270.1 ± 3.1, 320.9 ± 7.5, and 978 ± 15.7,
 ducing seeds due to age or there are losses due to respectively (Table 13, Appendix 10), and regeneration
 predators after reproduction. status was categorised as “not regenerate” (15.9%), “poor”
 (13.6%), “fair” (59.1%), and “good” (9.1%), (Figure 11). The
3.5. Regeneration Status of Woody Species. The total density densities of trees, saplings, and seedlings were 615 ± 3.1,
of seedlings, saplings, and trees was 3461 ha−1, 1203 ha−1, 708.7 ± 7.5, and 1657.5 ± 15.7, respectively (Table 14, Ap-
and 1350 ha−1, respectively. Out of 80 trees species of DBH pendix 11), and showed different regeneration statuses
12 International Journal of Forestry Research

 1400 1200

 Number of individuals

 Number of individuals
 1200 1000
 1000
 800
 800
 600
 600
 400
 400
 200 200
 0 0
 1 2 3 4 5 6 7 1 2 3 4 5 6 7
 DBH classes Height classes
 (a) (b)

Figure 7: DBH and height class distribution of all individuals. (a) DBH classes: 1 � 5–10 cm; 2 � 10.01–20 cm; 3 � 20.01–30 cm;
4 � >30.01–40 cm; 5 � 40.01–50 cm; 6 � 50.01–80 cm; 7� > 80 cm. (b) Height classes: 1 � 2–5 m; 2 � 5.01–10 m; 3 � 10.01–15 m;
4 � 15.01–20 m; 5 � 20.01–25 m; 6 � 25.01–30 m; 7� > 30 m.

 500 400

 Number of Individuals
 Number of individuals

 400 300
 300
 200
 200
 100 100

 0 0
 1 2 3 4 5 6 7 1 2 3 4 5 6 7
 DBH classes Height classes
 Site I Site III Site I Site III
 Site II Site IV Site II Site IV
 (a) (b)

Figure 8: DBH and height class distribution of all individuals. (a) DBH classes: 1 � 5–10 cm; 2 � 10.01–20 cm; 3 � 20.01–30 cm;
4 � >30.0140 cm; 5 � 40.01–50 cm; 6 � 50.01–80 cm; 7 � >80 cm. (b) Height classes: 1 � 2–5 m; 2 � 5.01–10 m; 3 � 10.01–15 m; 4 � 15.01–20 m;
5 � 20.01–25 m; 6 � 25.01–30 m; 7 � >30 m.

 80 50
 70
 40
 60
 Density ha–1

 Density ha–1

 50 30
 40
 30 20

 20
 10
 10
 0 0
 1 2 3 4 5 6 7 1 2 3 4 5 6 7
 DBH classes DBH classes
 (a) (b)
 Figure 9: Continued.
International Journal of Forestry Research 13

 50 15

 40
 10

 Density ha–1
 Density ha–1

 30

 20
 5
 10

 0 0
 1 2 3 4 5 6 7 1 2 3 4 5 6 7
 DBH classes DBH classes
 (c) (d)
 25 50

 20 40
 Density ha–1

 Density ha–1
 15 30

 10 20

 5 10

 0 0
 1 2 3 4 5 6 7 1 2 3 4 5 6 7
 DBH classes DBH classes
 (e) (f )

Figure 9: Pattern of frequency distribution of selected tree species over DBH classes (1 � 5–10 cm; 2 � 10.01–20 cm; 3 � 20.01–30 cm;
4 � >30.01–40 cm; 5 � 40.01–50 cm; 6 � 50.01–80 cm; 7 � >80 cm) in all sites. (a) C. zenkeri in site I. (b) P. altissima in site II. (c) B. unijugata
in site III. (d) B. abyssinica in site I. (e) V. auriculifera in site I. (f ) A. abyssinicus in site IV.

 Table 10: List of top 12 species regeneration status in all sites.
Species local name SP % SD %
Diospyros abyssinica (Hiern) F.White 43.8 3.6 606.6 17.5
Antiaris toxicaria Resch 32.8 2.7 438.1 12.7
Pouteria altissima (A.Chev.) Baehni 28.1 2.3 273.1 7.9
Blighia unijugata Bak. 28.4 2.4 220.0 6.4
Celtis zenkeri A.Rich) Wedd 31.3 2.6 189.7 5.5
Croton sylvaticus Krauss 74.7 6.2 184.1 5.3
Lecaniodiscus fraxinifolius Bak. 55.6 4.6 168.4 4.9
Baphia abyssinica Brummit 50.9 4.2 149.1 4.3
Grewia mollis A.Juss. 9.1 0.8 100.9 2.9
Pouteria alnifolia (Bak.) Roberty 8.1 0.7 90.9 2.6
Dracaena afromontana Mildbr. 32.8 2.7 79.7 2.3
Galiniera saxifraga (Hochst.) Bridson 22.5 1.9 45.3 1.3
Total 418.125 34.7 2545.938 73.6
SP � sapling density; SD � seedling density.

including “not regenerate” (4.4%), “poor” (11.1%), “fair” regeneration of trees, saplings, and seedlings and site factors
(62.2%), and “good” (22.2%) in study site IV, (Figure 11). revealed both positive and negative relationships (Table 15).
 Canopy openness and harvesting index showed a negative
 relationship with seedling, sapling, and tree density. The
3.6. Site Factors versus Regeneration Status. In the present Pearson correlation coefficient between canopy openness
analysis, site factors were computed and compared with the with seedling, sapling, and tree density were negative
density of trees, saplings, and seedlings using Pearson (r � −0.02, P � 0.09; r � −0.26, P � 0.08; and r � −0.13,
correlation (r). The correlation result between natural P � 0.0004, respectively). Similarly, the harvesting index
14 International Journal of Forestry Research

 Table 11: Regeneration status of top ten species in site I (Janje–Dope).
Species name Family name TD SP SD RS
Celtis zenkeri A.Rich) Wedd Urticaceae 59.2 36.7 58.3 F
Lecaniodiscus fraxinifolius Bak. Sapindaceae 39.6 27.9 56.7 F
Pouteria altissima (A.Chev.) Baehni Sapotaceae 39.2 25.0 69.6 F
Antiaris toxicaria Resch Moraceae 32.9 13.8 87.1 F
Diospyros abyssinica (Hiern) F.White Ebenaceae 28.8 24.6 68.8 F
Celtis toka (Forssk.) Hepper & Wood Ulmaceae 26.3 7.9 22.1 F
Blighia unijugata Bak. Sapindaceae 23.8 10.4 129.2 F
Fagaropsis angolensis (Engl.) Dale Rutaceae 22.9 0.0 0.0 NR
Morus mesozygia Stapf. Moraceae 20.4 9.2 19.6 F
Vernonia amygdalina Del. Asteraceae 20.4 21.3 23.3 G
Mean ± std. error 313.5 ± 3.8 177 ± 3.5 534.7 ± 12

 1000 150

 Density ha–1
 Density ha–1

 100
 500
 50

 0 0
 Seedling Sapling Tree Seedling Sapling Tree
 Categories Categories
 (a) (b)
 20 40
 Density ha–1
 Density ha–1

 10 20

 0 0
 Seedling Sapling Tree Seedling Sapling Tree
 Categories Categories

 (c) (d)
 6
 Density ha–1

 4

 2

 0
 Seedling Sapling Tree
 Categories
 (e)

Figure 10: (a-e). Seedlings, saplings, and tree/shrub distribution of selected species occurring in each site of MFBR. (a) Cyathea manniana.
(b) Pouteria altissima. (c) Vernonia hochstetteri. (d) Ficus mucuso. (e) Alangium chinense.

 Table 12: Regeneration status of top ten species in site II (Newi–Baya).
Species name Family name TD SP SD RS
Pouteria altissima (A.Chev.) Baehni Sapotaceae 47.9 30.4 137.9 F
Celtis zenkeri A.Rich) Wedd Urticaceae 45.8 28.8 76.7 F
Lecaniodiscus fraxinifolius Bak. Sapindaceae 45.0 66.7 123.3 G
Antiaris toxicaria Resch Moraceae 37.9 21.3 110.0 F
Baphia abyssinica Brummit Fabaceae 37.5 58.8 94.6 G
Pouteria alnifolia (Bak.) Roberty Sapotaceae 27.1 4.6 27.9 F
Grewia mollis A.Juss. Tiliaceae 26.3 4.6 38.3 F
International Journal of Forestry Research 15

 Table 12: Continued.
Species name Family name TD SP SD RS
Lannea welwitschii (Hiern) Engl. Anacardiaceae 24.6 5.8 16.3 F
Ritchiea albersii Gilg Capparidaceae 23.5 0.0 0.0 NR
Ficus sur Forssk Moraceae 23.4 4.6 21.7 F
Mean ± std. error 339 ± 3.1 225.6 ± 7.5 646.7 ± 15.7

 Table 13: Regeneration status of top ten species in site III (Gonchi–Gelesha).
Species name Family name TD SP SD RS
Blighia unijugata Bak. Sapindaceae 41.3 25.8 150.4 F
Celtis zenkeri (A.Rich) Wedd Urticaceae 40.4 10.8 117.9 F
Pouteria altissima (A.Chev.) Baehni Sapotaceae 33.8 7.1 156.7 F
Baphia abyssinica Brummit Fabaceae 27.1 9.2 57.1 F
Antiaris toxicaria Resch Moraceae 22.9 22.5 387.1 G
Pouteria alnifolia (Bak.) Roberty Sapotaceae 22.1 8.8 99.6 F
Ficus ovate Vahl Moraceae 21.3 2.5 6.3 F
Alangium chinense (Lour.) Harms Alangiaceae 20.8 0.0 0.0 NR
Mallotus oppositifolius (Geisel) Mull Euphorbiaceae 20.4 234.2 3.3 F
Cordia africana Lam. Boraginaceae 20.0 0.0 0.0 NR
Mean ± std. error 270 ± 2.6 321 ± 22.6 978 ± 37.7

 Table 14: Regeneration status of top ten species in site IV (Kabo–Gumare).
Species name Family name TD SP SD RS
Cyathea manniana Hook Cyatheaceae 96 298.75 736.25 G
Dracaena afromontana Mildbr. Dracaenaceae 90 131.25 318.75 G
Trilepisium madagascariense DC Moraceae 71 60 165 F
Schefflera abyssinica (Hochst. ex A.Rich.) Harms Araliaceae 68 15 7.5 F
Galiniera saxifraga (Hochst.) Bridson Rubiaceae 65 90 181.25 G
Triumfetta tomentosa Boj. Tiliaceae 45 41.25 82.5 F
Schefflera myriantha (Bak.) Drake Araliaceae 45 0 32.5 F
Pouteria adolfi-friederici (Engl.) Baehni Sapotaceae 45 45 38.75 F
Allophylus abyssinicus (Hochst.) Radlk. Sapindaceae 45 10 60 F
Macaranga capensis (Baill.) Sim Euphorbiaceae 45 17.5 35 F
Mean ± std. error 615 ± 6 708 ± 28 1657 ± 70
Note. TD � tree density, SP � sapling density, SD � seedling density, RS � regeneration status.

 Regeneration status in MFBR significant negative relationship (r � −0.02, P � 0.000001).
 Slope also showed a positive relationship with seedling
 Number of individuals (%)

 70.0
 60.0 (r � 0.03, P � 0.07) and sapling (r � 0.12, P � 0.09) density,
 50.0 whereas tree density showed a negative relationship
 40.0 (r � −0.03, P � 0.94). In addition, canopy openness and
 30.0 harvesting index (r � −0.12, P � 0.07, and r � −0.06, P � 0.09,
 20.0 respectively) showed a negative relationships with herba-
 10.0 ceous cover. The abundance of the herbaceous cover showed
 0.0 a negative relationship (r � −0.03, P � 0.172) with the density
 Site I Site II Site III Site IV
 of seedlings (Table 15).
 Study sites

 No regeneration Fair
 Poor Good 4. Discussion
 Figure 11: Regeneration status of woody species in MFBR.
 4.1. Species Composition. The number of species composi-
 tion in Majang forest biosphere reserves (56 families, 115
showed a negative relationship with seedling, sapling, and genera, and 158 plant species) is higher than other forest
tree density (r � −0.03, Pp � 0.09; r � −0.29, P � 0.1; and sites including Agama forest (35 families, 65 genera, and 72
r � −0.03, P � 0.000016, respectively). plant species) [41], Maji forest (55 families, 115 genera, and
 Elevation showed a significant positive relationship with 146 plant species) [42], Wurg forest (40 families, 64 genera,
sapling and tree density (r � 0.28, P � 0.000001, and r � 0.44, and 76 plant species) [43], and Oda forest (32 families, 54
P � 0.000001, respectively), whereas tree density showed a genera, and 62 plant species) [44] but lower than Gerba-
16 International Journal of Forestry Research

Table 15: Pearson correlation matrix in the density of seedlings, Table 16: Comparisons of tree densities with DBH 10–20 cm (a)
saplings, and tree stems ha−1. and DBH > 20 cm (b) of MFBR with eleven other moist Afro-
 montane forests in southwestern Ethiopia.
Variables SD SP TD HaCa CaOp Hi Slp Elv
SD Density ha−1 Ratio
 Name of forests Source
SP −0.11 (a) % (b) % a/b
TD −0.09∗ 0.26∗ Wurg 516 76.3 160.5 23.7 2.3 [43]
HaCa −0.03 0.12 0.08∗ Agama 556.3 66.4 280.9 33.6 2.0 [41]
CaOp −0.02 −0.26 −0.13∗ −0.12 Gelesha 215 56.9 163 43.1 1.3 [49]
Hi −0.03 −0.29 −0.03∗ −0.06 0.11 Gelesha 315.4 56.3 244.6 43.7 1.3 [53]
Slp 0.03 0.12 0.03∗ −0.01 −0.13 −0.18 Belete 305.1 67.2 149 32.8 2.0 [54]
Elv −0.02∗ 0.28∗ 0.44∗ 0.05∗ 0.15∗ 0.05∗ 0.12∗ Masha 633 68.9 286 31.1 2.2 [48]
∗
 Significant at P < 0.05, SD � seedling density, SD � sapling density, Komto 330 60.6 215 39.4 1.5 [55]
TD � tree density, HaCa � herbaceous cover, CaOp � canopy openness, Menna Angetu 292 67.7 139 32.3 2.1 [56]
Hi � harvesting index, Slp � slope, and Elv � elevation. Harenna 335 64.5 184 35.5 1.8 [57]
 Guraferda 633 55.9 499 44.1 1.3 [58]
 Masha
Dima forest (69 families, 145 genera, and 180 plant species) 387.7 70.7 160.5 29.3 2.4 [59]
 Anderacha
[45], Yayu forest (72 family, 163 genera, and 217 plant Present
species) [4], and Bonga forest (92 families, 207 genera, and Majang 617.5 57.8 450.3 42.2 1.4
 study
285 plant species) [42]. The variation of plant species over
different habitats of the forest could be attributed to a
number of environmental factors, which impose impacts in 4.2.2. Frequency of Woody Species. Frequency indicates the
both temporal and spatial scales [46]. Thus, environmental homogeneity or heterogeneity of a given stand [27, 60], an
heterogeneity, regeneration capacity, moderate distur- occurrence of a species in a given area which indicates how
bance, and competition might shape and determine species species are distributed [27, 61]. In all study sites of MFBR,
richness of the forest. Moreover, from the identified woody the frequency value of woody species ranges from 0.1% to
species, Majang forest biosphere reserves sheltered rela- 99%. The highest frequency was shown by Celtis zenkeri
tively few numbers of endemic plant species to Ethiopia (88%) in study site I, Pouteria altissima (100%) in study site
[47], i.e., Bothriocline schimperi, Clematis longicauda, and II, Celtis zenkeri (95%) in study site III, and Dracaena
Vepris dainellii. afromontana and Cyathea manniana (100%) in study site
 IV (Table 7). These may be due to a wide range of seed
4.2. Vegetation Structure dispersal mechanisms like wind, livestock, wild animals,
 and birds.
4.2.1. Density of Woody Species. The stem densities varied High values in lower frequency classes and low values in
with species composition, diameter size classes, and the higher frequency classes indicate a high degree of floristic
degree of disturbance. Specifically, the stem densities of tree heterogeneity [62]. The frequency distribution of woody
species with DBH > 5 cm in four study sites ranged from species in the MFBR shows that the number of tree species
1232 to 1478 stems ha−1 (Table 5) are lower than those found in the first frequency classes is higher (A and B) and
reported from Wurg forest (1745 ha−1) [43], Masha forest gradually decreases towards higher frequency classes (D
(1681 ha−1) [48], and Gelesha forest (1659 ha−1) [49] in and E), which is similar to that mentioned by Dibaba et al.
southwestern moist Afromontane forest and higher than a [41] in Agama forest, Girma and Melese [43] in Wurg
moist tropical forest (843 stems ha−1) [50]. On the other forest, Edae and Soromessa [49] in Gelesha forest in
hand, the density mentioned in this study is more or less southwestern moist Afromontane, and Dibaba et al. [63] in
comparable with that of Agama forest (1446 ha−1) [41]. The dry Afromontane forest. In contrast, Mekonen et al. [64]
variation of tree densities of MFBR study sites may be due to found that the number of tree species found in the first
variations in elevation, aspect, species composition, age, frequency classes is lower (A and B) and gradually increases
structure [51], and disturbance levels [52]. towards higher frequency classes (D and E) in Woynwuha
 The ratio of tree/shrub density (10 cm < DBH 20 cm) was taken as a measure of the class size dis- be due to uniform species composition or homogeneity in
tribution [56]. Accordingly, the value of the tree/shrub the area.
density ratio was 1.4 in Majang forest biosphere reserves,
which is more or less comparable with Gelesha [53] and
Gurafreda [58]. This similarity may be due to connection 4.2.3. Basal Area. A species with a greater basal area could
with geographical location, climatic condition, and altitude be considered the most important species in a given study
factors. On the other hand, the ratio a/b at MFBR was lower forest [65]. Basal area per hectare used as an indicator of
than that at Wurg, Agama, Jima, Menna Angetu, Belete, degradation level or status of standing stock. If the basal area
Masha, Masha Anderacha, and Komto; it indicates that all is very small, we can conclude that the forest is degrading.
studies have higher proportions of small-sized individuals The total basal area of all woody species in the MFBR was
than the MFBR. This difference may be due to in the stage of about 139.8 m2 with DBH > 5 cm, which is greater than that
secondary succession of the forests (Table 16). of Wurg, Belete, Gelesha, Bibita, and Agama in moist
You can also read