2020-21 Review of High Street Footfall in England - highstreetstaskforce.org
←
→
Page content transcription
If your browser does not render page correctly, please read the page content below

2020-21
     Review of
     High Street Footfall
     in England

highstreetstaskforce.org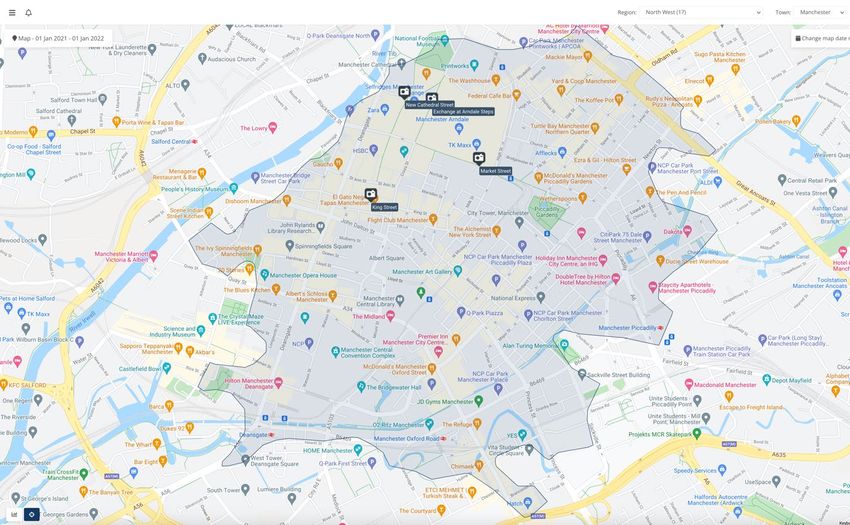
About the High Streets Task Force
The High Streets Task Force is an alliance of placemaking experts. Commissioned in 2019 by the
Ministry of Housing, Communities and Local Government (now Department for Levelling Up,
Housing and Communities), the Task Force provides the encouragement, tools, skills and training
that communities and local government need to transform their high streets.
www.highstreetstaskforce.org.uk

Report authors
Cardiff University
Dr Christine Mumford, School of Computer Science and Informatics.
Manchester Metropolitan University
Dr Maria Lorono-Leturiondo, Institute of Place Management
Dr Nikos Ntounis, Institute of Place Management
Professor Cathy Parker, Institute of Place Management
Dr Regine Sonderland Saga, Institute of Place Management
Case studies
Gianluca Rizzo, Brixton BID and Stratford Original BID
Jennifer Dixon, Newquay Town Team
Shirley Williams, Newquay Town Team
Vaughan Allen, CityCo
Jace Tyrell, New West End Company

                                                                                                  2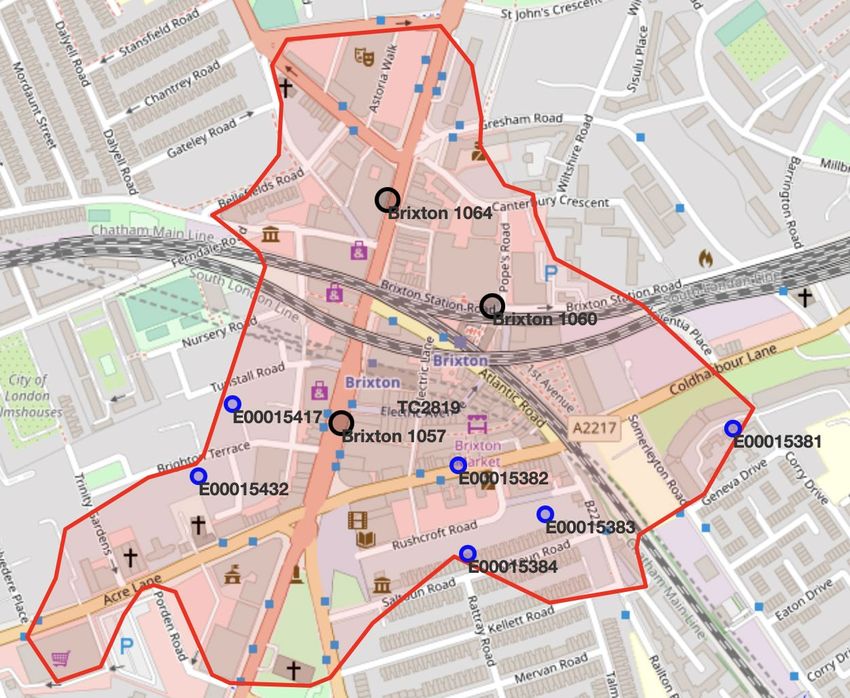
Foreword
                         Professor Cathy Parker
                         Research Lead, High Streets Task Force

Footfall is a simple indicator that tells us a lot     We can say with confidence that small, local
about the nature of high streets, how they are         high streets have recovered quickest, and that
used and how they are changing. It has been            towns with a defined sense of place and role
a key indicator of a town centre’s vitality and        beyond template retail have shown greater
viability since the publication of Planning Policy     resilience. Cities, especially those that attract a
Guidance Note 6 Town Centres and Retail                high number of national or international visitors,
Development in 1993. From footfall data from           are on a longer recovery trajectory. Even before
Springboard, for around 180 high streets, we           the pandemic we were making the case for a
have been able to draw a number of conclusions         diverse, multifunctional and unique offer on
about the annual performance of high streets,          high streets, and now this must be the active
during the second year of Task Force operations        goal for many more towns, particularly those
(from July 2020 to June 2021).                         that are planning the investment of government
                                                       funding. We have observed in this study that a
As noted in last year’s report, footfall was already   high number of archetypal retail towns have
falling - around 4% in five years (2016-2019) –        shifted to new multifunctional and speciality
reflecting a number of structural changes such         models, and its vital that local place makers
as on-line shopping, decline of the multiples, and     understand what type of town they are working
changes in consumer behaviour. Nevertheless,           in, and what type of change in footfall patterns
the slow decline of footfall before COVID seems        they want to encourage.
almost insignificant when compared to the
impact the pandemic has had on the number              It is significant for understanding the evolution
of visitors to England’s high streets. This report     of high streets at a local, regional and national
begins to explore that impact, albeit with the         level that, despite the importance and value
limitation of working with chaotic data that           of the indicator, the majority of high streets
reflects many factors, not least the 12 milestones     across England still do not monitor footfall.
relating to lockdowns and other restrictions           The High Streets Task Force encourages all
noted in our COVID-19 timeline.                        local authorities, community groups and place
                                                       management organisations to engage in footfall
Despite the researchers' constant refrain of           analysis, whether that's through estimated
needing more data, we can draw many useful             data that the Task Force can provide, manual
conclusions from the analysis, which point the         counting, or automatic counting technology.
way to how high streets will need to adapt in          There are some excellent case studies in this
future. Firstly there is the reassuring sign of        report of places doing just that.
the impact of COVID-19 vaccines on the pace
and trajectory of footfall recovery in late 2020.      Whilst reports like these are useful in establishing
As we look into the future, we should not be           general trends, all high streets are different and
complacent about public health and its crucial         so local knowledge and analysis is crucial for
role in ensuring people feel safe in public            local decision making. I look forward to working
spaces.                                                with places across England, in my role with the
                                                       High Streets Task Force, to continue help them
                                                       understand how people are using their high
                                                       streets.
Snapshot

1. Vaccines encourage footfall                     4. Trend shows shift from retail to
recovery as long-term picture                      multifunctional high streets
unclear                                            Between 2016 and 2019, the number of
COVID-19 fundamentally changed high street         Comparison retail towns fell by over 60%.
footfall. To give a sense of the size of this      Of these towns that changed their role
change during 2020, 10 million fewer people        or defining function, 55% shifted to a
visited each of England's regional cities (on      Multifunctional signature, with 45% becoming
average). A stronger footfall rebound in 2021      Speciality. By comparison, the number of
compared with 2020 reflects the impact of          Speciality towns in our sample has grown
the vaccination programme alongside the            from 36 to 53. Breaking this down further, 9
end of restrictions. The Christmas period will     Comparison towns and 11 Multifunctional
be key to establishing if people are returning     towns became Speciality Towns in this period.
to many high streets (those with a strong retail   This may reflect current investment in culture
offer) in the numbers comparable to 2019.          and heritage-led regeneration and how this is
                                                   impacting on the form and function of those
                                                   towns.

2. District centres recover quickly 5. Footfall shifts from night-time
but cities take longer              to day-time economy
44% of towns had recovered their pre-              It's clear that the night-time economy in
pandemic footfall profile in Summer 2020,          our towns and cities has suffered more,
compared to 48% with a reduced footfall            proportionally, than the daytime economy
profile, 5.1% much reduced, and 2.9%               throughout the pandemic. COVID-19 has
exhibiting a summer boost.                         caused a 6% shift in footfall away from the
                                                   night-time economy and towards the daytime
The likelihood of footfall recovery is strongly
                                                   economy. Place leaders and managers may
associated with the size of a settlement.
                                                   have to work hard to encourage some people
100% of district centre high streets
                                                   back to the evening/night-time economy.
recovered footfall volumes in summer 2020,
with the majority of major cities still much
reduced at this time.

3. Reliance on retail slowed
high streets’ recovery
Towns with a varied high street offer and
unique attractions have fared better than
those defined mostly by retail. Over 67% of
‘Speciality’ towns - those which serve their
local population but which also attract tourists
and daytrippers - had recovered footfall over
summer 2020. However, no Comparison retail
towns had achieved a similar recovery during
this period. Holiday towns were the best
performing during this period, with nearly
50% actually beating pre-pandemic footfall
forecasts.
                                                                                                    4
Pandemic timeline

Since the imposition of the first lockdown on 23rd March 2020, England has experienced many
changes to the levels of COVID restrictions, increasing or decreasing them to align with the
government’s latest assessment of risk to the community at large and the NHS in particular.
Table i summarises key dates that are likely to have influenced footfall levels in English towns and
cities. The dates in this table have been sourced from two government publications . However,
we have selected only those dates that we consider to be having a major influence, and many
more dates and details can be found in the above cited publications.
Table i: Key dates of COVID restrictions in England

       Date               Action
       23 Mar             First lockdown begins
       15 Jun             Non-essential shops re-open
       4 Jul              Pubs, restaurants, hairdressers and some leisure facilities re-open with
                          social distancing
       3 Aug              Eat Out to Help Out scheme begins
2020

       14 Aug             Further easing of lockdown: theatres, bowling alleys and soft play open
                          with restrictions
       22 Sept            Return to working at home and 10pm curfew on hospitality
       14 Oct             New three-tier system of restrictions starts
       5 Nov              Second lockdown begins
       2 Dec              Second lockdown ends and England returns to a stricter three-tier system
       6 Jan              Third lockdown begins
       12 Apr             Non-essential shops re-open. Outdoor venues including pubs, restaurants,
2021

                          zoos and theme parks re-open as do some tourist indoor leisure facilities
                          such as gyms.
       17 May             Third lockdown ends and England returns to a stricter three-tier system.

Figure ii: Key dates of COVID restrictions in England and average daily high street footfall

                                                                                                       5
1 - Vaccines encourage footfall recovery
    as long-term picture unclear

High street footfall in England had been          In fact, footfall has recovered at greater speed
steadily dropping before the pandemic, down       since the reopening of non-essential retail on
by just under 4% between 2015 and 2019,           12 April 2021 (+112.9% in the first week) than
and during this time similar month-by-month       after the previous reopening of non-essential
patterns were observed.                           retail on 15 June 2020 (+62.9%). This stronger
                                                  rebound in 2021 is likely to reflect the impact of
COVID-19 fundamentally changed high street        the vaccination programme alongside the end
footfall. The commonly applied forecasting        of restrictions.
methods based on several past years of data
are no longer appropriate. Figure A shows how     There is encouragement too in the upward
footfall from March 2020 to September 2021        trajectory of current average monthly footfall
has consistently tracked below previously         levels, which are tracking slowly towards the
forecast levels, by as much as 90% at times. To   traditional, pre-pandemic forecast for 2021.
give a sense of the size of this change during    The Christmas period will be key to establishing
2020, a typical English regional city will have   if, after COVID-19, people are returning to high
had approximately 10 million fewer people on      streets in the same numbers.
its streets.
However we can observe that, with the
pandemic’s restrictions lifted, there was a       Figure iii (below): Comparison between avg. footfall in
significant bounce-back in the number of          England with a pre-COVID forecast based on 5 years'
people visiting high streets.                     monthly data

                                                                                        To give a sense
                                                                                        of the size of this
                                                                                        change during
                                                                                        2020, a typical
                                                                                        English regional
                                                                                        city will have had
                                                                                        approximately
                                                                                        10 million fewer
                                                                                        people on its
                                                                                        streets.
                                                                                 Figure iv (left): Change in avg. daily footfall for 402
                                                                                 locations in England in the two weeks following the
                                                                                 easing of various COVID restrictions.
                                                                                 15/6/2020 = re-opening of non-essential retail after
                                                                                 lockdown 1; 12/4/2021 = re-opening of non-essential
                                                                                 retail after lockdown 3; 17/5/2021 = re-opening of
                                                                                 hospitality and easing of other COVID measures. The
                                                                                 curves are 7-day rolling averages, and percentage
                                                                                 changes have been computed for the first week
                                                                                 following easing of restrictions

                                                                                                                            6
2 - District centres recover quickly
         but cities take longer

     The effect of COVID-19 on towns, cities and high            Analysing the data further shows that the likelihood
     streets throughout the UK has clearly been profound.        of footfall recovery is strongly associated with the size
     However, it is clear from our investigations that some      of a town, as defined by the High Streets Task Force’s
     places have been hit harder than others.                    activity hierarchy. As we can see, small and local
                                                                 centres recovered faster than larger towns and cities.
     Study of monthly footfall data from 175 English towns       This is most starkly illustrated in 100% of district centre
     and cities in 2020 reveals four regular patterns relating   high streets displaying a recovered footfall signature.
     to the extent of footfall recovery observed during the
     summer months of 2020. These are termed: Recovered,         The period covered by these findings was a brief one
     Reduced, Much Reduced, and Summer Boost                     with relatively few restrictions following the easing
     (significant footfall in August and late September,         of the first COVID lockdown, although three months
     compared to other months). Using this approach, we          before the announcement of the vaccine rollout in
     can see that 44% of towns had recovered in Summer           England. People’s behaviour and mobility in towns and
     2020, compared to 48% with reduced footfall, 5.1%           cities will inevitably change as we move further away
     much reduced, and 2.9% exhibiting a summer boost.           from the height of the pandemic (in terms of mortality
                                                                 rate) however this data is still highly relevant in showing
                                                                 the impacts based on size of town and how this might
                                                                 affect future resilience and transformation strategies.

                                                                                   Figure v (left): How the 2020
                                                                                   classification of town recovery
                                                                                   fit the town activity hierarchy

Figure vi (right):
Annual footfall for UK
towns and cities in 2019
and 2020 (Springboard)
showing means (circles)
and standard deviation
ranges (error bars)
for the town activity
hierarchy

                                                                                                                          7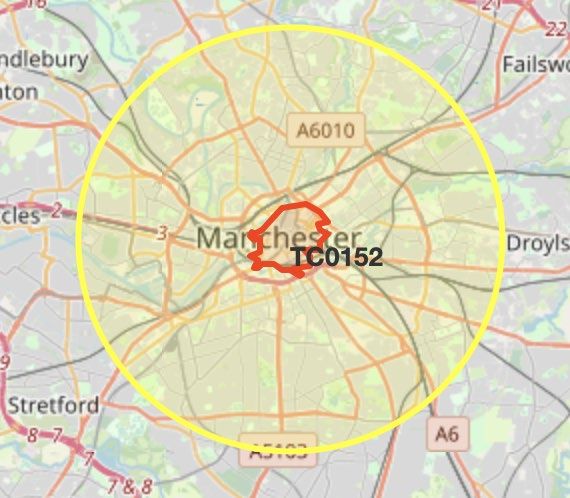
3 - Reliance on retail slowed
    high streets’ recovery

Analysis by the High Streets Task Force shows that towns with a varied
high street offer and unique attractions have fared better than those
defined mostly by retail.
Holiday and Speciality towns recovered at a faster rate than Comparison
                                                                                              “Our analysis
towns during the late summer period of 2020. Speciality towns are                          shows that over
defined as those which serve their local population but which also
attract tourists and as a result are busiest in summer and in December.                  67% of Speciliality
Our analysis shows that over 67% of Speciliality towns had recovered                              towns had
footfall over summer 2020. However, no Comparison retail towns had
achieved a similar recovery during this period. This disparity is perhaps
                                                                                         recovered footfall
not surprising as people went in search of green space or trips out to                        over summer
attractions that could be enjoyed in the open air.
                                                                                            2020. However,
The best performing of the four town types was Holiday town, with
every one recovering their pre-pandemic footfall and 45% of those                           no Comparison
towns actually outperforming 2019 as people explored domestic
locations for their annual break.
                                                                                           retail towns had
                                                                                         achieved a similar
                                                                                           recovery during
                                                                                               this period.”

Figure vii: How the 2020 classification of town recovery fit the identified town types

                                                                                                       8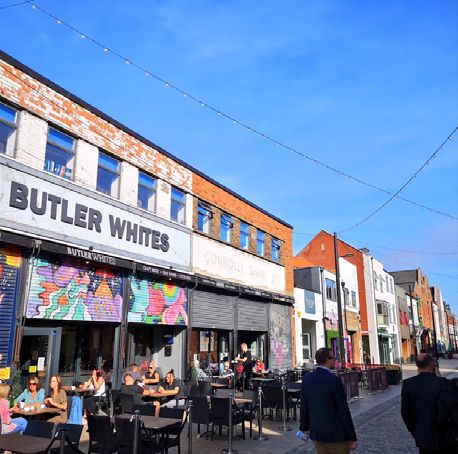
4 - Trend shows shift from retail
    to multifunctional high streets

As we’ve all observed throughout the pandemic, high streets, towns
and cities are constantly changing. This has happened throughout
history and Task Force research shows that today’s towns are changing
what they offer to visitors and residents, which has a corresponding on
their footfall patterns.
We can observe how towns change their footfall patterns by taking the
High Streets Task Force categorisation of towns: Comparison (retail),
Multifunctional, Speciality, and Holiday.
Examining how individual towns change their classification reveals
a rather complex picture, but do show a shift away from Comparison
retail to models that attract visitors more consistently across the week
and year.
Between 2016 and 2019, the number of Comparison retail towns fell by
over 60%. Of these towns that changed their role or defining function,
55% shifted to a Multifunctional signature, with 45% becoming
Speciality.
By comparison, the number of Speciality towns in our sample has
grown from 36 to 53. Breaking this down further, 9 Comparison towns
and 11 Multifunctional towns became Speciality Towns in this period.
This may reflect the current investment in culture and heritage-led
regeneration.
From 2016 to 2019 the number of Multifunctional towns increased from
64 to 65, or an increase of 2%. However, there was a lot of ‘churn’ in this
class.
It is possible that there are two types of Multifunctional towns. The first
type are truly multifunctional and will maintain this signature over time
because they are centres for shopping, employment, culture etc. that
meet their needs of their catchment (large or small). The second type
could be thought of merely ex-Comparison or ex-Speciality Towns.
They have a flat profile just because they are no longer serving those
previous functions, and not because they are successful multifunctional
centres. We will investigate this further when we conduct a review
of annual signatures in 2021 when a full year of undisrupted data is
available.

Table viii: Changes in town type classification for UK towns between 2014-16 and 2017-2019
             2014-2016                                           2017-2019
  Annual signature    No. of towns     Comparison        Holiday         Speciality    Multifunctional
                                         towns           towns            towns            towns

   Comparison              32              12               0                 9              11
      Holiday              12               0               12                1              0
    Speciality             36               0               2                32              2
  Multifunctional          64               1               0                 11             52

                                                                                                         9
5 - Footfall shifts from night-time
    to day-time economy

It's clear that the night-time economy in our towns and cities has
suffered more, proportionally, than the daytime economy throughout
the pandemic. This is because hospitality, and especially nightclubs,
have been closed down longer than non-essential retail (which is
open in the daytime). Many festivals and night-time events that would
normally animate our high streets at night and drive night-time footfall
have also been cancelled.
The graph below shows the spread of footfall through the hours of the
day from 2019-21 (in percentage terms). These are not absolute footfall
volumes, instead the graph shows the allocation of footfall across
the hours of the day, which allows us to compare years more easily.
Defining the daytime economy between 6 am and 6pm, it accounts
for 80.7 %, 83.5 %, and 86.5 % of daily footfall for 2019,2020, and 2021,
respectively. COVID-19 has caused a 6% shift in footfall away from the
night-time economy and towards the daytime economy. Place leaders
and managers may have to work hard to encourage some people back
to the evening/night-time economy.

Figure xi: Average hourly footfall for 415 locations in 168 English towns and cities. Comparing 2019,
2020, and 2021.

                                                                                                        10
1 Table of Contents
2 Introduction .................................................................................................................................................................................12
2.1 How to use this report ........................................................................................................................................................12
2.1.1 Local Authorities .................................................................................................................................. 13
2.1.2 Town councils, BIDs and other place partnerships ............................................................................ 13
2.1.3 Community groups and local business associations ......................................................................... 13
2.1.4 Users of the High Streets Task Force Standard or Advanced Dashboards ......................................... 13
2.2 Method.......................................................................................................................................................................................14
2.2.1 Analysing historical footfall............................................................................................................... 14
2.2.2 Forecasting footfall .......................................................................................................................... 14
2.2.3 Case studies..................................................................................................................................... 14
3 COVID-19 Pandemic and Key Dates ...................................................................................................................................19
4 Overall Footfall Trends in England ................................................................................................................................... 20
4.1 Recent Annual Trends .........................................................................................................................................................21
4.2 Monthly Comparisons ........................................................................................................................................................23
4.3 Daily Comparisons ...............................................................................................................................................................24
4.4 Daytime and Night-time Economies ............................................................................................................................25
5 Classifying High Streets by Activity Patterns and Volumes...................................................................................26
5.1 Annual Signatures ................................................................................................................................................................26
5.1.1 Comparison Towns............................................................................................................................... 28
5.1.2 Holiday Towns .................................................................................................................................. 28
5.1.3 Speciality Towns .............................................................................................................................. 29
5.1.4 Multifunctional Towns ...................................................................................................................... 29
5.2 Weekly Signatures ...............................................................................................................................................................29
5.2.1 Saturday Peak .................................................................................................................................. 30
5.2.2 Monday Through Friday Steady........................................................................................................ 30
5.2.3 Weekly Signatures for 2020.............................................................................................................. 30
5.3 Daily Signatures .....................................................................................................................................................................31
5.3.1 All Day Economy .............................................................................................................................. 32
5.3.2 Midday Economy ............................................................................................................................. 32
5.3.3 Daily Signatures for 2020 ................................................................................................................. 32
5.4 The Activity Hierarchy .......................................................................................................................................................33
6 The Differential Effect of COVID-19 on Various Types and Sizes of English Towns and Cities...............35
6.1 Footfall Patterns for England in 2020 .........................................................................................................................35
6.1.1 Annual Signatures for 2020.................................................................................................................. 35
6.1.2 Recovery across the activity hierarchy ............................................................................................. 38
7. Case-studies ...............................................................................................................................................................................39
7.1 Brixton ...................................................................................................................................................................................... 40
7.2 Newquay ..................................................................................................................................................................................44
7.3 Manchester .............................................................................................................................................................................52
7.4 London New West End ....................................................................................................................................................... 57
Appendix A: Classification of Annual Signatures for English Towns ................................................................................62
112 Introduction
The High Streets Task Force was commissioned by the Ministry of Housing, Communities and
Local Government (now Department for Levelling Up, Housing and Communities) in 2019 to
help place leaders reinvent their high streets. The Task Force was set up before the start of the
COVID pandemic to provide a national programme of data, training and expert advice to a
range of town and city centre stakeholders. However, since COVID-19, the role of the High
Streets Task Force has become even more crucial, and it is now supporting hundreds of local
authorities, businesses and members of the wider community to recover from the impact the
pandemic has had on town centres and high streets.
To support both the recovery and longer-term reinvention of the High Street, the Institute of
Place Management, the lead Partner of the High Streets Task Force, has identified footfall as
the most important indicator through previous research and projects 1. Footfall is very
responsive and can be used to measure the changes on the high street almost in ‘real-time’.
Furthermore, there is a close relationship between footfall and other important indicators such
as spend, property/rental values, and occupancy rates. Footfall can be measured by automatic
footfall counters, such as those provided by Springboard, the consortium partner of the High
Streets Task Force responsible for providing footfall data. In addition, the High Street Task
Force has developed a manual counting programme that many towns are undertaking, some
relying on volunteers to carry out the counts. It is also possible to calibrate WIFI or mobile
phone data with expert help, to give an indication of levels of activity.
This footfall review is predominantly intended to be a reference document, to understand how
England’s high streets are recovering and evolving as a result of COVID-19. It has been written
for place leaders, government, and for the delivery arm of the High Streets Task Force. We
explain how the report might be used in the following section. The rest of Section 2 explains our
methodology.
2.1 How to use this report
This is the second of four annual reports on footfall in England’s high streets that form part of
the information and data provision from the High Street Task Force’s Professional, Research and
Data Group. The first report, published in August 2020, covering July 2019 to Jun 2020 2, is
recommended reading in conjunction with the present document, because it covers more of the
pre-2019 background. Nevertheless, this current review has been written as a ‘stand-alone’
document and summarises all the main points from earlier work required to understand it.
The Task Force is funded by government until June 2024 and offers support to local authorities
and other place-makers and leaders as they seek to transform and redefine their high streets. As
mentioned above, the main purpose of the report is one of reference, to understand how footfall
is changing on England’s high streets; present various town types, based on patterns of annual,
weekly and daily footfall; and last but not least, help to mitigate the effects of COVID-19.
1
https://www.highstreetstaskforce.org.uk/resources/details/?id=9e0db5fe-211f-4eea-9d5b-040605328036
2
https://www.highstreetstaskforce.org.uk/media/b5dnkp4z/hstf-footfall-report-2020-for-publication.pdf
122.1.1 Local Authorities
Councils with planning authority can use the report to compare trends in footfall against the
national trends identified in the report (Section 4), both pre- and post-pandemic. It is important
to identify those places that may not be recovering their previous form and function, which
seems to be the case for many larger centres since the start of the COVID pandemic.
Comparing footfall volumes to the levels in the activity hierarchy presented in Section 5 can
assist planning authorities with future designations (district, town, regional centre, city) based
on activity levels as the country emerges from the pandemic.
In addition, any local authorities that have at least two years of pre-pandemic historical footfall
data for particular locations will be able to identify the town types of those settlements
(comparison, speciality, holiday and multifunctional). This will help them to develop strategies
for recovery and reinvention that are congruent with the underlying function of the town (see
Section 5). Understanding the daily and weekly footfall profile will also ensure initiatives to
encourage more people to use or invest in the town are successful.
2.1.2 Town councils, BIDs and other place partnerships
Town councils, BIDs, town teams and other place partnerships can use the report in a similar
way to local authorities. Whilst these organisations do not have statutory responsibility for
planning, they may be able to provide the local analysis needed to understand how specific
locations are faring, in relation to national footfall trends (Section 4). These organisations are
well placed to bring together local stakeholders to explore the town types (Section 5) and work
up plans and strategies that are congruent with these functions.
2.1.3 Community groups and local business associations
In some towns and neighbourhoods there is no formal partnership, BID or other organisation,
like a town or parish council, that ‘coordinates’ the high street. In these cases, community
groups and/or local business associations, like Chambers of Commerce, can use the report in
the same way as the town councils, BIDs or other place partnerships, to build a better
understanding of the town, to assist the local planning authority with designations or local
plans, and to share the insight around businesses and other key players. Even where place
partnerships exist, community groups and local business associations can be really helpful in
providing additional capacity and expertise in analysing data and presenting and disseminating
results.
2.1.4 Users of the High Streets Task Force Standard or Advanced Dashboards
Over 450 high streets now have a Standard or Advanced Dashboard, provided by the Task
Force, to help understand and analyse footfall in individual locations. Individual users that have
dashboard access and/or who are involved in the manual counting programme can learn more
about broader footfall trends through reading this report.
If you would like to find out more about High Street Task Force Dashboards or the manual
counting programme then please visit the Task Force website
(https://www.highstreetstaskforce.org.uk).
132.2 Method
The data analysis has been undertaken by a team from Cardiff University and the Institute of
Place Management at Manchester Metropolitan University. A full list of authors can be found at
the front of this report.
2.2.1 Analysing historical footfall
The footfall data is obtained from automated counting technology, provided by Springboard 3.
Springboard’s counters record the number of people passing by a given point every hour, and
we accumulate this into yearly, monthly, daily or hourly time series, as required. We also
combine counts from different locations (for example, all the town and city locations in England)
to obtain an overall picture. When comparing footfall from different time periods, for example to
obtain a five-year trend as we do in Section 4, it is important we have exactly the same towns
and counters in the whole data set. For this reason, there are differences in the number of towns
contributing to a particular data set, depending on the time period covered. For the five-year
trend between 2015 and 2019, only counters that have been active for the whole of the period
can be used. As more counters have been added (and a few removed) over the years, data sets
covering only short periods of time and those covering more recent years are likely to include
more locations in more towns and cities. A limitation of this study is that we only have footfall
data for a maximum of around 180 town centres/high streets and 600 individual counter
locations in England. However, this is a dynamic situation, with counters installed in new places
every year, and some counters being removed, which means in practice we usually work with far
fewer than 600 counters to ensure continuity throughout a given time period.
2.2.2 Forecasting footfall
In Section 4, we used sophisticated modelling techniques to forecast what footfall would have
looked like in 2020 without the COVID-19 pandemic. The forecasting technique involved the use
of four model libraries from the R programming language (Auto-ARIMA, ETS, TBATS and NNETAR).
First, we accumulated monthly Springboard footfall data from locations in towns and cities
throughout the country to form a combined time series to represent the whole of England. Next,
we tested each of the four R models in turn to discover which one produced the smallest
modelling error on our time series data. The best performance was observed from the Auto-
ARIMA method, as is illustrated in Figure 4, Section 4.
2.2.3 Case studies
In Section 7 we have selected 4 case-study locations that have been impacted by the
pandemic in different ways. Brixton, Newquay, Manchester and London’s New West End. We
have interviewed place managers in these locations to understand more about the impact of
the COVID and augment the national trends and data we have analysed in this report with the
local knowledge that is needed to really understand specific high streets.
For all of the case-study locations selected we have provided some basic contextual
information. This is contained in:
i) a map of the area showing a centre boundary and also the location of the
Springboard footfall counters.
3
https://www.spring-board.info
14ii) a table showing the retail centre ID corresponding to the centre boundary referred
to above (where relevant), the number of retail units in the boundary, the population
within the boundary, the population within 5 miles of the centre and a population
estimate from the relevant ONS built up area.
We provide an explanation of the methods and sources used for this contextual information
below.
Retail centre boundaries
For Brixton, Newquay and Manchester, the retail centre boundaries, or town centres (TCs) are
the historic TCs from the Consumer Data Research Centre (CDRC) produced from the 2015
Local Data Company (LDC) retail units location datasets, and built using the Graph-DBSCAN
method.4 These were reviewed by local place leaders and managers and were deemed to be
acceptable representations of the centres. These are the boundaries that are contained within
the HSTF Standard and Advanced Dashboards in the location maps. The same boundaries are
also used to identify the number of businesses in the location (for the social media sentiment
analysis provided within the dashboard by Maybe*).
For the New West End however, the CDRC boundary was Central London and much larger than
the area of interest, so we have used the boundary of the Business Improvement District and
contained this within a simple rectangle, to illustrate the boundary and also estimate population
number within and around the area.
Retail centre IDs
As explained above, we have used the historic TCs from the Consumer Data Research Centre
for Brixton, Manchester and Newquay. Each of these boundaries has a unique TC ID and can be
found on the Consumer Data Research Centre website https://data.cdrc.ac.uk/dataset/historic-
retail-centre-boundaries.
Population in retail centre
For Brixton, Manchester and Newquay it was possible to identify CDRC TCs containing all the
Springboard counters. The population was then computed by finding all the ONS small output
area centroids within the appropriate boundary, and then adding together the estimated
populations from the ONS (latest mid 2020) for all these output areas (see example below for
Brixton).
4
Pavlis M., Dolega L. Singleton A. 2017. A Modified DBSCAN Clustering Method to Estimate Retail Center
Extent. http://onlinelibrary.wiley.com/doi/10.1111/gean.12138/pdf
15As explained earlier, London New West End, forms part of a large CDRC TC called
Central London. For this reason, we used a simple rectangle to enclose the Springboard
counters and added together all the ONS mid 2020 population estimates for the OAs
with centroids within the London New West End Rectangle (see over).
16Population in 5-mile radius of centre
This time we constructed a circle of 5-mile radius around the centroid of each TC for Brixton,
Manchester and Newquay, and added together the ONS mid 2020 population estimate for each
OA centroid contained within this circle (see Manchester example in Figure 3). For London New
West End, we selected a counter central to the rectangle, and took our 5-mile radius from this.
17ONS Built Up Areas (2011 Census)
We found population estimates for Brixton, Manchester and Newquay in tables available from
the ONS through NOMIS 5.
Comparing the ONS built up area (BUA) populations with those obtained by our methods, it is
interesting to note that the BUA population for Brixton is close to the value we obtained for the
TC. However, for Manchester and Newquay the BUA populations are close to the populations
we obtained using a 5-mile radius from the TC centroid.
Number of retail units
For Brixton, Newquay and Manchester we used the number of occupied retail units associated
with the CDRC retail centre boundary. This data was from the 2015 Local Data Company (LDC)
retail units location datasets. Retail units refer to any establishment in a retail centre, regardless
of its functionality, and are included in every category in the Use Classes (Class A, B, C, D E, F,
and Sui Generis). Therefore, retail units can be restaurants, shops, museums, banks, churches,
libraries, leaser centres, gyms, health centres, etc.
For London New West End we used the number of businesses in the Business Improvement
District area 6.
5
https://www.nomisweb.co.uk
6
https://www.newwestend.com/
183 COVID-19 Pandemic and Key Dates
Since the imposition of the first lockdown on 23rd March 2020, England has experienced many
changes to the levels of COVID restrictions, increasing or decreasing them to align with the
government’s latest assessment of risk to the community at large and the NHS in particular.
Table 1 summarises key dates that are likely to have influenced footfall levels in English towns
and cities. The dates in this table have been sourced from two government publications 7.
However, we have selected only those dates that we consider to have a major influence, and
many more dates and details can be found in the above cited publications.
Table 1 is intended as a reference throughout the present document.
Table 1: Key Dates for imposing and releasing COVID restrictions in England.
2020
DATE ACTION
23rd March First lockdown begins.
15th June Non-essential shops re-open.
Pubs, restaurants, hairdressers and some tourist leisure facilities re-open
4th July
with social distancing.
3rd August Eat Out to Help Out scheme begins.
Further easing of lockdown: theatres, bowling alleys and soft play open
14th August
with restrictions.
22nd September Return to working at home and 10 pm curfew on hospitality.
14th October New three-tier system starts.
5th November Second lockdown begins.
Second lockdown ends and England returns to a stricter three-tier
2nd December
system.
2021
DATE ACTION
6th January Third lockdown begins.
Non-essential shops re-open. Outdoor venues including pubs,
12 April
th
restaurants, zoos and theme parks re-open as do some tourist indoor
leisure facilities such as gyms.
17th May Third lockdown ends and England returns to a stricter three-tier system.
7
https://www.instituteforgovernment.org.uk/sites/default/files/timeline-lockdown-web.pdf and
https://www.instituteforgovernment.org.uk/charts/uk-government-coronavirus-lockdowns
194 Overall Footfall Trends in England
This section will cover historical trends in English footfall during the five years before COVID-19
hit and show the catastrophic effect that the pandemic has had. Footfall had already been
falling slowly in recent years. Figure 4 shows average monthly footfall for the five years before
COVID, based on 242 counter locations in 98 English towns and cities. The overall drop from
2015 to 2019 was just under 4 %. Although slowly declining in magnitude, a similar month-by-
month pattern can be observed every year during this five-year period, which in normal
circumstances would make it possible to produce relatively good forecasts for the following
year or so. Figure 4 also shows a forecast for 2020 and 2021 based on the previous 5 years,
indicating an additional decline of about 1.4 % of annual footfall on 2015 levels.
Figure 4: Average monthly footfall for 242 locations in 98 English towns and cities for the five years before the
COVID pandemic. The figure includes forecasts for 2020 and 2021 based on pre-pandemic trends.
We know now, however, that the commonly applied forecasting methods based on several past
years of data are no longer appropriate, following the exceptional influence of the COVID
pandemic. This is illustrated in Figure 5, where we compare the forecasted average monthly
footfall between January 2020 and June 2021 against actual recorded average monthly footfall
over the same period. The 242 locations used here are the same as plotted in Figure 4.
Although we have explored short-term forecasting, that takes COVID restrictions into account,
at the present time footfall data is far too chaotic to make reasonable predictions. This
reinforces the importance of high streets collecting their own data and understanding the
nature of their own recovery.
20Figure 5: Comparison between average footfall In England with a pre-COVID forecast based on the previous five
years monthly data.
Last year, our report identified that the impact of the pandemic on footfall was not uniform (for
example smaller places fared better than larger ones) and we suggested some trends may ‘stick’
post-pandemic (for example Saturday no longer being the ‘stand-out’ busiest day of the week
on the high street). Taking a closer look at overall changes in annual, weekly, and daily footfall
trends from the beginning of the pandemic until 30th June 2021, for towns and cities in England
will help us to understand if there is to be a ‘new normal’ and what that might be, in footfall
terms.
4.1 Recent Annual Trends
Figure 6 shows average daily footfall in English towns and cities for 2020 and the first half of
2021, with key dates indicated.
Figure 6: 7-day rolling average footfall for 425 locations in 171 English towns and cities during 2020 and up to the
30th of June 2021, showing key dates.
21Figure 7: 7-day rolling means to compare July – June for the years 2018 – 2019, 2019 – 2020 and 2020 - 2021 from
402 locations in 164 English towns and cities.
Figure 7 compares footfall during the period July to June in three consecutive years: 2018 -
2019, 2019 - 2020 and 2020 – 2021. The plots are 7-day rolling averages. Clearly, the pandemic
has led to a massive decline in footfall – not surprising as the population was told to stay home
for many months. As can be observed from Figure 7, the lowest period for footfall was following
the first lockdown in the Spring of 2020. From the rolling mean values used to plot this graph,
we observe that the level of footfall drops to a mere 14 to 15 % of 2019 values in the same period,
at the end of March 2020.
Whilst the graph clearly shows the reduction in footfall during 2020 and 2021 compared to pre-
pandemic levels, it also shows that, once restrictions are eased/lockdowns end, there is a
footfall recovery, illustrated by the rolling mean line sloping upwards. In our last report we
reflected on recovery after non-essential retail opened on the 15th June 2020. We can compare
this to the recovery after non-essential retail reopened again on the 12th April 2021, along with a
number of other high streets attractions (such as pubs and restaurants, and gyms etc.) and all
restrictions ended on the 17th May 2021. Figure 8 shows that the recovery gradient is much
steeper following the opening of non-essential retail on 12th April 2021 (112.9 % in the first week)
than was the case in 2020 when non-essential retail opened on the 15th June (62.9 % in the first
week). A further very small recovery in 2021 (7.7 % in the first week) can be observed after the
reopening of hospitality and the relaxation of some other restrictions. The stronger recovery in
2021 is likely to reflect the impact of the vaccination programme as well as the ending of
mandatory measures/restrictions.
22Figure 8: Change in average daily footfall for 402 locations in England in the two weeks following the easing of
various COVID restrictions in England. 15/6/2020 = re-opening of non-essential retail after lockdown 1; 12/4/2021 =
re-opening of non-essential retail after lockdown 3; 17/5/2021 = re-opening of hospitality and easing of other COVID
measures. The curves are 7-day rolling averages, and percentage changes have been computed for the first week
following easing of restrictions.
4.2 Monthly Comparisons
We can observe the position month by month in Figure 9 which shows the average monthly
footfall by volume for our sample of English towns and cities for 2019, 2020, and 2021. Again, the
graph clearly shows the devastating effect of the pandemic, but with some recovery in 2020,
from April, when non-essential retail opened again, ending in October when the tier system re-
introduced restrictions across much of the country. A stronger recovery is apparent from April
2021.
We will have to wait at least until 2022 before we can ascertain whether there have been any
long-lasting changes to monthly footfall patterns, as we will need a complete year free of
restrictions to compare with the last pre-pandemic year, 2019.
23Figure 9: Total monthly footfall for 425 locations in 171 English towns and cities. Comparing 2019, 2020 and 2021.
4.3 Daily Comparisons
Figure 10 illustrates the level of footfall over our sample, averaged for each day of the week,
comparing 2019 levels with 2020 and 2021. This time instead of the footfall volumes, we are
comparing the percentage split for each day of the week, so that the total footfall for each year
adds up to 100%. We can observe small changes in these patterns for the three years, although
we have data for only half of 2021.
In Figure 10 we can see how the 2020 lockdown marginally reduced variation in footfall across
days of the week, probably because people were working from home and had more flexibility to
visit shops and town centres during weekdays. In 2021, however, as people are returning to
workplaces, the weekly footfall patterns appear to be similar to that of 2019, with higher footfall
on Saturdays again. This would suggest that, when it comes to visiting the high street, consumer
behaviour is quite entrenched – and there is no evidence here of dramatic long-term changes
in consumer behaviour post-pandemic when it comes to the days of the week people visit their
high streets.
Figure 10: Average daily footfall from 425 locations in 171 English towns and cities. Comparison between 2019, 2020
and 2021.
244.4 Daytime and Night-time Economies
Figure 11 shows the spread of footfall through the hours of the day. Defining the daytime
economy between 6 am and 6 pm, it accounts for 80.7 %, 83.5 %, and 86.5 % of daily footfall for
2019, 2020, and 2021, respectively. Clearly the night-time economy has suffered more,
proportionally, than the daytime economy throughout the pandemic. This is because hospitality,
and especially nightclubs, have been closed for longer than non-essential retail (which is open
in the daytime). Many festivals and night-time events that would normally animate our high
streets at night, driving night-time footfall, have also been cancelled.
As with the daily comparisons, the graph illustrates that there is no evidence of dramatic
changes to consumer behaviour between 2019 and 2021 – the majority (over 80% of people) still
visit their high streets between 6am and 6pm. However, in 2021 there has been a shift of 6% of
evening footfall towards the daytime and place managers may have to work harder to
encourage some people back to the evening/night-time economy. After over a year of COVID
and restrictions, people may have got out of the habit – but also because this sector has
suffered the most severe restrictions, there may not be the same evening/night-time offer in
town centres, if businesses have not managed to survive.
Figure 11: Average hourly footfall for 415 locations in 168 English towns and cities. Comparing 2019, 2020, and 2
255 Classifying High Streets by Activity Patterns and Volumes
This section covers two types of classification; town signatures and the activity hierarchy. First,
we look at town signatures, which are identified by annual, weekly, and daily footfall patterns.
These signatures help us discover how towns are used by their residents and visitors,
throughout the months of the year, days of the week, and hours of the day. The annual, weekly,
and daily footfall signatures are dealt with in separate subsections, each beginning with a brief
description of the methodology and pre-COVID classifications, and then for the weekly and
daily patterns we look at how the situation changed in 2020, the first year of the pandemic.
Regarding the annual footfall signatures and classification for 2020, as we found these
particularly interesting, they have a whole section to themselves (Section 6).
Section 5 concludes with a classification based on annual footfall volumes, which we call an
activity hierarchy. We also examine the stark changes in these volumes between 2019 and
2020.
5.1 Annual Signatures
Based on a K-Means clustering analysis carried out on 10 years of footfall data from
Springboard, up to and including 2016 across 125 UK retail centres, Mumford et al. (2020) 8
discovered four distinct ‘footfall centroids’ representing the centres of four clusters in our
analysis, each town and city in our study being classified according to the centroid that their
annual footfall pattern (or signature) most closely resembled. For this analysis, we computed an
average value for monthly footfall for each town or city individually. Many centres have more
than one counter location, however, and in such cases we took an average over all counters
located within a particular town or city, covering all the full years for which footfall had been
collected for each counter location, omitting any counter that had been operational for less
than two years.
We have since adopted these four patterns, illustrated in Figure 12, as templates for classifying
town types in subsequent years, rather than carry out a repeat the K-Means exercise. In this
way we can discover how places change over the years, in relation to these benchmarks. Table
2 specifies the number of towns and cities identified in each category for footfall collected
between 2017 and 2019 inclusive (left) and 2014 to 2016 inclusive (right), out of a total of 145. As
in our previous work, we required at least two years of data per counter, and ensured that
exactly the same towns and cities were used in each case. However, from 2020 footfall has
been so disrupted by COVID that we are currently unable to classify centres using these
benchmarks. Instead, we have carried out a new clustering study on 2020 data only in Section
6, and used these to help analyse the varying levels of ‘COVID resilience’ in English towns and
cities.
8
Mumford, C., Parker, C., Ntounis, N., & Dargan, E. (2020). Footfall signatures and volumes: Towards a classification of UK centres.
Environment and Planning B: Urban Analytics and City Science. https://doi.org/10.1177/2399808320911412
26Figure 12: Annual Centroids for the UK.
From Table 2 we can observe a marked decrease in comparison towns and a notable increase in
speciality towns during 2017-2019, whilst holiday and multifunction towns remain at roughly the
same level. Indeed, a χ2 contingency test indicates that these differences are significant at the
0.025 probability level. Table 2 also gives the values for the average annual footfall for each
town type recorded over the two time periods at the busiest counter location in each case. We
can see that footfall for all town types decreases between the two time periods, and it is worth
noting that overall footfall between the two periods decreases, with the averages taken for all
towns dropping 7618647 for 2014 – 2016, to 6556921 in 2017 - 2018, some 14 %.
Table 2: Classification of UK towns during the two periods 2014 – 2016 and 2017 – 2019.
2014 – 2016 2017 – 2019
Annual Number % of Average Number of % of Average % Footfall
signature of towns Annual towns towns annual drop for
towns Footfall footfall Town Type
Comparison
32 22.1 % 8785654 13 9.0 % 8350491 5.0 %
Holiday
13 9.0 % 5643049 14 9.7 % 4851774 14.0 %
Speciality
36 24.8 % 8172899 53 36.5 % 7008312 14.2 %
Multifunctional
64 44.1 % 7072635 65 44.8 % 6131867 13.3 %
27Examining the detail of how individual towns change their classification reveals a rather
complex picture, with 11 comparison towns changing to multifunctional, and 9 becoming
speciality. On the other hand, we note that 11 multifunctional towns from 2014 – 2016 become
speciality towns in 2017 – 2019. The full picture can be seen in Table 3.
Table 3: Changes in town type classification for UK towns between the two periods 2014 - 2016 and 2017 - 2019.
2014 - 2016 2017 - 2019
Number Number of Number of Number of Number of
Annual
of towns towns towns towns
signature
towns Comparison Holiday Speciality Multifunctional
Comparison 32 12 0 9 11
Holiday 13 0 12 1 0
Speciality 36 0 2 32 2
Multifunctional 64 1 0 11 52
For these annual signatures, we think it is sensible that locations keep their pre-pandemic
classification until we have a complete year of undisrupted footfall data to work with. The
classification for all individual towns in England, with the necessary data for at least one of the
time periods in Table 2 is included in Appendix A. However, please note that the towns classified
in Appendix A are only those located in England, whereas the towns in the two tables above
cover the whole of the UK. Also, it is possible to classify additional English towns in Appendix A
that only have a partial history of footfall data during the three time periods of interest, leaving
‘gaps’ where data is not available. We are not analysing overall trends in the Appendix, but
simply giving details about individual towns, that may be helpful to their place managers and
leaders.
5.1.1 Comparison Towns
Comparison Towns are the more traditional shopping centres, typically located in larger town
and city centres, which are often also important employment and educational centres. They are
characterised by a footfall peak in November and December, coinciding with the Christmas
shopping period. People visit predominantly to shop and may travel a considerable distance to
do so. These towns have a wide range of retail choice, leisure, food, and beverage, as well as
strong retail anchor(s) and presence of multiples and international brands (e.g., Manchester).
From 2016 to 2019 the number of Comparison Towns in our sample fell from 32 to 13, a reduction
of 60%. 11 former Comparison Towns evolved into Multifunctional Towns. 9 former Comparison
Towns evolved into Speciality Towns.
5.1.2 Holiday Towns
Holiday Towns are visited mainly by tourists for a holiday or a ‘day out’. They do not ordinarily
concentrate on serving the local catchment, instead focusing on providing entertainment and
leisure to visitors. They are busiest in the summer and when the weather is good. People travel a
considerable distance to visit. They are attractive to tourists but have relatively weak shopping
offer (e.g., Blackpool).
28You can also read