2021 Drinking Water Quality Report Covering Data for Calendar Year 2020 Public Water System ID: CO0118040
←
→
Page content transcription
If your browser does not render page correctly, please read the page content below
2021 Drinking Water Quality Report
Covering Data for Calendar Year 2020
Public Water System ID: CO0118040
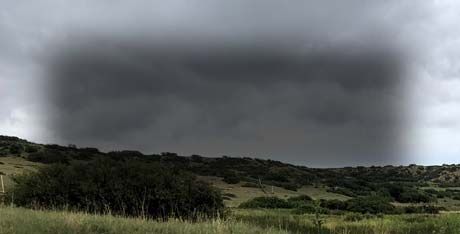
Photo: Newlin Gulch flowing into Rueter‐Hess Reservoir
Esta es información importante. Si no la pueden leer, necesitan que alguien se la traduzca.
We are pleased to present to you this year’s water quality report. Our constant goal is to provide you with a safe
and dependable supply of drinking water. Please contact James Roche at 303‐841‐2058 with any questions or for
public participation opportunities that may affect water quality. Please see the water quality data from our system
included in this report for additional information about your drinking water.
GENERAL INFORMATION
‐
All drinking water, including bottled water, may reasonably be expected to contain at least small amounts of some
contaminants. The presence of contaminants does not necessarily indicate that the water poses a health risk. More
information about contaminants and potential health effects can be obtained by calling the Environmental Protec‐
tion Agency’s Safe Drinking Water Hotline (1‐800‐426‐4791) or by visiting epa.gov/ground‐water‐and‐drinking‐
water.
Some people may be more vulnerable to contaminants in drinking water than the general population. Immunocom‐
promised persons such as persons with cancer undergoing chemotherapy, persons who have undergone organ
transplants, people with HIV‐AIDS or other immune system disorders, some elderly, and infants can be particularly
at risk of infections. These people should seek advice about drinking water from their health care providers. For
more information about contaminants and potential health effects, or to receive a copy of the U.S. Environmental
Protection Agency (EPA) and the U.S. Centers for Disease Control (CDC) guidelines on appropriate means to lessen
the risk of infection by Cryptosporidium and microbiological contaminants call the EPA Safe Drinking Water Hot‐
line at (1‐800‐426‐4791).General Information continued... Lead in Drinking Water
The sources of drinking water (both tap water and If present, elevated levels of lead can cause serious
bottled water) include rivers, lakes, streams, health problems (especially for pregnant women and
ponds, reservoirs, springs, and wells. As water young children). It is possible that lead levels at your
home may be higher than other homes in the communi‐
travels over the surface of the land or through the
ty as a result of materials used in your home’s plumb‐
ground, it dissolves naturally occurring minerals
ing. If you are concerned about lead in your water, you
and, in some cases, radioactive material, and can may wish to have your water tested. When your water
pick up substances resulting from the presence of has been sitting for several hours, you can minimize the
animals or from human activity. Contaminants potential for lead exposure by flushing your tap for 30
that may be present in source water include: seconds to 2 minutes before using water for drinking or
cooking. Additional information on lead in drinking
•Microbial contaminants: viruses and bacteria that water, testing methods, and steps you can take to mini‐
mize exposure is available from the Safe Drinking Wa‐
may come from sewage treatment plants, septic sys‐
ter Hotline (1‐800‐426‐4791) or at epa.gov/safewater/
tems, agricultural livestock operations, and wildlife.
lead.
•Inorganic contaminants: salts and metals, which
can be naturally‐occurring or result from urban storm Source Water Assessment and Protection (SWAP)
water runoff, industrial or domestic wastewater dis‐ The Colorado Department of Public Health and Envi‐
charges, oil and gas production, mining, or farming. ronment may have provided us with a Source Water
Assessment Report for our water supply. For general
•Pesticides and herbicides: may come from a varie‐
information or to obtain a copy of the report please visit
ty of sources, such as agriculture, urban storm
http://www.pwsd.org/DocumentCenter/View/690. The
water runoff, and residential uses.
Source Water Assessment Report provides a screening‐
•Radioactive contaminants: can be naturally occur‐ level evaluation of potential contamination that could
ring or be the result of oil and gas production occur. It does not mean that the contamination has or
and mining activities. will occur. We can use this information to evaluate the
need to improve our current water treatment capabili‐
•Organic chemical contaminants: including syn‐
ties and prepare for future contamination threats. This
thetic and volatile organic chemicals, which are by‐
can help us ensure that quality finished water is deliv‐
products of industrial processes and petroleum pro‐
ered to your homes. In addition, the source water as‐
duction, and also may come from gas stations, urban
sessment results provide a starting point for develop‐
storm water runoff, and septic systems.
ing a source water protection plan. Potential sources of
contamination in our source water area are listed on the
In order to ensure that tap water is safe to drink,
next page.
the Colorado Department of Public Health and
Environment prescribes regulations limiting the Please contact us to learn more about what you can do
amount of certain contaminants in water provided to help protect your drinking water sources, any ques‐
by public water systems. The Food and Drug Ad‐ tions about the Drinking Water Quality Report, to learn
ministration regulations establish limits for con‐ more about our system, or to attend scheduled public
taminants in bottled water that must provide the meetings. We want you, our valued customers, to be
same protection for public health. informed about the services we provide and the quality
water we deliver to you every day.Our Water Sources
Sources (Water Type - Source Type) Potential Source(s) of Contamination
RUETER-HESS RESERVOIR (Surface Water-Intake)
PARKER RIDGE ARAPAHOE (Groundwater-Well)
PARKER RIDGE DAWSON (Groundwater-Well)
RUETER HESS DENVER (Groundwater-Well)
RUETER HESS DAWSON (Groundwater-Well)
CC 15 ALLUVIAL (Groundwater-Well)
CC 17 ALLUVIAL (Groundwater-Well)
HESS I (Groundwater-Well)
HESS II (Groundwater-Well)
PURCHASED FROM WISE CO0103843 (Surface Water-Consecutive Con-
nection)
NEU TOWNE ARAPAHOE (Groundwater-Well)
REATA NORTH ARAPAHOE (Groundwater-Well)
NEU TOWNE DAWSON (Groundwater-Well)
REGENCY ARAPAHOE (Groundwater-Well)
REGIONAL ARAPAHOE (Groundwater-Well)
REGIONAL DENVER (Groundwater-Well)
REGIONAL DAWSON (Groundwater-Well)
REGIONAL LARAMIE FOX HILLS (Groundwater-Well)
SALISBURY ARAPAHOE (Groundwater-Well)
SALISBURY DAWSON (Groundwater-Well)
Aboveground, Underground and Leaking Storage Tank Sites, Other Fa-
CC7 (Groundwater-Well)
cilities, Commercial/Industrial/Transportation, High Intensity Residen-
CC9 (Groundwater-Well)
tial, Low Intensity Residential, Urban Recreational Grasses, Row Crops,
CC13 (Groundwater-Well)
Fallow, Small Grains, Pasture / Hay, Evergreen Forest, Septic Systems,
REUTER HESS ARAPAHOE (Groundwater-Well)
Road Miles
NEWLIN GULCH ARAPAHOE (Groundwater-Well)
CLARKE FARMS ARAPAHOE (Groundwater-Well)
HIDDEN RIVER ARAPAHOE (Groundwater-Well)
CLARK FARMS A2 (Groundwater-Well)
KOA2 CC (Groundwater-Well)
BRADBURY ARAPAHOE (Groundwater-Well)
BRADBURY DAWSON (Groundwater-Well)
BRADBURY LFH (Groundwater-Well)
BRADBURY DENVER (Groundwater-Well)
PARKER NORTH DAWSON (Groundwater-Well)
PARKER NORTH DENVER (Groundwater-Well)
PARKER NORTH ARAPAHOE (Groundwater-Well)
PARKER NORTH LFH (Groundwater-Well)
KOA 1 CC (Groundwater-Well)
STROH RANCH ALLUVIAL (Groundwater-Well)
STROH RANCH DAWSON (Groundwater-Well)
STROH RANCH DENVER (Groundwater-Well)
ROBINSON RANCH ARAPAHOE (Groundwater-Well)
STROH RANCH ARAPAHOE (Groundwater-Well)
ROWLEY DOWNS ARAPAHOE (Groundwater-Well)
RUSTIC DAWSON (Groundwater-Well)
Photo: Rueter‐Hess ReservoirPhoto: Backwash Pond construc on at RHWPF An Explanation of the Water Quality Data Table—The table shows the results of water quality analysis from 2020 routine sam‐ plings. Every regulated contaminant detected, even in minute traces, is listed. The table contains the name of each substance; the highest level allowed by the Safe Drinking Water Act, the ideal goals for public health, the amount detected, the usual source of such contamination, footnotes explaining the findings, and a key to units of measurement. Contaminants that are not detected are not listed. If you are interested in the full list of analytes tested, please contact the Parker Water and Sanitation District’s Laboratory. For more current water quality data visit our Water Quality Map (https://parkerwater.maps.arcgis.com/apps/MapSeries/index.html?appid=0d0c0989659e4358b9587b610d9a5399). Important Terms and Abbreviations Maximum Contaminant Level (MCL) − The highest level of a contaminant allowed in drinking water. Treatment Technique (TT) − A required process intended to reduce the level of a contaminant in drinking water. Health-Based − A violation of either a MCL or TT. Non-Health-Based − A violation that is not a MCL or TT. Action Level (AL) − The concentration of a contaminant which, if exceeded, triggers treatment and other regulatory requirements. Maximum Residual Disinfectant Level (MRDL) − The highest level of a disinfectant allowed in drinking water. There is convincing evidence that addition of a disinfectant is necessary for control of microbial contaminants. Maximum Contaminant Level Goal (MCLG) − The level of a contaminant in drinking water below which there is no known or expected risk to health. MCLGs allow for a margin of safety. Maximum Residual Disinfectant Level Goal (MRDLG) − The level of a drinking water disinfectant, below which there is no known or expected risk to health. MRDLGs do not reflect the benefits of the use of disinfectants to control microbial contaminants. Violation (No Abbreviation) − Failure to meet a Colorado Primary Drinking Water Regulation. Formal Enforcement Action (No Abbreviation) − Escalated action taken by the State (due to the risk to public health, or number or severity of violations) to bring a non- compliant water system back into compliance. Variance and Exemptions (V/E) − Department permission not to meet a MCL or treatment technique under certain conditions. Gross Alpha (No Abbreviation) − Gross alpha particle activity compliance value. It includes radium-226, but excludes radon 222, and uranium. Picocuries per liter (pCi/L) − Measure of the radioactivity in water. Nephelometric Turbidity Unit (NTU) − Measure of the clarity or cloudiness of water. Turbidity in excess of 5 NTU is just noticeable to the typical person. Compliance Value (No Abbreviation) – Single or calculated value used to determine if regulatory contaminant level (e.g. MCL) is met. Examples of calculated values are the 90th Percentile, Running Annual Average (RAA) and Locational Running Annual Average (LRAA). Average (x-bar) − Typical value. Range (R) − Lowest value to the highest value. Sample Size (n) − Number or count of values (i.e. number of water samples collected). Parts per million = Milligrams per liter (ppm = mg/L) − One part per million corresponds to one minute in two years or a single penny in $10,000. Parts per billion = Micrograms per liter (ppb = ug/L) − One part per billion corresponds to one minute in 2,000 years, or a single penny in $10,000,000. Not Applicable (N/A) – Does not apply or not available. Level 1 Assessment – A study of the water system to identify potential problems and determine (if possible) why total coliform bacteria have been found in our water system. Level 2 Assessment – A very detailed study of the water system to identify potential problems and determine (if possible) why an E. coli MCL violation has occurred and/or why total coliform bacteria have been found in our water system on multiple occasions. Gross Alpha, Including RA, Excluding RN & U: This is the gross alpha particle activity compliance value. It includes radium-226, but excludes radon 222 and uranium.
Detected Contaminants
PARKER WSD routinely monitors for contaminants in your drinking water according to Federal and State laws. The
following table(s) show all detections found in the period of January 1 to December 31, 2020 unless otherwise noted.
The State of Colorado requires us to monitor for certain contaminants less than once per year because the concentra-
tions of these contaminants are not expected to vary significantly from year to year, or the system is not considered
vulnerable to this type of contamination. Therefore, some of our data, though representative, may be more than one
year old. Violations and Formal Enforcement Actions, if any, are reported in the next section of this report.

Note: Only detected contaminants sampled within the last 5 year s appear in this r epor t. If no tables appear in
this  section   then    no   contaminants   were    detected     in   the    last    round      of    monitoring.
                                                      Disinfectants Sampled in the Distribution System
                     TT Requirement: At least 95% of samples per per iod (month or quar ter ) must be at least 0.2 ppm OR
                                     If sample size is less than 40 no more than 1 sample is below 0.2 ppm
                                          Typical Sources: Water additive used to contr ol micr obes
   Disinfectant                                                                       Number of Samples      Sample     TT Viola-
                      Time Period                       Results                                                                                 MRDL
      Name                                                                               Below Level           Size       tion
                                         Lowest period percentage of samples
   Chloramine        December, 2020                                                             0               63         No                   4.0 ppm
                                           meeting TT requirement: 100%
                                                    Lead and Copper Sampled in the Distribution System
                                           th                                                         Sample      90th Percen-
  Contaminant                           90 Per-           Sample       Unit of      90th Per-
                    Time Period                                                                        Sites      tile AL Ex-         Typical Sources
     Name                                centile           Size        Measure     centile AL
                                                                                                     Above AL      ceedance
                    09/19/2020 to
     Copper                               0.23               76          ppm             1.3            0              No
                     11/12/2020
                    05/10/2020 to                                                                                                  Corrosion of house-
      Lead                                 3.6               78          ppb             15             0              No
                     05/21/2020                                                                                                     hold plumbing sys-
                    05/10/2020 to                                                                                                 tems; Erosion of natu-
     Copper                               0.26               78          ppm             1.3            0              No
                     05/21/2020                                                                                                         ral deposits
                    09/19/2020 to
      Lead                                      4            76          ppb             15             3              No
                     11/12/2020
                                           Disinfection Byproducts Sampled in the Distribution System
                                                        Range         Sample     Unit of                           MCL Vio-
          Name             Year      Average                                                   MCL      MCLG                          Typical Sources
                                                      Low – High       Size      Measure                            lation
  Total Haloacetic Acids
                           2020        5.95            0 to 10.2        32         ppb         60        N/A           No
         (HAA5)
                                                                                                                                  Byproduct of drinking
  Total Trihalomethanes
                           2020        14.88          2.6 to 30.6       32         ppb         80        N/A           No          water disinfection
         (TTHM)
         Chlorite          2020        0.09            0 to 0.39        36         ppb         1.0          .8         No
                                Summary of Turbidity Sampled at the Entry Point to the Distribution System
 Contaminant        Sample                                                                                                    TT Viola-       Typical
                                                        Level Found                              TT Requirement
    Name             Date                                                                                                       tion          Sources
                  Date/Month:                Highest single measurement:                 Maximum 0.5 NTU for any single
   Turbidity                                                                                                                     No
                      Oct                            0.062 NTU                                      measurement
                                                                                                                                            Soil Runoff
                    Month:           Lowest monthly percentage of samples meet-          In any month, at least 95% of sam-
   Turbidity                                                                                                                     No
                      Dec           ing TT requirement for our technology: 100 %           ples must be less than 0.1 NTU
                                      Radionuclides Sampled at the Entry Point to the Distribution System
   Contaminant                                    Range         Sample      Unit of                MCL       MCL
                       Year      Average                                                MCL                                 Typical Sources
       Name                                    Low – High        Size      Measure                  G      Violation
    Gross Alpha         2019        1.3          1.3 to 1.3       1          pCi/L        15        0         No
                                                                                                                               Erosion of
     Combined
                        2019       2.93        2.93 to 2.93       1          pCi/L         5        0         No             natural deposits
      Radium
    Gross Beta                                                                                                          Decay of natural and man-
                        2019        2.2          2.2 to 2.2       1         pCi/L*        50        0         No
  Particle Activity                                                                                                           made deposits
 *The MCL for Gross Beta Particle Activity is 4 mrem/year. Since there is no simple conversion between mrem/year and pCi/L EPA considers 50 pCi/
 L to be the level of concern for Gross Beta Particle Activity.
Detected Contaminants continued...
Inorganic Contaminants Sampled at the Entry Point to the Distribution System
Contaminant Range Sample Unit of MCL
Year Average MCL MCLG Typical Sources
Name Low – High Size Measure Violation
Erosion of natural deposits; runoff
Arsenic 2020 0.5 0 to 2 8 ppb 10 0 No from orchards; runoff from glass
and electronics production wastes
Discharge of drilling wastes; dis-
Barium 2020 0.11 0.09 to 0.13 8 ppm 2 2 No charge from metal refineries; ero-
sion of natural deposits
Erosion of natural deposits; water
additive which promotes strong
Fluoride 2020 1.06 0.62 to 1.35 8 ppm 4 4 No
teeth; discharge from fertilizer and
aluminum factories
Runoff from fertilizer use; leaching
Nitrate 2020 0.02 0 to 0.23 11 ppm 10 10 No from septic tanks, sewage; erosion
of natural deposits
Discharge from petroleum and met-
Selenium 2019 0.5 0 to 1 2 ppb 50 50 No al refineries; erosion of natural de-
posits; discharge from mines
Synthetic Organic Contaminants Sampled at the Entry Point to the Distribution System
Contaminant Range Sample Unit of MCL
Year Average MCL MCLG Typical Sources
Name Low – High Size Measure Violation
Di(2-ethylhexyl) Discharge from chemical
2020 0.45 0 to 3.8 10 ppb 400 400 No
adipate factories
Secondary Contaminants**
**Secondary standards are non-enforceable guidelines for contaminants that may cause cosmetic effects (such as skin, or tooth discoloration) or aes-
thetic effects (such as taste, odor, or color) in drinking water.
Contaminant Range Sample
Year Average Unit of Measure Secondary Standard
Name Low – High Size
Sodium 2020 44.43 30.8 to 73.1 8 ppm N/A
Total Dissolved
2020 154.4 116.9 to 353 134 mg/L 500 mg/L
Solids
Iron 2020 173.6 0 to 1098.6 117 µg/L 300 µg/L
Alkalinity 2020 109.17 79 to 141 133 mg/L as CaCO3 N/A
Hardness 2020 100 26 to 171 382 mg/L as CaCO3 N/A
pH 2020 8.11 6.19 to 9.91 1090 SU 6.5 to 8.5
Manganese 2020 27.8 0 to 113.1 117 µg/L 50 µg/L
Unregulated Contaminant Monitoring Rule 4 (UCMR4)
EPA has implemented the Unregulated Contaminant Monitoring Rule (UCMR) to collect data for contaminants that are suspected to be present in
drinking water and do not have health-based standards set under the Safe Drinking Water Act. EPA uses the results of UCMR monitoring to learn
about the occurrence of unregulated contaminants in drinking water and to decide whether or not these contaminants will be regulated in the future.
We performed monitoring and reported the analytical results of the monitoring to EPA in accordance with its Unregulated Contaminant Monitoring
Rule (UCMR). Once EPA reviews the submitted results, the results are made available in the EPA’s National Contaminant Occurrence Database
(NCOD) (http://www.epa.gov/dwucmr/national-contaminant-occurrence-database-ncod)
Consumers can review UCMR results by accessing the NCOD. Contaminants that were detected during our UCMR sampling and the corresponding
analytical results are provided below.
Range Sample
Contaminant Name Year Average Unit of Measure Sample Location
Low – High Size
Total Organic Carbon 2018 6723 5880 to 7160 4 ppb Raw Water Site
Bromide 2018 194 191 to 198 4 ppb Raw Water Site
HAA5 2018 4.05 0 to 8.94 32 ppb Distribution System
HAA6Br 2018 6.84 0 to 16.89 32 ppb Distribution System
HAA9 2018 8.78 0 to 19.714 32 ppb Distribution System
Not
Cyanotoxins 2018 Not Detected 8 ppb Surface Water Entry Point
Detected
Manganese 2019 21.68 0.66 to 76.30 18 ppb All Entry Points
1-Butanol 2019 0.16 0 to 2.89 18 ppb All Entry Points
More information about the contaminants that were included in UCMR monitoring can be found at: https://drinktap.org/Water-Info/Whats-in-My-Water/Unregulated-
Contaminant-Monitoring-Rule-UCMR. Learn more about the EPA UCMR at: http://www.epa.gov/dwucmr/learn-about-unregulated-contaminant-monitoring-rule or
contact the Safe Drinking Water Hotline at (800) 426-4791 or http://water.epa.gov/drink/contact.cfm.You can also read