2021 EEI Financial Conference - Calvin Haack November 2021 - BERKSHIRE HATHAWAY INC.
←
→
Page content transcription
If your browser does not render page correctly, please read the page content below

2021 EEI Financial Conference
                November 2021

                Calvin Haack
     Senior Vice President and Chief Financial Officer
Forward-Looking Statements
This presentation contains statements that do not directly or exclusively relate to historical facts. These statements are “forward-looking statements” within the
meaning of Section 27A of the Securities Act of 1933, as amended, and Section 21E of the Securities Exchange Act of 1934, as amended. Forward-looking
statements can typically be identified by the use of forward-looking words, such as “will,” “may,” “could,” “project,” “believe,” “anticipate,” “expect,” “estimate,”
“continue,” “intend,” “potential,” “plan,” “forecast” and similar terms. These statements are based upon Berkshire Hathaway Energy Company (BHE) and its
subsidiaries, PacifiCorp and its subsidiaries, MidAmerican Funding, LLC and its subsidiaries, MidAmerican Energy Company, Nevada Power Company and its
subsidiaries, Sierra Pacific Power Company and its subsidiaries, or Eastern Energy Gas Holdings, LLC and its subsidiaries (collectively, the Registrants), as
applicable, current intentions, assumptions, expectations and beliefs and are subject to risks, uncertainties and other important factors. Many of these factors
are outside the control of each Registrant and could cause actual results to differ materially from those expressed or implied by such forward-looking
statements. These factors include, among others:
        –     general economic, political and business conditions, as well as changes in, and compliance with, laws and regulations, including income tax
              reform, initiatives regarding deregulation and restructuring of the utility industry, and reliability and safety standards, affecting the respective
              Registrant's operations or related industries;
        –     changes in, and compliance with, environmental laws, regulations, decisions and policies that could, among other items, increase operating and
              capital costs, reduce facility output, accelerate facility retirements or delay facility construction or acquisition;
        –     the outcome of regulatory rate reviews and other proceedings conducted by regulatory agencies or other governmental and legal bodies and the
              respective Registrant's ability to recover costs through rates in a timely manner;
        –     changes in economic, industry, competition or weather conditions, as well as demographic trends, new technologies and various conservation,
              energy efficiency and private generation measures and programs, that could affect customer growth and usage, electricity and natural gas supply
              or the respective Registrant's ability to obtain long-term contracts with customers and suppliers;
        –     performance, availability and ongoing operation of the respective Registrant's facilities, including facilities not operated by the Registrants, due to
              the impacts of market conditions, outages and repairs, transmission constraints, weather, including wind, solar and hydroelectric conditions, and
              operating conditions;
        –     the effects of catastrophic and other unforeseen events, which may be caused by factors beyond the control of each respective Registrant or by a
              breakdown or failure of the Registrants' operating assets, including severe storms, floods, fires, earthquakes, explosions, landslides, an
              electromagnetic pulse, mining incidents, litigation, wars, terrorism, pandemics (including potentially in relation to COVID-19), embargoes, and
              cyber security attacks, data security breaches, disruptions, or other malicious acts;
        –     the ability to economically obtain insurance coverage, or any insurance coverage at all, sufficient to cover losses arising from catastrophic events,
              such as wildfires where the Registrants may be found liable for property damages regardless of fault;
        –     a high degree of variance between actual and forecasted load or generation that could impact a Registrant's hedging strategy and the cost of
              balancing its generation resources with its retail load obligations;
        –     changes in prices, availability and demand for wholesale electricity, coal, natural gas, other fuel sources and fuel transportation that could have a
              significant impact on generating capacity and energy costs;
        –     the financial condition, creditworthiness and operational stability of the respective Registrant's significant customers and suppliers;
        –     changes in business strategy or development plans;
        –     availability, terms and deployment of capital, including reductions in demand for investment-grade commercial paper, debt securities and other
              sources of debt financing and volatility in interest rates;
        –     changes in the respective Registrant's credit ratings;                                                                                                  2
Forward-Looking Statements
        –    risks relating to nuclear generation, including unique operational, closure and decommissioning risks;
        –    hydroelectric conditions and the cost, feasibility and eventual outcome of hydroelectric relicensing proceedings;
        –    the impact of certain contracts used to mitigate or manage volume, price and interest rate risk, including increased collateral requirements, and
             changes in commodity prices, interest rates and other conditions that affect the fair value of certain contracts;
        –    the impact of inflation on costs and the ability of the respective Registrants to recover such costs in regulated rates;
        –    fluctuations in foreign currency exchange rates, primarily the British pound and the Canadian dollar;
        –    increases in employee healthcare costs;
        –    the impact of investment performance, certain participant elections such as lump sum distributions and changes in interest rates, legislation,
             healthcare cost trends, mortality, morbidity on pension and other postretirement benefits expense and funding requirements;
        –    changes in the residential real estate brokerage, mortgage and franchising industries and regulations that could affect brokerage, mortgage and
             franchising transactions;
        –    the ability to successfully integrate the portion of the natural gas transmission and storage business acquired from Dominion Energy, Inc. on
             November 1, 2020, and future acquired operations into a Registrant's business;
        –    unanticipated construction delays, changes in costs, receipt of required permits and authorizations, ability to fund capital projects and other factors
             that could affect future facilities and infrastructure additions;
        –    the availability and price of natural gas in applicable geographic regions and demand for natural gas supply;
        –    the impact of new accounting guidance or changes in current accounting estimates and assumptions on the financial results of the respective
             Registrants; and
        –    other business or investment considerations that may be disclosed from time to time in the Registrants' filings with the United States Securities and
             Exchange Commission (SEC) or in other publicly disseminated written documents.

Further details of the potential risks and uncertainties affecting the Registrants are described in the Registrants’ filings with the SEC. Each Registrant
undertakes no obligation to publicly update or revise any forward-looking statements, whether as a result of new information, future events or otherwise. The
foregoing factors should not be construed as exclusive.

This presentation includes certain non-Generally Accepted Accounting Principles (GAAP) financial measures as defined by the SEC’s Regulation G. Refer to
the BHE Appendix in this presentation for a reconciliation of those non-GAAP financial measures to the most directly comparable GAAP measures.

                                                                                                                                                                  3
Berkshire Hathaway Energy

                                                     Vision
To be the best energy company in serving our customers, while delivering sustainable energy solutions

                                                    Culture
                                       Personal responsibility to our customers

                                                    Strategy
Reinvest in our businesses                                                  Invest in internal growth
• Continue to invest in our employees and                                   • Grow our portfolio of low-cost renewable
  operations, maintenance and capital                                         energy solutions
  programs for property, plant and equipment                                • Pursue value-enhancing additions to the
• Position our regulated businesses to meet                                   electric grid and gas pipeline infrastructure
  changing customer expectations and retain                                 • Deploy energy storage, electric vehicle
  customers by providing excellent service and                                infrastructure and innovative technologies
  competitive rates
• Advance the reliability and resilience of our
  systems, including cybersecurity and physical
  security
                                                         Acquire companies
• Deliver sustainable energy solutions by
  reducing our emissions, transitioning to               • Additive to our business
  renewables, pursuing energy storage and
  employing innovative technology
                                     Competitive Advantage
                                             Berkshire Hathaway ownership

                                                                                                                              4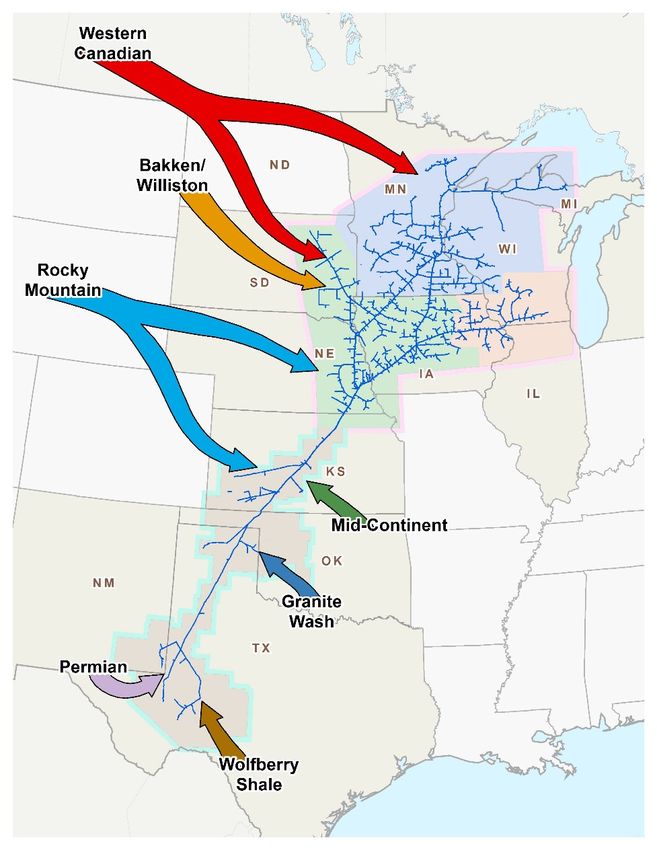
Organizational Structure
2020 Berkshire Hathaway Inc. ($ billions)
Revenue                          $245.5
                                                                                                       Aa2/AA
Net Income(1)                      $42.5
Equity                           $443.2                                                                  91%
2020 Berkshire Hathaway Energy ($ billions)
Revenue                            $21.0
Net Income to BHE shareholders       $6.9                                                               A3/A-
Shareholders’ Equity               $43.0

                                                                                                                                         A/A(2)
      A1/A+ (2)                                                         Aa2/A+ (2)                                                   S&P / DBRS
  Regulated Electric                                                 Regulated Electric                    Baa1/A-                 Alberta Canada
       Utility                        Holding Company                 and Gas Utility                 Holding Company           Regulated Transmission

                         Regulated                   Contracted                        Real Estate                                                                                              A2/A
                          Electric                 Non-utility Power               Brokerage, Mortgage                                            Regulated Natural                       Regulated Natural
                       Transmission                  Generation                      and Franchises                                               Gas Transmission                        Gas Transmission

                          Nevada Power         Sierra Pacific Power                       Northern Powergrid      Northern Powergrid
                                                                                                                                                           Eastern Energy Gas      Modular LNG,
                            Company                  Company                                (Northeast) plc         (Yorkshire) plc
                                                                                                                                                             Holdings, LLC       Other Minor Assets
                             A2/A+(2)               A2/A+(2)                                      A3/A                    A3/A                                   Baa1/A
                         Regulated Electric     Regulated Electric                          U.K. Regulated          U.K. Regulated
                              Utility            and Gas Utility                          Electric Distribution   Electric Distribution

(1) Warren Buffett’s 2020 Berkshire Hathaway Shareholder Letter states – “The four components of that figure are
                                                                                                                                             EGTS (A3/A), Carolina
    $21.9 billion of operating earnings, $4.9 billion of realized capital gains, a $26.7 billion gain from an increase                        Gas, Iroquois (50%        Cove Point LNG
    in the amount of net unrealized capital gains that exist in the stocks we hold, and finally, an $11 billion loss from a                   interest, A3/BBB+)
                                                                                                                                                                         25% Interest
    write-down in the value of a few subsidiary and affiliate businesses that we own.”                                                        Regulated Natural
(2) Ratings for PacifiCorp, MidAmerican Energy Company, Nevada Power Company, Sierra Pacific Power Company                                    Gas Transmission
    and AltaLink L.P. are senior secured ratings                                                                                                                                                         5
Diversity in Our Portfolio

Berkshire Hathaway Energy’s regulated energy businesses serve customers and
end-users across 28 U.S. states, and in Great Britain and Canada

                 Our integrated utilities serve approximately 5.2 million U.S. customers;
ELECTRIC
                 Northern Powergrid has 3.9 million end-users in northern England, making it
DISTRIBUTION
                 the third-largest distribution company in Great Britain
                 We own significant transmission infrastructure in 15 states and the province
ELECTRIC
                 of Alberta; with our assets at PacifiCorp, NV Energy and AltaLink, we are the
TRANSMISSION
                 largest transmission owner in the Western Interconnection
                 BHE Pipeline Group serves customers and end-users in 23 states and
PIPELINES        transported approximately 15% of the total natural gas consumed in the U.S.
                 during 2020
                 As of September 30, 2021, we owned 34,272 MWs of power capacity in
GENERATION       operation and under construction, with resource diversity and a growing
                 renewable portfolio
                 As of September 30, 2021, we have invested $35.5 billion in wind, solar,
RENEWABLES       geothermal and biomass generation, and have plans to spend an additional
                 $4.9 billion on renewable generation by 2023

                                                                                            6
Energy Assets

                    As of and for the LTM ended
                               9/30/2021

                  Assets                     $132 billion

                  Revenues                  $24.7 billion

                  Customers(1)                9.1 million

                  Employees                       23,700

                  Transmission Line               36,000
                  Miles

                  Natural Gas Pipeline            21,300
                  Miles

                  Power Capacity 34,272 MWs(2)
                  Renewables             43%
                  Natural Gas            32%
                  Coal                   24%
                  Nuclear and Other       1%

                (1) Includes both electric and natural gas
                    customers and end-users worldwide.
                    Additionally, AltaLink serves
                    approximately 85% of the population in
                    Alberta, Canada
                (2) Net MWs owned in operation and under
                    construction as of September 30, 2021

                                                         7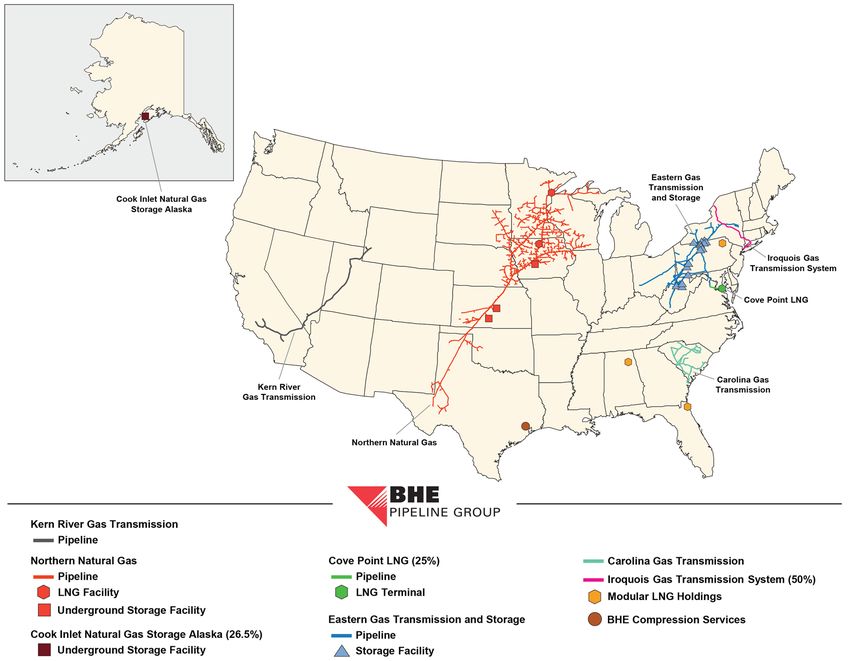
Competitive Advantage
• Diversified portfolio of regulated assets
   – Weather, customer, regulatory, generation, economic and catastrophic risk
     diversification
• Berkshire Hathaway ownership
   – Access to capital from Berkshire Hathaway allows us to take advantage of
     market opportunities
   – Berkshire Hathaway is a long-term holder of assets which promotes stability and
     helps make Berkshire Hathaway Energy the buyer of choice in many
     circumstances
   – Tax appetite of Berkshire Hathaway has allowed us to receive significant cash tax
     benefits from our parent, including $1.3 billion in the nine months ended
     September 30, 2021, and $1.5 billion in 2020
• No dividend requirement
   – Cash flow is retained within the business and used to help fund growth and
     strengthen our balance sheet
   – We retain more dollars of earnings than any other U.S. electric utility

                                                                                    8
Capital Expenditures and Cash Flows
•              Berkshire Hathaway Energy and its subsidiaries will spend approximately $24.4 billion(1) from
               2021 – 2023 for growth and operating capital expenditures, which primarily consist of new wind generation
               project expansions, repowering of existing wind facilities, and electric transmission and distribution capital
               expenditures
                   $11,000

                   $10,000

                    $9,000

                    $8,000

                    $7,000
    ($ millions)

                    $6,000

                    $5,000
                                                                                          Free Cash Flow
                    $4,000

                    $3,000

                    $2,000

                    $1,000

                        $-
                             2016A           2017A             2018A          2019A             2020A             2021F               2022F        2023F

                               BHE Cash Flow from Operations             BHE Total Capital Expenditures              BHE Operating Capital Expenditures

                                     2021 – 2023: $3.3 Billion Free                 +            2021 – 2023: $16.0 Billion Free
                                     Cash Flow above Total Capex                                 Cash Flow above Operating Capex

(1) Cash from operations and capital expenditures includes 100% of Cove Point LNG, which is consolidated, but only 25% owned by BHE
                                                                                                                                                           9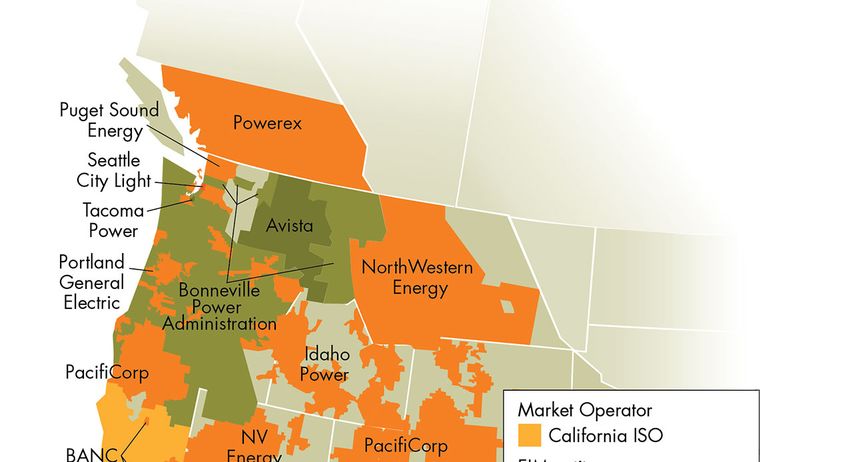
U.S. Regulatory Overview
Adjustment Mechanisms
Capital Energy
Fuel Recovery Renewable Transmission Forward
Recovery Efficiency Decoupling
Mechanism Rider Rider Test Year
Mechanism Rider
PacifiCorp
Utah (1)
Wyoming (1)
Idaho
Oregon
Washington
California
MidAmerican Energy
Iowa – Electric
Illinois – Electric
South Dakota – Electric
Iowa – Gas
Illinois – Gas
South Dakota – Gas
NV Energy
Nevada Power
Sierra Pacific Power – Electric
Sierra Pacific Power – Gas
(1) PacifiCorp has relied on both historical test periods with known and measurable adjustments, as well as forecast test periods 10Revenue and Net Income Diversification
• Diversified revenue sources reduce regulatory concentrations
• For the 12 months ended September 30, 2021, approximately 80% of adjusted earnings was from
investment-grade regulated subsidiaries. A significant portion of the remaining non-regulated adjusted
net income is from contracted generation assets at BHE Renewables
BHE LTM 9/30/2021 BHE LTM 9/30/2021
Energy Revenue(1): $18 Billion Adj. Earnings to Common(2): $3.8 Billion
Other HomeServices
8% Iowa 10% PacifiCorp
Alberta 16% 19%
4%
BHE
Great Britain Renewables
6% 11%
BHE
FERC Nevada Transmission
13% 16% 6%
MidAmerican
Idaho Funding
2% 20%
Washington
2%
Illinois BHE Pipeline
3% Group
California Utah 19%
4% 14% Northern
Wyoming NV Energy
Oregon Powergrid 11%
5% 7% 4%
(1) Excludes HomeServices and equity income, which add further diversification. Revenue percentages include 100% of Cove Point LNG, which is
consolidated, but only 25% owned by BHE
(2) Percentages exclude Corporate/Other
11Earnings on Common Shares
($ millions) LTM Years Ended
Earnings on common shares 9/30/2021 12/31/2020 12/31/2019
PacifiCorp 840 $ 741 $ 773
MidAmerican Funding 851 818 781
NV Energy 459 410 365
Northern Powergrid 191 201 256
BHE Pipeline Group 834 528 422
BHE Transmission 242 231 229
BHE Renewables 486 521 431
HomeServices 450 375 160
BHE and Other (537) (378) (240)
(1)
Adjusted Earnings on common shares 3,816 3,447 3,177
Unrealized Gain/(Loss) on BYD, net of Income Taxes 2,579 3,470 (227)
Earnings on common shares $ 6,395 $ 6,917 $ 2,950
(1) See appendix for a detailed reconciliation of earnings on common shares adjustments
12Berkshire Hathaway Energy
Financial Summary
• Since being acquired by Berkshire Hathaway in March 2000, Berkshire Hathaway Energy
has realized significant growth in its assets, equity, net income and cash flows
Property, Plant and Equipment (Net) BHE Shareholders’ Equity
$ billions $ billions
$86.1 $88.1
$90 $50 $43.0 $45.7
$73.3
$75 $68.1 $40
$60 $29.6 $32.4
$30
$45
$30 $20
$15 $6.5 $10
$1.7
$0 $0
2001 2018 2019 2020 9/30/21 2001 2018 2019 2020 9/30/21
Adj. Earnings to Common(1) Cash Flows From Operations(2)
$ billions $ billions
$4.0 $3.8 $7.5 $6.8 $6.6
$3.2 $3.4 $6.2 $6.2
$3.0 $2.8 $6.0
$4.5
$2.0
$3.0
$1.0 $0.8
$0.1 $1.5
$0.0 $0.0
2001 2018 2019 2020 LTM 2001 2018 2019 2020 LTM
9/30/21 9/30/21
(1) See appendix for a detailed reconciliation of earnings on common shares adjustments
(2) Includes 100% of Cove Point LNG, which is consolidated, but only 25% owned by BHE
13Power Diversification
• As of September 30, 2021, Berkshire Hathaway Energy owns 34,272 MWs of power capacity in
operation and under construction
– 29,414 MWs of power capacity is owned by the regulated electric utility businesses
– 4,858 MWs of power capacity is owned by its nonregulated subsidiaries, the majority of which provides
power to utilities under long-term contracts
– As of September 30, 2021, approximately 44% of owned generation capacity (operating and under
construction) comes from non-carbon resources
Coal
Geothermal
24%
1%
Natural Gas
Hydro
32%
4%
Solar
5%
Wind
33%
Nuclear and
Other
1%
14Transforming Our Generation Portfolio
• Berkshire Hathaway Energy’s energy mix has changed significantly since 2005
• Pro forma for the acquisitions of PacifiCorp (acquired in 2006) and NV Energy (acquired in 2013), renewable
generation has increased from 10% of total generation in 2005 to 32% of total generation in 2020
2005 BHE Power Generation 2020 BHE Power Generation
Owned and Purchased – 102 TWh(1) Owned and Purchased – 119 TWh(1)
Geothermal Coal
Geothermal
4% 33%
Total 3% Coal Hydro
Hydro
Renewables 6% 71% 4%
Wind Solar
10%
1% 4%
Nuclear Total
and Other Renewables
5% 32%
Wind
20%
Natural Gas
14% Natural
Nuclear and Other Gas
3% 32%
• Berkshire Hathaway Energy will continue to increase our investment in renewable energy through the addition
of new owned and purchased wind and solar projects at our regulated U.S. electric utilities
• Existing plans are expected to achieve a 50% reduction in CO2 emissions by 2030 from 2005 levels
• We are striving to achieve net zero greenhouse gas emissions in a manner our customers can afford,
our regulators will allow and technology advances support
(1) Excludes generation associated with renewable energy credits which were not retained
15Low-Cost Competitive Electric Rates
Company Weighted Average Retail Rate ($/kWh)
U.S. National Average(1) $0.1079
Pacific Power $0.0917 15% lower than the U.S. National Average
Rocky Mountain Power $0.0791 27% lower than the U.S. National Average
MidAmerican Energy $0.0720 33% lower than the U.S. National Average
Nevada Power $0.0933 14% lower than the U.S. National Average
Sierra Pacific $0.0736 32% lower than the U.S. National Average
Highest Average Rates ($/kWh) by State(1): Hawaii – $0.2758; Massachusetts – $0.2090;
Connecticut – $0.2049; Rhode Island – $0.2014; California – $0.1689
(1) Source: Edison Electric Institute (Winter 2021) Total Retail
16Strong Credit Profile
Credit ratios continue to support our credit ratings
Credit Metrics
FFO Interest Coverage FFO / Debt Debt / Total Capitalization
LTM LTM LTM
(1)
Credit Ratings Average 9/30/21 2020 2019 Average 9/30/21 2020 2019 9/30/21 2020 2019
Berkshire Hathaway Energy(2) A3 / A- 4.6x 4.8x 4.5x 4.5x 15.4% 15.5% 15.0% 15.8% 51% 53% 57%
Regulated U.S. Utilities
PacifiCorp(2) (3) A1 / A+ 4.7x 4.9x 4.5x 4.7x 18.1% 18.0% 17.2% 19.1% 48% 49% 48%
MidAmerican Energy(2) (3) Aa2 / A+ 6.6x 7.0x 6.3x 6.5x 22.4% 23.8% 22.1% 21.3% 47% 47% 50%
Nevada Power(2) (3) A2 / A+ 4.7x 4.8x 4.7x 4.5x 24.5% 23.6% 24.0% 25.8% 44% 46% 46%
Sierra Pacific Power(2) (3) A2 / A+ 5.6x 5.5x 5.0x 6.4x 20.2% 19.3% 18.6% 22.8% 46% 46% 46%
Regulated Pipelines and Electric T&D
Northern Natural Gas A2 / A 9.0x 9.2x 9.0x 8.9x 36.7% 40.3% 37.0% 32.8% 36% 35% 38%
AltaLink, L.P.(3) –/A/A 3.4x 4.2x 4.0x 2.7x 11.2% 12.2% 11.9% 10.6% 58% 60% 60%
Northern Powergrid Holdings (4) Baa1 / A- 5.3x 5.9x 5.2x 4.7x 17.9% 19.3% 17.9% 16.6% 42% 43% 44%
Northern Powergrid (Northeast) A3 / A
Northern Powergrid (Yorkshire) A3 / A
Eastern Energy Gas Holdings (5) Baa1 / A
Eastern Gas Transmission & Storage(5) A3 / A
(1) Moody’s/S&P/DBRS. Ratings are issuer or senior unsecured ratings unless otherwise noted
(2) Refer to the appendix for the calculations of key ratios
(3) Ratings are senior secured ratings
(4) Credit ratios are based on U.S. GAAP financial reporting
(5) Historical credit metrics are not meaningful due to acquisition and reorganization in November 2020
17Capital Investment Plan
$10,500 $10,012
$9,000 Capex Current Plan Prior Plan
$7,539 $7,475 by Type 2021-2023 2021-2023 Variance
$7,500 $6,843 $6,984 $6,830
($ millions)
Electric Distribution $ 5,034 $ 4,848 $ 186
$6,000
$4,500 Electric Transmission 4,960 4,423 537
$3,000 Wind Generation 4,591 3,082 1,509
$1,500 Natural Gas T&S 2,873 2,707 166
$- Solar Generation 1,294 1,627 (333)
2021 2021 2022 2022 2023 2023 Other 5,642 4,602 1,040
Current Prior Current Prior Current Prior
Electric Distribution Electric Transmission Total $ 24,394 $ 21,289 $ 3,105
Wind Generation Natural Gas Transmission and Storage
Solar Generation Other
Capex Current Plan Prior Plan
$10,500 $10,012 by Business 2021-2023 2021-2023 Variance
$9,000 PacifiCorp $ 6,919 $ 6,264 $ 655
$7,539 $7,475 MidAmerican Funding 6,419 6,061 358
$7,500 $6,843 $6,984 $6,830
NV Energy 4,326 2,723 1,603
($ millions)
$6,000
Northern Powergrid 2,078 1,931 147
$4,500
BHE Pipeline Group 3,247 2,883 364
$3,000 BHE Renewables 372 269 103
$1,500 BHE Transmission 808 844 (36)
$- HomeServices and
225 314 (89)
2021 2021 2022 2022 2023 2023 Other
Current Prior Current Prior Current Prior Total $ 24,394 $ 21,289 $ 3,105
PacifiCorp MidAmerican Funding NV Energy
Northern Powergrid BHE Pipeline Group BHE Renewables
BHE Transmission HomeServices and Other 18Western Electric Transmission $18 Billion
Commitment to Support Renewables
Existing Lines • BHE has committed to invest $18 billion
(of which approximately $5 billion has
Future Lines Lethbridge
been invested as of September 30, 2021)
developing a more interconnected electric
Great Falls transmission grid in the western U.S. and
Swift Canada, thereby providing a conduit for
Troutdale Boardman increased renewable energy to be
John Day Corral/
delivered
Ponderosa
Pilot Butte
Hemingway • PacifiCorp plans to invest more than
$8 billion on major transmission projects
Borah
Populus Shirley Basin Windstar (primarily located in Wyoming, Utah, Idaho
Cedar Hill
Aeolus
and Oregon) including Gateway West,
Ben Lomond Bridger/
Round Anticline Gateway South and Boardman-
Mountain Terminal
Oquirrh
Hemingway, of which $2.3 billion has been
Comstock
Meadows Robinson Summit placed in-service
Mira Loma Mona/Clover
Ft. Churchill • NV Energy’s Greenlink Nevada projects
Sigurd include a 350-mile, 525-kV transmission
Red Butte line (Greenlink West) and a 235-mile,
Northwest Harry Allen 525-kV transmission line (Greenlink
Eldorado
North), with a combined expected cost of
(Cal ISO)
approximately $2.5 billion
19Positioning Our Business to Create a Sustainable Energy Future
We Put Our Energy Into a
                        Sustainable Future
       Enhancing the culture of sustainability within each core principle

  Environmental                    Social                  Governance

  Delivering Cleaner           Working Smarter             Increasing Value
• Expanding clean           • Targeting zero            • Keeping costs stable
  energy                      incidents/accidents         and affordable
• Striving for net zero     • Building a diverse,         through disciplined
  greenhouse gas              equitable and               management
  emissions                   inclusive workforce       • Enhancing reliability
• Optimizing                • Supporting and              and resiliency
  transmission                engaging                  • Implementing process
• Advancing clean             communities                 efficiencies and data
  transportation                                          analytics

                                                                                  21
Advancing a Sustainable Energy Future
Net Zero Greenhouse Gas Emissions Coal Unit Retirements
We are striving to achieve net zero greenhouse gas 2006-2020 2021-2030 2031-2049
emissions in a manner our customers can afford, our PacifiCorp 4 14 8
regulators will allow and technology advances support MidAmerican 5 0 6
NV Energy 7 2 0
We are making reductions now, delivering on
Total 16 16 14
commitments to increase non-carbon generation and
investing in transmission infrastructure
All coal units will be retired before 2050
Existing plans are expected to achieve a 50%
reduction in CO2 emissions by 2030 from 2005 levels Investing in Renewable Energy
Through September 30, 2021, Berkshire Hathaway
Leading in Renewable Generation Energy has spent $35.5 billion on renewable energy,
and have plans to spend an additional $4.9 billion on
The American Clean Power 2020 annual report lists renewable generation by 2023
Berkshire Hathaway Energy as the largest investor-
owned utility of regulated operating wind and solar Transparent Reporting
power
Annual environmental and climate-related disclosures
As of September 30, 2021, approximately 44% of are made in investor presentations and publicly
owned generation capacity (operating and under available
construction) comes from non-carbon resources; this
is forecast to grow to approximately 50% by 2030 Additional information can be found at
www.brkenergy.com/about-us/sustainability
22All Coal-Fueled Plants Retired before 2050
• Of the thirty remaining coal units (as of September 30, 2021), all will be removed from service before 2050, including twenty-
two units at PacifiCorp by 2042, the last two coal units at NV Energy by 2025, and six MidAmerican coal units before 2050
PacifiCorp MidAmerican Energy NV Energy
Conversion Conversion Conversion
Year Plant MWs to Gas Plant MWs to Gas Plant MWs to Gas
2013(1) 6,081 3,345 1,073
2014 Riverside 3 (4) Reid Gardner 1-3 (300)
(2)
2015 Carbon 1 & 2 (172) Riverside 5 (124)
Walter Scott 1 & 2 (124)
2016 Neal 1 & 2 (390)
2017 Reid Gardner 4 (257)
2019 Naughton 3 (280) Navajo (255)
2020 Cholla 4 (395)
12/31/2020 5,234 2,703 261
2023 Jim Bridger 1 & 2 (713)
2025 Craig 1 (82) MidAmerican has reduced Valmy 1 & 2 (261)
Naughton 1 & 2 (357) its coal capacity to 23% of
Colstrip 3 & 4 (148) total power capacity and
12/31/2025 3,934 plans to retire all coal units -
2027 Dave Johnston 1-4 (745) before 2050
Hayden 2 (33)
2028 Hayden 1 (44)
Craig 2 (79)
2036 Huntington 1 & 2 (909)
2037 Jim Bridger 3 & 4 (700)
2039 Wyodak (266)
2042 Hunter 1-3 (1,158)
12/31/2042 -
(1) Adjusted for re-rating of coal plants between December 31, 2013, and December 31, 2020, including plants still in operation and retired
(2) After conversion to a natural gas operating facility in 2015, Riverside 5 was retired in January 2021 23Industry Leader
in Regulated Renewable Energy
Source: America Clean Power Annual 2020 report 24Supporting a Cleaner Energy Future
$40.4 Billion Renewable Investments
($ billions)
$40.4
$35.5 $6.2
$6.2 $1.1
$1.1
$7.9
$6.7 Remaining capital to be deployed
• $3.7 billion – Wind development and repowering
• $1.2 billion – Solar development
Wind Solar Geothermal and Other Wind Tax Equity
$25.2
$21.5
Q3 2021A 2023E
25Sustainability
PacifiCorp
• PacifiCorp’s generation portfolio transformation plan reflected in the 2021 IRP indicates a significant reduction in coal generation
and the addition of renewables, advanced nuclear and battery storage. Highlights of the plan include:
– 1,800 MWs of new wind generation by 2025, and a total of more than 3,700 MWs of new wind generation by 2040
– Over 2,100 MWs of new solar by 2025, and more than 6,400 MWs of new solar by 2040
– Nearly 700 MWs of storage by 2025, and more than 6,600 MWs of storage by 2040
– 500 MW NatriumTM advanced nuclear demonstration project in 2028 and 1,000 MWs from two additional advanced
nuclear resources in 2038
• In July 2021, PacifiCorp issued its first green bond ($1 billion) to support the completion of certain wind generation projects
PacifiCorp 2021 IRP – Forecast Generation as a Percent of Demand(1)
100%
3.9% 0.9% 9.8% 11.3%
9.5% 16.0% 18.8% 21.6%
80% 7.8%
24.1%
41.2%
5.5%
60% 49.3%
11.6% 56.8%
56.2%
3.8%
40% 78.0%
14.7%
3.9%
3.5%
49.0% 3.5%
20% 12.2%
3.1% 8.0%
28.9% 3.0%
11.2%
15.0%
10.3% 0.9%
6.4%
0%
2005 2021 2025 2030 2035 2040
Coal Natural Gas Hydro Nuclear Renewables (excl. Hydro) Other (2)
(1) Forecast system load, pre-demand side management and net of sales
(2) Includes storage, demand response, energy efficiency, existing purchases and front-office transactions 26Sustainability
PacifiCorp
• PacifiCorp expects to reduce carbon emissions by 74% from 2005 levels by 2030, 92% by 2040,
and nearly 100% by 2050
• Per PacifiCorp’s 2021 IRP, all coal plants will be retired or converted to natural gas by 2042
PacifiCorp CO2 Emissions Trajectory
60 1
50
0.8
Million Tons (CO2e)
% of 2005 Base
40
0.6
30
0.4
20
0.2
10
0 0
2011 2014 2017 2020 2023 2026 2029 2032 2035 2038 2041 2044 2047 2050
PacifiCorp Emissions (Million ST) 2005 Base Emission % Reduction from 2005 Base
27Sustainability
MidAmerican Energy
• MidAmerican Energy is the largest owner in the U.S. of rate-regulated wind capacity, with more
than 7,000 MWs in operation or under construction. The company has invested more than
$13 billion in wind energy projects across Iowa
• The company has retired five of its 11 coal units as of September 30, 2021, and plans to retire
the remaining coal units before 2050
• Since 2005, the company has reduced its CO2 emissions by 58%
• To finance a portion of its renewable energy development in Iowa, the company has issued
$4.4 billion of green bonds
2005 MEC Power Generation – 23 TWh(1) 2020 MEC Power Generation – 32 TWh(1)
Hydro & Other Hydro & Natural Gas
0% Coal
Wind Other 2%
23%
4% Coal 0%
78% Nuclear
12%
Nuclear
15%
Natural Gas
3%
Wind
63%
(1) Owned and purchased generation, excluding generation associated with RECs which were not retained
28Sustainability
NV Energy
• Since 2018, NV Energy has received approval for 12 utility-scale solar projects totaling nearly 2,700 MWs of solar generation and over
1,000 MWs of battery storage which will be in-service by 2024, including the company-owned 150 MW Dry Lake solar photovoltaic
project which will be collocated with 100 MWs of integrated battery storage, with the difference procured through power purchase
agreements. These projects are in addition to approximately 1,000 MWs of operating solar power for which approval was obtained prior
to 2018, of which 15 MW are company-owned
• In its 2021 Joint IRP filed June 1, 2021, NV Energy requested approval to build 600 MWs of solar and 480 MWs of integrated battery
storage that will enable the retirement of NV Energy’s last coal-fueled generating station, North Valmy, by the end of 2025
• NV Energy’s 2021 IRP meets all Nevada RPS requirements (e.g., 50% by 2030) and the state’s 2050 net-zero carbon emissions goal
NV Energy 2021 IRP – Forecast Generation as Percent of Demand
100% 6% 6%
11% 13% 14% 11%
80%
40%
42%
60% 1% 55%
1% 66% 75% 85%
8%
40% 4% 3%
2%
20% 45% 42% 1% 2% 2%
28% 1%
17% 11% 1%
0% 7% 0%
(3%) (3%) (16%)
(7%) (11%) (23%)
(20%)
(40%)
2025 2030 2035 2040 2045 2050
Firm Dispatchable(1) Geothermal, Hydro & Other Wind Solar Standalone & Storage Hybrid Market Excess Energy (2)
(1) Firm dispatchable resources represent technologies that can supply electricity reliably on demand for hours, days or weeks at a time. For the purpose of the 2021 IRP, this
resource type was modeled with the characteristics of gas turbines due to the lack of sound data on proven, appropriate low-carbon alternatives. In the future, firm
dispatchable resources could include the use of hydrogen as a fuel, fuel cells or biofuel combustion units
(2) Excess energy represents renewable energy in excess of forecast load requirements, some of which may be mitigated through out-of-state sales or more efficient use of
battery storage than modeled 29Decarbonization of the Balance Sheet
• Berkshire Hathaway Energy is growing its renewable energy portfolio and continues to de-risk its balance sheet related
to carbon-based generation assets. As of December 31, 2020, only 6% of our overall net investment in property, plant
and equipment was invested in coal generation assets and 6% was invested in natural gas generation assets
Net PP&E as of December 31, 2020
Berkshire Hathaway Energy
Renewables, T&D
and Other
88%
Natural Gas
Generation
6% Coal Generation
6%
PacifiCorp MidAmerican Energy Nevada Power Sierra Pacific
77% 90% 82%
63%
7% 37%
16% 9% 4% 14%
1%
30Energy Imbalance Market
Benefits Customers and the Environment
• The energy imbalance market is an innovative market that allows utilities across the West to access the lowest-cost
energy available in near real-time, making it easy for zero-fuel-cost renewable energy to go where it is needed and
reduce carbon emissions. Through September 2021, cumulative benefits totaled approximately $1.7 billion
• PacifiCorp and the California ISO launched the EIM in November 2014. NV Energy joined in December 2015. Berkshire
Hathaway Energy’s cumulative customer benefits total $504 million
November 2014 – September 2021
Combined Benefits
Balancing Area Authority Year Joined Total ($ millions)
CAISO 2014 $344.4
PacifiCorp 2014 $351.6
NV Energy 2015 $152.0
Arizona Public Service 2016 $238.1
Puget Sound Energy 2016 $70.2
Portland General Electric 2017 $128.4
Idaho Power 2018 $126.9
Powerex 2018 $26.9
BANC/SMUD 2019 $144.4
Salt River Project 2020 $72.0
Seattle City Light 2020 $15.9
LADWP 2021 $32.1
Northwestern Energy 2021 $6.2
Public Service Co of New Mexico 2021 $9.1
Turlock Irrigation District 2021 $3.5
Total $1,721.8 31Advancing Transportation Electrification
$224 million investment to expand electric vehicle infrastructure
Pacific Power Rocky Mountain Power
• Investing $30 million to support electric transportation infrastructure as • Investing $66 million to develop electric transportation in Utah
a result of Oregon HB 2165, passed in May 2021 • Facilitated the installation of more than 2,600 Level 2 charging ports and
• Newly approved pilot programs in Oregon will facilitate charging for more than 70 direct current fast-charging ports to date
residential and commercial customers • Developed direct current fast-charging corridors along I-70 and I-80 in
• Ongoing initiatives include Oregon Clean Fuels Program investments 2020
and the West Coast Clean Transit Corridor • Further awarded $12 million in DOE grants to create enduring regional
ecosystem and to integrate electric vehicles onto the grid
MidAmerican Energy NV Energy
• Investing $13 million to install direct current fast chargers across the • Currently investing $15 million to implement an electric vehicle
service territory infrastructure demonstration program facilitating the installation of more
• Installed 18 direct current fast-charging ports through 2020 than 500 Level 2 and direct current fast chargers
• Installing 18 direct current fast-charging ports in 2021 and 14 stations in • In addition, Nevada Senate Bill 448 instructed NV Energy to establish a
2022 3-year, $100 million Economic Recovery Transportation Electrification
Plan aimed to increase the availability of electric vehicle charging
• Will result in direct current fast-charging corridors along I-80, I-29 and
infrastructure, facilitating the installation of more than 1,800 charger
U.S. Highway 20
ports at over 100 new sites
• Nevada Senate Bill 448 also instructed NV Energy to establish a
broader, ongoing Transportation Electrification Plan to be filed as part of
the company’s Distributed Resource Plan which could result in
additional electric vehicle infrastructure spending over the next 10 years
Targeting fast-charging corridors with 50-mile radius between locations 32Social – Advancing Our
Diversity, Equity and Inclusion Framework
VISION: FIVE OBJECTIVE S
To continue building an inclusive work
environment that celebrates the differences A I N C L U S I V E C U LT U R E
of our employees, ensures everyone feels Champion an inclusive culture
valued, respected and empowered, and
enhances the connections we have to the
communities in which we live and work B WORKFORCE
Attract, engage, promote and retain a
diverse workforce
C S T R AT E G I C PA R T N E R S H I P S
Adopt strategic partnerships with the community,
regulators, labor unions and diverse suppliers
D C O M M U N I C AT I O N S
Promote our commitment through internal and
external communications
E A C C O U N TA B I L I T Y
Engage leadership and hold leaders accountable
33Social – Our Customers and Communities
Customer Service
We are focused on delivering reliability, dependability, low prices and exceptional service to our customers.
We are committed to providing innovative solutions that our customers want and need.
Affordable, Clean and Partnering in Our Communities
Reliable Energy
Berkshire Hathaway Energy has a long history of supporting our communities with our
time and talent, as well as making an impact through community giving
We focus on making sure we deliver
exceptional service while keeping
While 2020 presented challenges to in-person volunteer programs, collectively our
costs low. Our customers’ energy
businesses and employees logged more than 34,000 hours in volunteer time and
rates are well below the U.S.
found new ways to volunteer, including a socially distanced blood drive
average
Meeting our communities’ basic needs was a significant priority in 2020 and our
The global pandemic underscored
community giving focused on supporting critical community-based organizations to
the sensitivity our customers have to
help our most vulnerable neighbors address food insecurity. Our community
energy costs and the need for
contributions included approximately $23 million to organizations throughout the
reliable service. We are optimizing
communities we serve
our business to control costs without
sacrifice to exceptional customer
We are a founding partner of the American Council on Renewable Energy’s Accelerate
service
program, helping improve diversity, equity and inclusion within the renewable energy
sector and reduce barriers for participants from underrepresented groups
34Social – Our Employees
Employee Commitment
We equip employees with the resources and support they need to be successful. We encourage teamwork
and provide a safe, rewarding, equitable and inclusive work environment. We make no compromise when it
comes to safety and security.
Safe and Secure Inclusive Environment Wellbeing
Despite challenging working We added to our employee resource In 2020, we found new
conditions, Berkshire groups in 2020, including those ways to work and supported
Hathaway Energy achieved focused on gender, sustainability and employees by implementing
a best-ever safety incident supporting veterans and their families; more flexible policies and
rate of 0.51 in 2020 and this expansion continues in 2021 with increased dialogue, support
0.35 YTD September 2021 additional resource groups and resources to help
reduce the stigma around
mental health
Named a Military Friendly Employer for 12 consecutive years
35Governance
Culture and Values
• Berkshire Hathaway Energy’s businesses are managed with a long-
term view of reducing our impact on the environment
• Our businesses participate in and support community-based and
customer-oriented organizations, encourage volunteerism, integrate
environmental, social and human goals, with integrity and consistent
with business ethics and governance controls
• Our businesses develop strategic working relationships with trusted
partners within the communities in which we do business, and we
serve to reinforce our sustainability message
Data Protection
• We are vigilant in managing employee and customer data to protect
against the release of personal information, creating strong layers of
defense against cyber and physical security incidents and using
internationally recognized cybersecurity frameworks to strengthen
these efforts
Transparency and Reporting
• We are transparent in our operational results and voluntarily report key indicators related to our emissions
data, resource mix, investments in technology, water resources, waste products, employee count and safety
performance
36Business Update
PacifiCorp
         • Six-state service territory
                  ‒ Utah                    – Oregon
                  ‒ Idaho                   – Washington
                  ‒ Wyoming                 – California
         • 4,900 employees
         • 2.0 million retail electricity customers
         • 141,400 square miles of service territory
         • 16,900 transmission line miles
         • 63,800 miles of distribution lines and
           900 substations
                                   (1)
         • 11,668 MWs                    owned capacity
         • Owned capacity by fuel type:
                                           9/30/2021              3/31/2006
             Coal                                  45%                    72%
             Natural Gas                           26%                    13%
             Wind                                  19%                      0%
             Hydro and other                       10%                    15%
     (1) Net MWs owned in operation and under construction as of September 30, 2021   38
PacifiCorp
Business Update
• Actual retail load for the nine months ending September 30, 2021, was 42,553 GWh; a 1,790 GWh
(4.39%) increase compared with the same time period last year, primarily due to favorable residential
and commercial customer usage, favorable weather and an increase in the average number of
customers
• Energy Vision 2020, Pryor Mountain wind facility, and repowering of Foote Creek I wind project are
fully in-service
• Energy Vision 2024 projects are on track
– 590 MWs of new wind in Wyoming
– Repowering development milestones are on track for an additional 93 MWs
– Transmission projects include a new 416-mile 500-kV line from Aeolus to Mona, and a new 59-mile 230-kV line
from Windstar to Shirley Basin
• Negotiations with partners are progressing favorably on the Boardman-Hemingway 290-mile 500-kV
transmission project to support 2026 in-service
• PacifiCorp’s 2021 Integrated Resource Plan (IRP) was filed with its state commissions September 1,
2021. Developed with comprehensive data analysis and active stakeholder input spanning more than
a year-and-a-half, the plan results in a 74% reduction of greenhouse gas emissions from 2005 levels
by 2030
• TerraPower, a nuclear innovation company founded by Bill Gates, is seeking to site a Natrium™
advanced nuclear reactor demonstration project at a retiring coal plant site in Wyoming
• PacifiCorp is evaluating advanced clean energy technologies such as pumped hydro storage
39PacifiCorp
Regulatory Update
• Pacific Power
– Rate case outcomes in Oregon, Washington and California resulted in customer price reductions while
achieving full recovery for all Energy Vision 2020 investments, wildfire investments, accelerated coal
depreciation in Oregon and Washington, and converting Washington from a western control area
methodology to a full PacifiCorp system transmission and renewables methodology for cost recovery
• Rocky Mountain Power
– Rate case outcomes in Utah and Wyoming resulted in no near-term customer bill increases while
achieving full recovery of all investments, including Energy Vision 2020 and wildfire mitigation costs
– In Idaho, a stipulation was reached with parties in a pending rate case resulting in an $8 million increase,
effective January 1, 2022. This is the first general rate case in Idaho in 10 years
• A new interjurisdictional cost allocation methodology was approved in Idaho, Oregon, Utah,
Wyoming and Washington; approval in California will be sought as part of the next general rate
case in 2022
• Energy cost adjustment mechanisms exist in all six states where PacifiCorp has operations
• A new customer generation program was implemented in California and Idaho to transition from
net metering to an export credit model that provides financial compensation for excess energy
exported to the grid rather than kilowatt-hour netting, which better supports pricing excess
customer generation at market value rather than a retail rate. The Utah transition program was
closed, and a new customer generation program went into effect to implement the full export
credit model
40PacifiCorp
2021 IRP
• Updated every two years, PacifiCorp’s IRP identifies the best mix of resources to serve our customers
in the future
• PacifiCorp’s 2021 IRP was filed with its state commissions in September 2021
• PacifiCorp’s 2021 IRP must identify a least-cost, least-risk resource portfolio and an action plan that
sets forth how the company will deliver the outcomes represented in the preferred portfolio. Request
for proposals will be issued to the market in January 2022, with a final shortlist expected in January
2023
• Building upon significant renewable resource and transmission investments that have come on-line in
recent years, highlights of PacifiCorp’s 2021 IRP include:
– More than 1,800 MWs of new wind generation by 2025, and a total of more than 3,700 MWs of new wind
generation by 2040
– Over 2,100 MWs of new solar generation by 2025, and more than 6,400 MWs of new solar generation by 2040
– Nearly 700 MWs of battery storage by 2025, and more than 6,600 MWs of battery storage by 2040
– Construction of new transmission lines from Aeolus to Mona a 416-mile, 500-kV line, Windstar to Shirley Basin a
59-mile, 230-KV line, and Boardman to Hemmingway, a 290-mile, 500-kV line
– Jim Bridger Units 1 and 2 will be converted from coal to natural gas in 2024 with continued operations through
2037, which aligns with the operating life of the remaining two Jim Bridger coal units
– Addition of a 500 MW NatriumTM advanced nuclear demonstration project in 2028 and 1,000 MWs from two
additional advanced nuclear resources in 2038
– By 2042, PacifiCorp will have removed from service 26 coal units, including 2,139 MWs by the end of 2025, more
than 3,053 MWs by 2030, and 4,932 MWs by 2040 (includes Carbon in 2015, Naughton Unit 3 in 2019, and
Cholla Unit 4 in 2020);
41PacifiCorp
Major Transmission Projects
More than $8 billion investment including AFUDC and network upgrades; $2.3 billion placed in-
service
• Aeolus-Mona and Windstar-Shirley Basin
Wallula
– 475 miles; estimated cost of $2 billion McNary
Boardman
– Planned in-service 2024
– Allows interconnection of an additional 1,920 MWs of
renewable generation resources in eastern Wyoming Hemingway
deliverable across PacifiCorp’s system
Midpoint
• Boardman-Hemingway Borah
Shirley
Basin
Populus
– 290 miles; estimated cost of $0.8 billion (PacifiCorp’s Cedar Hill Windstar
Aeolus
share) Bridger/
Ben Anticline
– Oregon Energy Facility Siting Council site certificate Lomond
Terminal
target date May 2022
Oquirrh
– Planned in-service 2026
• Gateway West Mona/
Clover
– 700 miles; estimated cost of $3 billion
Sigurd
– Estimated in-service 2027/2030 (earliest) Existing Lines
Red Butte
• Segments Placed In-Service Future Lines
– 576 miles; approximate cost of $2 billion
– Populus-Terminal (135 miles) November 2010
– Mona-Oquirrh (100 miles) May 2013
– Sigurd-Red Butte (170 miles) May 2015
– Wallula-McNary (31 miles) January 2019
– Aeolus-Bridger/Anticline (140 miles) November 2020
42PacifiCorp
Wildfire Update
• 2020 Wildfires
– In September 2020, a severe weather event resulting in high winds, low humidity and warm
temperatures contributed to several major wildfires, private and public property damage,
personal injuries and loss of life, and widespread power outages in Oregon and California
– Multiple civil actions have been filed in Oregon and California state courts on behalf of
citizens and businesses who suffered damages from wildfires allegedly involving
PacifiCorp’s equipment. Two lawsuits allege wrongful death and personal injury claims
related to the Beachie Creek Fire
– Investigations into each wildfire is complex and ongoing
– As of September 30, 2021, PacifiCorp has accrued $136 million as its best estimate of the
potential losses net of expected insurance recoveries associated with the 2020 Wildfires
that are considered probable of being incurred
• PacifiCorp’s wildfire mitigation plans were developed in partnership with emergency services
leaders, as well as local and statewide authorities. The wildfire mitigation plan scope is a
multiyear effort, and includes the following:
– Emergency Management
– Meteorology
– Risk Modeling
– Vegetation Management
43Wildfire Risk Mitigation Plans
• The California Public Utilities Commission conditionally approved PacifiCorp’s 2021 Wildfire Mitigation
Plan Update in July 2021, subject to general requirements to provide a progress report in November
2021 and plan update in March 2022 and to continue describing advancements in risk modeling, risk
spend efficiency analysis and efforts to reduce the impacts of proactive de-energization
• PacifiCorp conducted a Public Safety Power Shutoff August 17, 2021, in Siskiyou County, California,
triggered by wind and weather conditions meeting shutoff criteria; approximately 1,952 customers were
impacted, and all had power restored by early morning the following day
• The Oregon Public Utility Commission (OPUC) began a series of workshops as part of a permanent
rulemaking in June 2021 to address wildfire risk analysis, public safety power shutoffs, community
engagement, vegetation management and system hardening and operations; cost analysis will also be
addressed after scoping utility investments and operations
• The Oregon Legislature passed comprehensive wildfire legislation, Senate Bill 762, including
provisions relating to the development and approval of wildfire mitigation plans to establish standards
and procedures for mitigating the risk of catastrophic wildfires; the company will be required to file a
risk-based wildfire protection plan for approval with the OPUC no later than December 31, 2021
• PacifiCorp submitted its first annual wildland fire cost and compliance report in Utah, which describes
the actions taken by PacifiCorp to execute the Wildland Fire Protection Plan approved by the Utah
Public Service Commission in 2020, actual costs incurred to execute the plan and updates to forecast
costs for 2021 through 2026; acknowledgment that the company’s report complied with the
requirements of the rules was issued by the commission in July 2021
44PacifiCorp Wildfire Cost Recovery
Regulatory Mechanisms
• PacifiCorp has recovery mechanisms in Oregon, Utah and California for costs
associated with wildfire mitigation, vegetation management and catastrophic events
– Oregon – Effective January 1, 2021, Annual Wildfire Mitigation and Vegetation
Management Cost Recovery Mechanism approved for three years to recover vegetation
management and wildfire mitigation operations and maintenance costs and wildfire
mitigation capital costs, incremental to those included in base rates. Recovery is subject to
performance metrics and earnings tests. After three years, the mechanism will be assessed
to determine whether continued use is warranted
– Utah – Wildland Fire Mitigation Balancing Account to recover operating expenses and
capital expenditures incurred to implement PacifiCorp’s Utah Wildland Fire Protection Plan
incremental to those included in base rates
– California – Catastrophic Events Memorandum Account for catastrophic events allows for
deferral and cost recovery of reasonable costs incurred as the result of catastrophic events,
which are events for which a state or federal agency has declared a state of emergency.
Fire Risk Mitigation Memorandum Account to track costs related to wildfire mitigation
activities incremental to what is in base rates and Wildfire Mitigation Plan Memorandum
Account to track costs associated with the implementation of PacifiCorp’s approved wildfire
mitigation plan
45MidAmerican Energy
• Headquartered in Des Moines, Iowa
• 3,400 employees
• 1.6 million electric and natural gas
customers in four Midwestern states
(1)
• 11,787 MWs of owned capacity
IOWA • Owned capacity by fuel type:
9/30/2021 12/31/2000
Wind 61% 0%
Coal 23% 70%
Natural Gas 11% 19%
Nuclear and other 5% 11%
MidAmerican Energy service area
Major generating facilities
(1) Net MWs owned in operation and under construction as of September 30, 2021
Operational wind farms
Wind project under construction
Solar projects under construction
46MidAmerican Energy
Business Update
• Actual retail load for nine-months ending September 30, 2021, was 21,330 GWh; a 1,303 GWh
(6.5%) increase compared with the same time period last year, primarily due to customer growth,
warmer-than-normal summer weather and improved industrial sales
• MidAmerican’s electric rates – 11th lowest in the country along with a high renewable
concentration – have been a significant factor in attracting retail load, particularly from data
centers and other large customers; sales to MidAmerican’s largest customers on individual rates
increased 17.5% for the nine-months ended September 30, 2021, over the same period in 2020
• MidAmerican’s goal is to provide 100% renewable energy to its Iowa customers through its
GreenAdvantage® program. In 2020, approximately 84% of the electricity provided by
MidAmerican to retail customers in Iowa came from renewable energy on an annual basis
• In October 2021, the IUB approved the extension for 2021-2023 of a depreciation deferral
regulatory mechanism originally approved in MidAmerican’s 2013 rate case that will result in
approximately $50 million lower annual depreciation expense in those years
• Renewable Development
– Additional cost-effective wind and solar generation and storage projects continue to be
evaluated to maintain and further expand the company’s renewable commitment to retail
customers
47MidAmerican Energy
Renewable Development
Project Estimated Cost Capacity Planned Completion Additional Notes
Wind XII Expansion $295 million 207 MWs Completed in Q1 2021 Qualifies for 100% of eligible PTC rate
Purchase of existing project that was not
Purchased March 2020;
Pocahontas Prairie Wind, eligible for PTCs (seller utilized ITC);
$125 million 80 MWs repowering expected
including repowering repowering qualifies for 100% of eligible
completion Q4 2021
PTCs
Expected Completion by
Arbor Hill Solar $41 million 24 MWs Qualifies for 30% ITC
Q4 2021
Expected completion by
Holliday Creek Solar $188 million 100 MWs Qualifies for 30% ITC
Q4 2022
Expected completion by
Plymouth Wind $388 million 203 MWs Qualifies for 100% of eligible PTC rate
Q4 2021
591 MWs Expected completion by
Wind Repowering $984 million Qualifies for 80% of eligible PTC rate
(original capacity) Q4 2022
301 MWs Expected completion by
Wind Repowering $314 million Qualifies for 60% of eligible PTC rate
(original capacity) Q4 2022
• As of September 2021, MidAmerican has invested more than $13 billion in wind energy projects across Iowa
48You can also read