2022 Housing Market Hidden Gems - National Association of REALTORS Research Group - National Association of ...
←
→
Page content transcription
If your browser does not render page correctly, please read the page content below

2022 Housing Market
Hidden Gems
National Association of REALTORS® Research Group

2022 Housing Market Hidden
Gems
LAWRENCE YUN, PhD
Chief Economist & Senior Vice President for Research

JESSICA LAUTZ, Dr. of Real Estate
Vice President of Demographics and Behavioral Insights

GAY D. CORORATON
Senior Economist & Director of Housing and Commercial Research

MEREDITH DUNN
Research Manager

©2021 National Association of REALTORS®
All Rights Reserved. May not be reprinted in whole or in part without permission of the
National Association of REALTORS®.

For questions about this report or reprint information, contact data@realtors.org.
Year-end Housing Market Review
                 and Outlook
Housing Market in 2021: Strongest Market in 15 Years

As of the third quarter of 2021, the economy has fully recovered from a deep but brief
contraction in first half of 2020, with the GDP (in 2012 dollars) at 3% above the pre-pandemic
level. As of October 2021, 18 million of the 22.24 million payroll jobs that were lost in March
and April 2020 have been recovered. The unemployment rate has fallen to 4.6%, although
this is still higher than the pre-pandemic unemployment rate of 3.5%. Even as inflation
picked up to 6.2% as of October 2021 due to rising energy and transportation prices that the
Federal Reserve Board views as transitory, monetary and fiscal policy has remained
accommodating in 2021, resulting in a low interest rate environment that boosted housing
demand.

Supported by the lowest mortgage rates in 50 years of below 3% for most of 2021, existing-
home sales rose 11% year-over-year in the first 10 months. Sales started to normalize from
January to August but picked up steam again in September and October. Existing-home
sales are likely to 6 million in 2021, the highest level in 15 years (6.477 million in 2006).

Housing supply conditions were extremely tight in 2021, with the end-of-the-month
inventory of homes for sale dipping to historic lows, an equivalent 1.9 months of monthly
sales’ pace in January and February 2021. Inventory has improved somewhat, to 2.4 months
as of October, but it is still below 6 months, a level associated with a balanced market. As of
the end of October, the inventory of existing homes for sale and new single-family homes
were both 12% below the level in 2020. Properties sold faster, typically in 18 days as of
October, from 21 days during the same period in 2021.

Builders continued to face the economic fallout of the pandemic, delays in sourcing
materials and parts, rising cost of raw materials, and difficulty hiring construction workers.
Housing starts for single unit homes measured on an annual rate fell to 700,000 in April
2020 and have recovered just partially to an annual rate of 1.04 million as of October 2021,
down from 1.16 million during October 2020. The price of softwood lumber rose by as much
as 161% in May 2021 although as of October 2021, the price of lumber has fallen to 20% below
the level one year ago. Construction labor is getting harder to find as the number
of construction workers seeking employment and the number of job openings narrowed
declined from a ratio of 3:1 in January 2021 to just 1:1 by September 2021. Access to
skilled construction labor remains the key challenge to increasing housing supply in the
coming years.

With strong demand and lack of supply, the median existing-home sales price has
increased year-over-year for 116 consecutive months, well over the 79 months of sustained
price gains before home prices started to collapse in 2006. The median existing-home
sales price rose to its highest pace of 23.6% in May 2021, but as of October 2021, the pace
of price appreciation has slowed to 13.1%. The median sales price of new single-family homes
increased 17.5% year-over-year in October. Affordability took a hit in 2021, as the increase in
home prices outpaced wage gains, with the average weekly wage just up 4.6% year-over-
over.

                          Top 10 Undervalued Metro Area Housing Markets in 2021                   3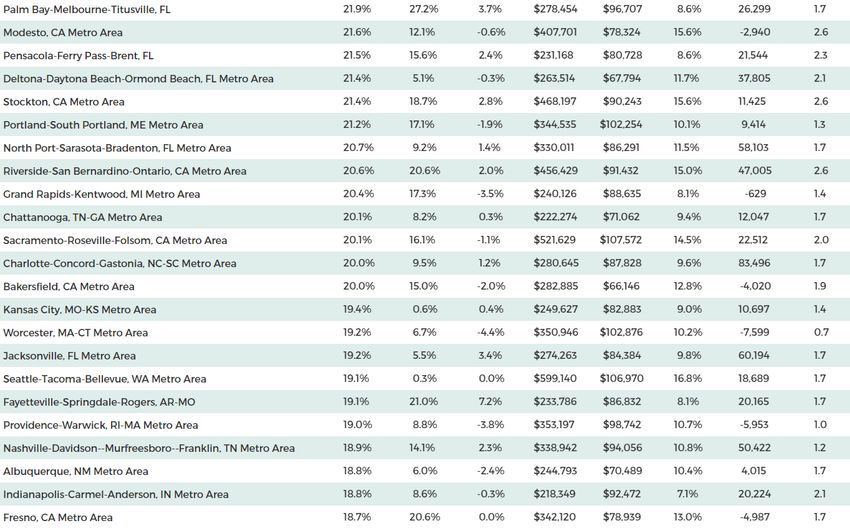
Year-end Housing Market Review
                   and Outlook
With intense competition for limited supply and rising home prices, first-time buyers
struggled to compete against cash and repeat buyers. The share of first-time homebuyers
fell to an average of 30% in the 10 months of 2021, down from 33% in 2020, according to a
survey of REALTORS®. NAR’s 2021 Profile of Home Buyers and Sellers reported that the
annual share of first-time buyers during July 2020 through June 2021 was 34%.1 On other
hand, with the share of non-primary buyers (investors and second home buyers) rose to 16%
from 13% in 2020. With more opportunity to work from home, the share of vacation home
sales rose to an average of 6% in the first 10 months of 2021 from 5% in 2019 (and 5.5% in
2020). The share of all-cash sales also rose to 23% from 18% in 2020 as investor and vacation
buyers tend to make an all-cash purchase compared to first-time buyers.

Home prices held firm as struggling homeowners were able to seek forbearance. As of
October 31, only 2 million homeowners were in forbearance plans, according to Mortgage
Bankers Association data. Among buyers who exited forbearance, less than 10% of those who
exited forbearance did so by selling their home or paying off the loan through a deed-in-lieu
or short sale. As such, sales of distressed properties (foreclosed or short sales) made up just
1% of existing-home sales. During 2009-2010 or the Great Recession, 35% of home sales were
of distressed properties.

Amid tight supply conditions, home prices typically rose in nearly all metro areas. Among 183
metro markets tracked by NAR, the median existing-home sales price rose in 99% of the
metro areas as of the third quarter, with 78% posting double-digit price gains. Similarly,
among 457 measured markets for which the Federal Housing Finance Agency calculates a
Home Price Index, 74% of markets had double-digit price gains as of 2021 Q2. As of 2021 Q3,
the metro areas with the highest year-over-year increase in the median existing-home sales
price were Austin-Round Rock, TX (33.5%); Naples-Immokalee-Marco Island, FL (32.0%); Boise
City-Nampa, ID (31.5%); Ocala, FL (29.7%); Punta Gorda, FL (27.5%); Salt Lake City, UT (26.2%);
Phoenix-Mesa-Scottsdale, AZ (25.8%); Sebastian-Vero Beach, FL (25.7%); Port St. Lucie, FL
(24.9%); and New York-Jersey City-White Plains, N.Y.-N.J. (24.5%).

Along with home affordability, job growth is a key driver of housing demand. As of October
2021, only four states had employment levels that are at least equal to the level in March
2020: Idaho (1.7%), Utah (3.8%), Arizona (0.4%), and Texas (0%). Among 445 metro areas, only
15% have non-farm employment as of 2021 Q3 that is higher than the pre-pandemic level in
2019 Q3, led by St. George, UT (9.5%), Pocatello, ID (7.5%), Logan UT-ID (6.9%), Idaho Falls, ID
(6.99%), and Provo-Orem, UT (6.8%).

According to US Census Bureau data, in 2020, the metro areas with the highest net domestic
migration were Phoenix, AZ (82,380); Dallas, TX (58.026); Austin, TX (48,8730); Tampa, FL
(41,565); Charlotte, NC-SC (30,414); Las Vegas, NV (28,502); San Antonio, TX (25,798); Atlanta, GA
(23,587), North Point-Bradenton-Sarasota, FL (20,903), and

1 The Profile of Home Buyers and Sellers survey results represent owner-occupants and differ from separately reported
monthly findings from NAR’s Realtors® Confidence Index, which include all types of buyers. The HBS results include both
new and existing homes.

                                 Top 10 Undervalued Metro Area Housing Markets in 2021                                    4
Year-end Housing Market Review
                   and Outlook
Jacksonville (20,679). NAR’s analysis of USPS data indicates that the metro areas with the
most net migration gains in the first half of 2021 were Barnstable Town, MA; Portland, ME;
Myrtle Beach, SC; Asheville, NC; Wilmington, NC; Raleigh, NC; Greeley, CO, Bridgeport, CT;
Huntsville, AL; Greenville, SC; Jacksonville, FL; Knoxville, TN; Providence, RI; Boise City, ID; and
Charlotte, NC-SC.

As home prices rose at double-digit pace in most markets, apartment demand and rents
soared to unprecedented levels, according to CoStar® data on 390 markets. From the second
quarter of 2020 through October 2021, apartment occupancy rose by about
1 million on a net basis (net absorption) in 390 markets. As of October 2021, the median
asking rent in these 390 markets rose 11% on a year-over-year basis compared just 3% in 2019.2
Over a 12-month period as of October 2021, the demand for apartments rose across primary
metro areas (New York, Chicago, Boston, Washington DC, Los Angeles, and San Francisco)
and secondary or tertiary markets, led by Dallas (50,859), New York (41,499), Houston (40,499),
Los Angeles (32,427), and Washington DC (24,208). However, as a percentage of the stock of
apartment units and among metro areas that had a net absorption of at least 1,000 units, the
largest net absorption were in Fort Myers, FL
(18.2%), Midland, TX (15.4%), Greeley, CO (12.8%), Spartanburg, SC (12.7%), and Myrtle Beach, SC
(11.9%).

Housing Market Outlook in 2022: Slower Sales, Modest Price Gains

NAR expects the economy to expand at a modest rate of 2.6% in 2022 as the Federal Reserve
Board tightens monetary conditions to rein in inflation towards a long-run average of 2%. The
30-year fixed mortgage rate is expected to increase to an average of 3.5% in 2022 from 3% in
2021. However, it is worth emphasizing that the 3.5% rate is still low by historical standards
and is lower than the average rate of 3.9% in 2019.

With higher mortgage rates, existing-home sales are expected to decrease slightly to 5.9
million in 2022.

Supply chain bottlenecks are expected to ease in 2022, barring a major resurgence of a
COVID variant (Delta, Omicron). However, the labor market will continue to tighten, with the
unemployment rate falling further to an average of 4.9%. Under these conditions, total new
housing units started (single-family and multi-family) are expected to only modestly increase
to 1.67 million. Housing starts will be at pace with household formation (1.75 million in 2020).

Given the modest increase in housing supply, home prices are expected to continue to
increase, although at a modest pace of below 5%.

Strong employment growth, relatively affordable housing prices, and good infrastructure,
including broadband access, will continue to drive the difference in local market
housing conditions.

2 The US Census Bureau reported that the CPI index on Shelter for primary residence rose 2.7% year-over-yea in
October 2021, the same as in October 2020. This figure includes rent paid by existing and new renters.

                                 Top 10 Undervalued Metro Area Housing Markets in 2021                           5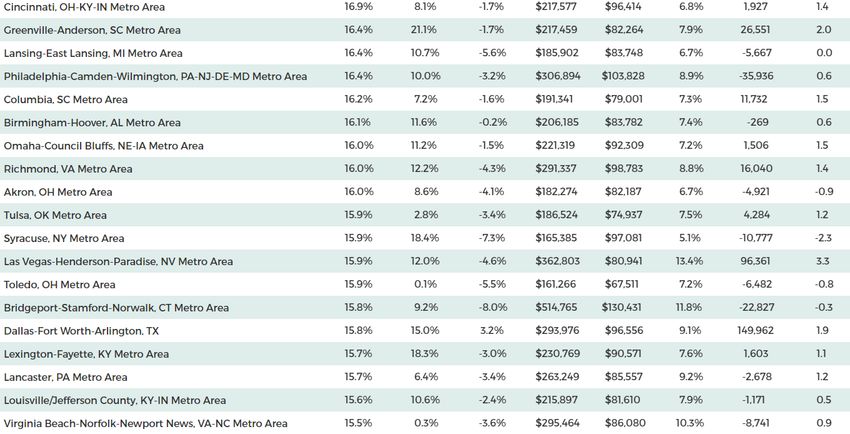
Top 10 Undervalued Markets in 2021
The National Association of REALTORS® identified top 10 markets that underperformed
in 2021 relative to their underlying market fundamentals. These markets are expected
to experience stronger price appreciation relative to other markets in 2022.
What is an undervalued market?
NAR considered a market undervalued if its median home price-to-median family income
ratio is at the lower end of the distribution of 379 metro areas relative to the distribution of a
combined set of seven indicators that drive demand and supply:
3-year wage growth (BLS average weekly wage, 2018 Q2-2021 Q2)
3-year job growth (BLS non-farm payroll employment, 2018 Q3- 2021 Q3)
Ratio of the 3-year change in population (2020 vs. 2017) to the sum of housing permits
over a 3-year period (2018-2020)
3-year population growth (US Census Bureau, 2017-2020)
Net domestic migration as a percent of population (US Census Bureau, 2020)
Percent of population 25 to 44 years old (US Census Bureau American Community
Survey, 2019)
Percent of household with broadband service (US Census Bureau American Community
Survey, 2019)
Methodology for identifying an undervalued market
NAR estimated the ratio of the median home value to the median family income for
each metro area as of 2021 Q2 and a z-score was estimated for 378 markets.3
Z-scores were estimated for each of the seven indicators and an average z-score
was derived.
A metro area with a ratio of the median home value to the median family income that was
at the lower half of the distribution (z-scores are below 0 so home prices are relatively
affordable ) and an average z-score of the seven explanatory variables that was at the upper
half of the distribution (z-scores are above 0 so market fundamentals are relatively stronger)
was considered an undervalued market.
In identifying the final top 10 undervalued markets, NAR considered only metro areas with
a population of at least 200,000 and metro areas with positive job growth, positive wage
growth, and positive net domestic migration.
3 NAR estimated the median value of the property as of 2021 Q2 by applying the change in home prices using the FHFA
Home Price Index to the median value of the property in 2019 produced by the US Census Bureau from the American
Community Survey. NAR estimated the median family income as of 2021 Q2 by applying the growth in average weekly
wages produced by the Bureau of Labor Statistics Establishment Survey to the median family income in 2019 that is
produced by the US Census Bureau’s American Community Survey in 2019. Using mortgage payment to income yields
the same z-score if the same mortgage rate is used for all metro areas.
Top 10 Undervalued Metro Area Housing Markets in 2021 6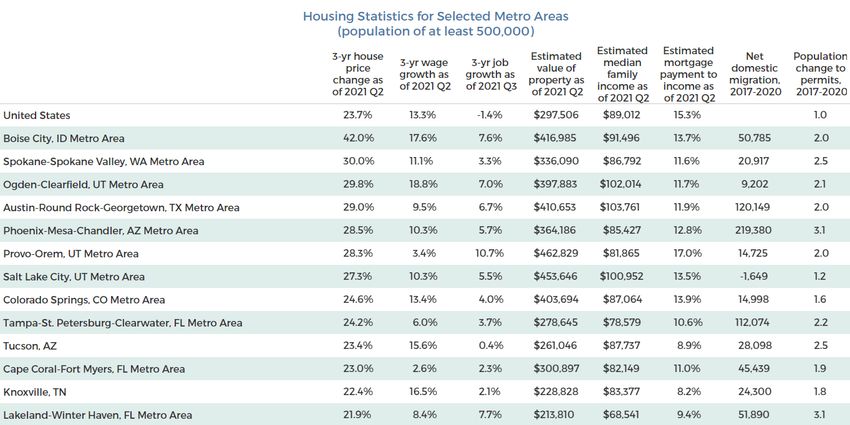
Top 10 Undervalued Markets in 2021

        Top 10 Undervalued Metro Area Housing Markets in 2021   7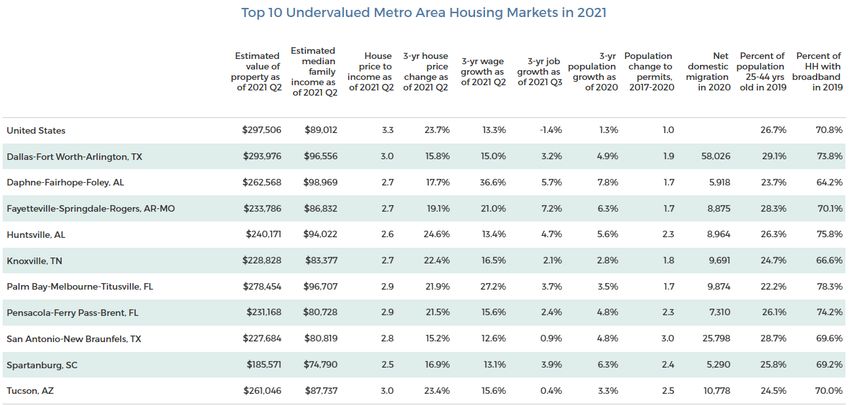
Top 10 Undervalued Markets in 2021

In alphabetical order, below are the top 10 undervalued markets in 2021.
These markets are all in the South Region of the United States.

Dallas-Fort Worth, Texas. Dallas-Fort Worth remains an undervalued market, with a home
value-to-income ratio of 3.0 compared to the U.S. ratio of 3.3. Its home-to-income ratio is lower
than that of Austin (4.0) and that of major metros such as San Francisco (6.0), San Jose (7.3), Los
Angeles (7.9), New York-Newark-Jersey City (4.9), Boston (4.1), or Washington DC (3.7). Located in
a state with no state tax and with affordable home prices, the US Census Bureau estimated that
about 58,000 people moved to the Dallas-Fort Worth on a net basis from other states in 2020, a
pandemic year. Among the top 10 undervalued markets, it has the highest share of the
population that is aged 25 to 44 years old, making up 29.1% of the population compared to the
national average of 26.7%. Strong migration into the area will continue to create upward
pressure for home values to increase further
in 2022.

Daphne-Fairhope-Foley, Alabama. This metro area is the fastest-growing area in terms of
population growth, with a 7.8% rise in population from 2017 through 2020 compared to the US
rate of 1.3%. It also had the highest increase in average weekly wages with a cumulative increase
of 36.6% during 2018 Q2—2021 Q2 while home prices rose by just 17.7%. Over a 3-year period from
2018 Q3 through 2021 Q3, non-farm payroll employment rose at the second high pace of 5.7%
compared to the overall decline in jobs of 1.4%. However, access to broad-band services is
relatively low, with just 64.2% of households having broadband services; improving the access to
broadband services will help attract more businesses
and workers into the area.

Fayetteville-Springdale-Rogers, Arkansas-Missouri. This metro area experienced the
highest cumulative job growth in 2018 Q3—2021 Q3, at 7.2%, and the second highest increase in
population from 2017 to 2020, at 6.3% (tied with Spartanburg, SC). Home prices rose at a
cumulative rate of 19.1% during 2018 Q2—2021 Q2, about the same pace as the 21% gain in
average weekly wages. The strong job growth could push wages up further in 2022 which can
boost home demand and therefore also home prices.

Huntsville, Alabama. This metro area experienced the highest cumulative 3-year gain in
home prices, at 24.6%, outpacing wage gains of 13.4%. Over a 3-year period, jobs increased by
4.7% and its population rose 5.6%, outpacing the national rates. It has the second highest fraction
of households with access to broadband services, at 75.8%. Its strong job growth and good
infrastructure such as broadband service are likely to attract businesses and workers into the
area, boosting housing demand and home prices in 2022.

Knoxville, Tennessee. This metro area has one of the most affordable home prices, with the
median value of property at $228,878, so it is attracting movers into the area. In 2020, nearly
10,000 people moved into the area. Home prices are rising fast at a cumulative 3-year pace of
22.4% as of 2021 Q3,outpacing the cumulative wage growth of 16.5%. Like the Daphne metro area,
access to broad-band services is relatively low, with just 66.6% of households with broadband
services; improved opportunity to access broadband services can encourage more businesses
and workers to relocate to the area, especially those wanting to work from home.

                            Top 10 Undervalued Metro Area Housing Markets in 2021               8
Top 10 Undervalued Markets in 2021
Palm Bay-Melbourne-Titusville, Florida. With a home-to-income ratio of 2.9 (same as
Pensacola), it is affordable compared to other Florida metro areas of Miami-Kendall (4.7),
Orlando-Kissimmee-Sanford (3.9), North Point-Bradenton-Sarasota (3.8), Port St. Lucie (3.5), or
Cape Coral-Fort Myers (3.7), Tampa-St. Petersburg (3.5). This metro area had the second
highest pace of wage growth over a 3-year period, at 27.2% (next to Daphne metro area). It has
the highest share of households with broadband services, at 78.3%, making it attractive place
to live in for workers who want to work from home. Its population is relatively older, with the
population ages 25-44 years old making up just at 22.2% which is below the US share of 26.7%.
The influx of retirees and workers is expected to bolster the demand for housing and home
prices for this metro area in 2022.
Pensacola-Ferry Pass-Brent, Florida. Like the Palm Bay metro area, Pensacola has a
home-to-income ratio of 2.9 which makes it affordable compared to other Florida metro areas
of Miami-Kendall (4.7), Orlando-Kissimmee-Sanford (3.9), North Point-Bradenton-Sarasota (3.8),
Port St. Lucie (3.5), or Cape Coral-Fort Myers (3.7), Tampa-St. Petersburg (3.5). A high fraction of
the population has broad-band service, at 74.2%, and with its beautiful beaches and good
broadband service, it will tend to attract homebuyers who desire to enjoy their leisure time at
its beaches.
San Antonio-New Braunfels, Texas. This metro area had the second highest net
domestic migration in 2020, at 25,798 (next to Dallas). It is affordable, with an estimated
median home value of $227,684, the second lowest among the top 10 undervalued markets
(next to Spartanburg). It is much more affordable compared to other Texas metros like Austin
($410,653), Dallas ($293,976), and Houston ($245,098). Because of its affordability, its population
rose 4.8% over a 3-year period as of 2020. However, housing supply is very tight, with the
highest ratio of the change in population from 2017 through 2020 per housing permit, at 3
persons per housing permit.
Spartanburg, South Carolina. This metro area is located between Charlotte and
Greenville and is more affordable, with an estimated median home value as of 2021 Q2 of
$181,571 compared to the Charlotte metro area ($280,645) and Greenville ($217,459). This metro
area experienced the second highest cumulative population growth rate from 2017—2020 of
6.3% (tied with Daphne and second to Fayetteville). Over a 3-year period from 2018 Q3—2021
Q3, jobs rose 3.9%. However, a lower fraction of households have access to broadband services
(69.2%) compared to the national US rate (70.8%) as of 2019, so increasing access to and
availability of broadband services will be key to attracting business and workers into the area.
Tucson, Arizona. Tucson is very affordable compared to Phoenix. As of 2021 Q2, the median
property value was $261,046 which is equivalent to 3 times the median family income,
compared to the median property value in Phoenix is $364,186 which is 4.3 times the median
family income. Among the top 10 undervalued markets, Tucson had the third largest net
domestic migration in 2020, at 10,778 (next to Dallas and San Antonio). Due to strong
population growth and net domestic migration, home prices rose at a 3-year cumulative
rate from 2018 Q2—2021 Q2 of 23.6%, outpacing wage gains of 15.6%.
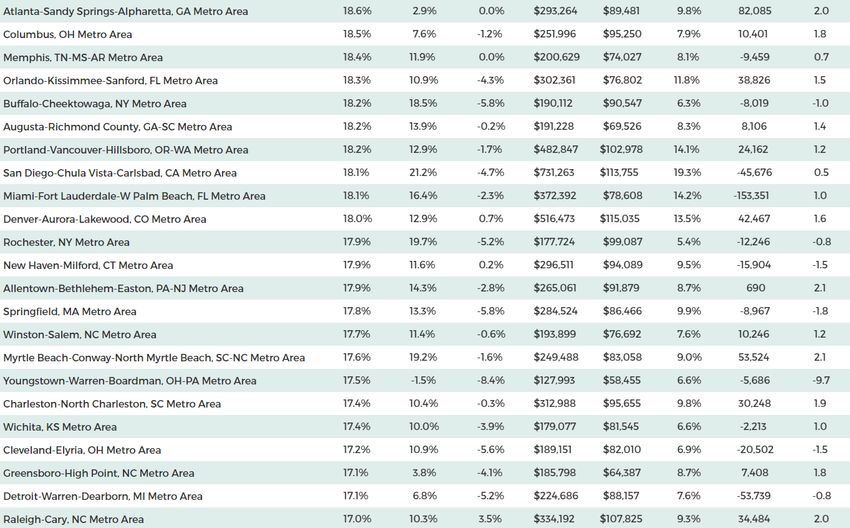
Top 10 Undervalued Metro Area Housing Markets in 2021 9Appendix: Housing Statistics
Top 10 Undervalued Metro Area Housing Markets in 2021 10Appendix: Housing Statistics
11
Top 10 Undervalued Metro Area Housing Markets in 2021 11Appendix: Housing Statistics
Top 10 Undervalued Metro Area Housing Markets in 2021 12The National Association of REALTORS® is America’s largest trade association, representing more than 1.5 million members, including NAR’s institutes, societies and councils, involved in all aspects of the real estate industry. NAR membership includes brokers, salespeople, property managers, appraisers, counselors and others engaged in both residential and commercial real estate. The term REALTOR® is a registered collective membership mark that identifies a real estate professional who is a member of the National Association of REALTORS® and subscribes to its strict Code of Ethics. Working for America's property owners, the National Association provides a facility for professional development, research and exchange of information among its members and to the public and government for the purpose of preserving the free enterprise system and the right to own real property. NATIONAL ASSOCIATION OF REALTORS® RESEARCH GROUP The Mission of the NATIONAL ASSOCIATION OF REALTORS® Research Group is to produce timely, data-driven market analysis and authoritative business intelligence to serve members, and inform consumers, policymakers and the media in a professional and accessible manner. To find out about other products from NAR’s Research Group, visit www.nar.realtor/research-and-statistics 500 New Jersey Avenue, NW Washington, DC 20001 202.383.1000
You can also read