2022 State of the Ecosystem - New England - National Oceanic ...
←
→
Page content transcription
If your browser does not render page correctly, please read the page content below
2022 State of the Ecosystem
New England
2022 STATE OF THE ECOSYSTEM                        | New England

  Performance Relative to Fishery Management Objectives
  Trends and status of indicators related to broad ecosystem-level fishery management objectives, with implications
  for the New England Fishery Management Council (NEFMC)

               Gulf of Maine (GOM)
                 Seafood production                                 Commercial profits                               Stability
                 (total and NEFMC managed                           (2020 regional landings not yet                  (fishery and ecosystem diversity
   OBJECTIVE     landings)                                          available)                                       maintained over time)
(INDICATOR)

                                GOM                                          Total             Managed                      Fishery           Ecosystem

    30 YEAR
      TREND

                                                                                                                            Fishery
                                                                                                                         Comm      Rec        Ecosystem

    CURRENT           Status not updated for 2020                             Status not updated for 2020
     STATUS

                Regional commercial landings data are not yet        Coast-wide, a number of species managed         Fishery: Commercial fleet diversity indicates a
                available for 2020, but coastwide landings           by the NEFMC, as well as lobster,               continued shift toward reliance on fewer species
                trends for federally managed species were            experienced a decline in revenue when           with a large drop in 2020 leading to the lowest
                mixed when compared to recent years.                 compared to the average revenue generated       species diversity to date.
                Monkfish, lobster, and scallop landings              2015 - 2019. This decline was driven by a       Recreational: Species diversity is increasing
IMPLICATIONS    declined while aggregate groundfish landings         mix of landings declines (monkfish, lobster,    due to increases in southerly species and lower
                increased over recent averages. Recreational         scallops) and price declines (monkfish,         catch limits on traditional regional species.
                harvest in New England reached its lowest            lobster, scallops, and groundfish).
                point in 2020, driven in part by management to                                                       Ecosystem: Overall indicators suggest stability,
                address poor/unknown stock status.                                                                   but several climate and oceanography metrics
                                                                                                                     are changing and should be monitored as
                Climate indicators continue trending toward                                                          warning signs for potential regime shift or
                uncharted territory, which affects stock                                                             ecosystem restructuring.
                distributions and will generate other
                ecosystem changes.

                                           Georges Bank (GB)
                                           Seafood production                              Commercial profits                            Stability
                                           (total and NEFMC managed landings)              (indicator not updated, 2020 regional         (fishery and ecosystem diversity
                         OBJECTIVE                                                         landings not yet available)                   maintained over time)
                      (INDICATOR)

                                                               GB                                           GB                               Fishery             Ecosystem

                             30 YEAR
                               TREND
                                                                                                                                            Fishery
                                                                                                                                         Comm     Rec            Ecosystem

                                                    Status not updated for 2020                   Status not updated for 2020
                             CURRENT
                              STATUS
                                          Regional commercial landings data are         Coast-wide, a number of species managed       Fishery: Commercial fleet diversity indicates
                                          not yet available for 2020, but coastwide     by the NEFMC, as well as lobster,             a continued shift toward reliance on fewer
                                          landings trends for federally managed         experienced a decline in revenue when         species, with a large drop in 2020 leading to
                                          species were mixed when compared to           compared to the average revenue               the lowest species diversity to date.
                                          recent years. Monkfish, lobster, and          generated 2015 - 2019. This decline was       Recreational: Species diversity is increasing
                    IMPLICATIONS          scallop landings declined while               driven by a mix of landings declines          due to increases in southerly species and
                                          aggregate groundfish landings increased       (monkfish, lobster, scallops) and price       lower catch limits on traditional regional
                                          over recent averages. Recreational            declines (monkfish, lobster, scallops, and    species.
                                          harvest in New England reached its            groundfish).
                                          lowest point in 2020, driven in part by                                                     Ecosystem: Overall indicators suggest
                                          management to address poor/unknown                                                          stability, but several climate and
                                          stock status.                                                                               oceanography metrics are changing and
                                                                                                                                      should be monitored as warning signs for
                                          Climate indicators continue trending                                                        potential regime shift or ecosystem
                                          toward unprecedented levels, which                                                          restructuring.
                                          affects stock distributions and will
                                          generate other ecosystem changes.                                                                                                      1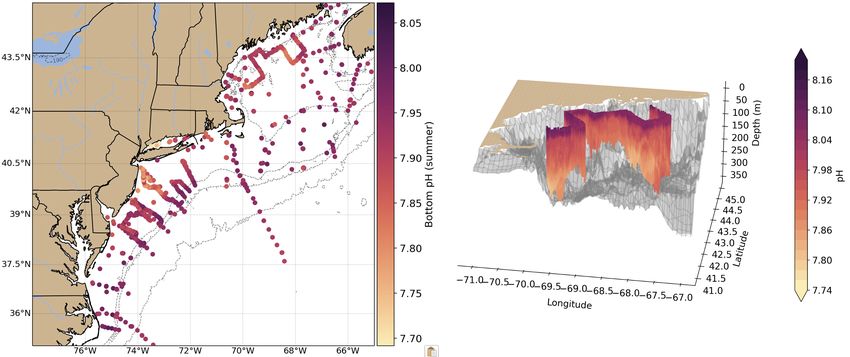
2022 STATE OF THE ECOSYSTEM                 | New England

Performance Relative to Fishery Management Objectives

                   Common to both regions
                   Recreational                                  Social and cultural                                Protected species
                   opportunities                                 (community fishery engagement,                     (coastwide bycatch, population
       OBJECTIVE   (effort and fleet diversity)                  reliance, and environmental justice                numbers, mortalities)
    (INDICATOR)                                                  vulnerability)

                         Effort              Diversity           Status only indicator                                   Bycatch             Populations

        30 YEAR
          TREND

                                                                                                                                    Bycatch
                                                                                                                        Harbor porpoise          Gray seal

                        Effort               Diversity           Environmental justice status for top
                                                                 commercial and recreational
                                                                 communities.                                                  Populations
                                                                                                                           NARW          Gray seal
       CURRENT
        STATUS

                   Relative stability in the overall number of   These indicators are used to identify top          Mixed bycatch trends through 2019 are
                   recreational opportunities in the region.     fishing communities and those with                 related to fishery management, shifts in
                                                                 environmental justice concerns based on            population distribution combined with
                                                                 2019 data. Highlighted communities may             fishery shifts, and population increase for
                                                                 be vulnerable to changes in fishing                gray seals. Bycatch indices were not
   IMPLICATIONS                                                  patterns due to regulations and/or climate         updated because of low observer coverage
                                                                 change. When any of these communities              caused by COVID-19 restrictions.
                                                                 also experience environmental justice              Population drivers for North Atlantic Right
                                                                 issues, they may have lower ability to             Whales (NARW) include combined fishery
                                                                 successfully respond/adapt to change.              interactions/vessel strikes, distribution
                                                                 All communities showing environmental              shifts, and copepod availability.
                                                                 justice concerns score high in the poverty         Unusual mortality events continue for 3
                                                                 index, while some also score high in               large whale species.
                                                                 personal disruption and population
                                                                 composition indices.

                                                                                      Current Status

                                                                                    Below long term       Meeting
                                                                                        average         Objectives

                                                                                                                                                 Trend

                                                                                    Above long term    Near long term
                                                                                       average           average

                                                                                                                                      Increase                No trend

                                                                                                                                       Decline               Mixed trends

                                                                                                                                                                            2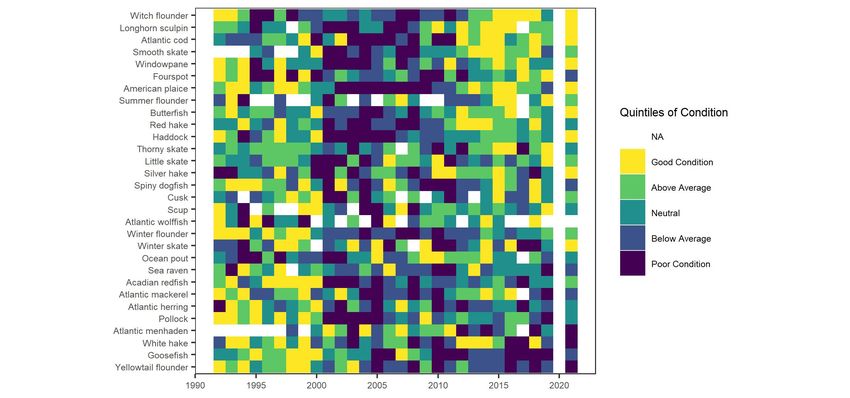
2022 STATE OF THE ECOSYSTEM | New England
Risks to Meeting Fishery Management
Objectives • Fish condition in 2021 was generally above
average on Georges Bank and mixed in the Gulf
Climate and Ecosystem Productivity Risks of Maine.
Climate change, most notably ocean warming and • Aggregate shifts in species distributions and the
changes in the Gulf Stream, continue to affect the appearance of more southern species moving into
New England ecosystem: the Gulf of Maine may cause unexpected species
interactions.
• Seasonal water temperatures rivaled or exceeded
the record high temperatures recorded in 2012.
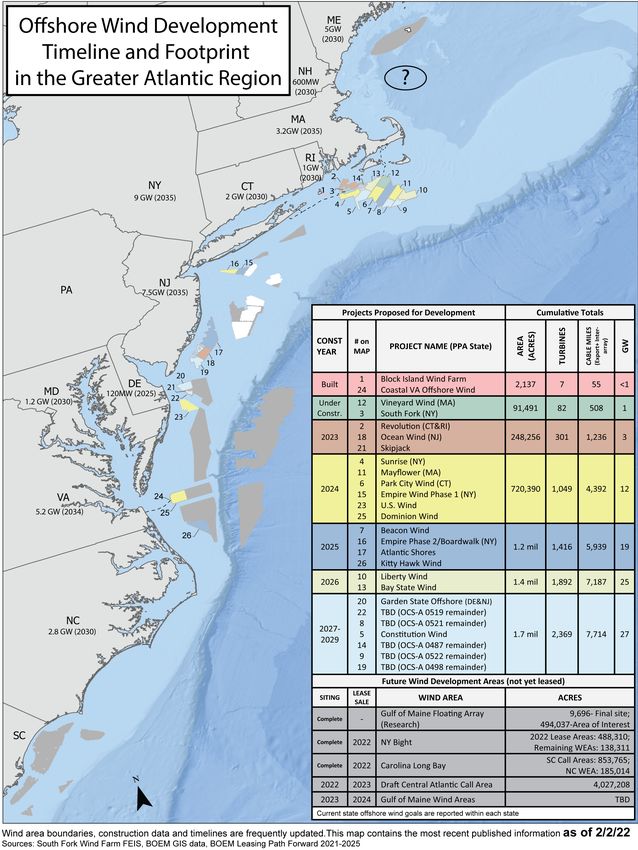
Other Ocean Uses: Offshore Wind Risks
• The region is experiencing more frequent and
intense marine heatwaves. Georges Bank had More than 20 offshore wind development projects
record high heat wave intensity in 2021. are proposed for construction on the Northeast
shelf, covering more than 1.7 million acres by 2030.
• The Gulf Stream is becoming less stable. The
An additional 6 lease areas (488,000 acres) were
northward shift of the Gulf Stream is related to the
recently identified in the New York Bight. If all existing
dominance of warm slope water and little to no
and proposed leases are developed in the Northeast:
Labrador Slope Water entering the Gulf of Maine
through the Northeast Channel. • Rapid buildout according to current development
plans will have greater impact to the Mid-Atlantic
• The Mid-Atlantic cold pool is becoming warmer,
than New England, although some lease areas
smaller, and shorter in duration, which affects
are in RI and MA; floating offshore technologies
habitat for multiple federally managed species.
are likely to be used in Gulf of Maine in the future,
• In 2021, there was no notable spring with anticipated site designations beginning in
phytoplankton bloom in the Gulf of Maine and 2023.
below average summer chlorophyll concentrations
• 2-69% of port revenues from fisheries currently
throughout the region. There was an above
comes from areas proposed for offshore wind
average late fall bloom on Georges Bank, which
development. Some of these communities score
may benefit haddock recruitment.
medium-high to high in environmental justice
concerns and gentrification vulnerability.
• Up to 12% of annual commercial landings and
revenue for major New England species could be
displaced from lease areas.
• Development will affect species differently,
negatively affecting species that prefer soft bottom
habitat while potentially benefiting species that
prefer hard structured habitat.
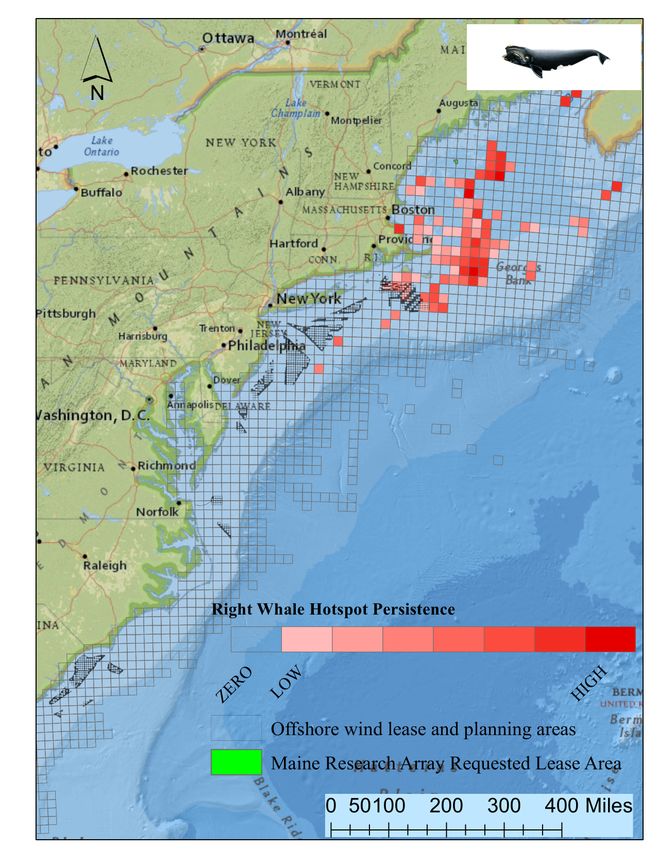
• Planned wind areas overlap with one of the only
known right whale foraging habitats, and altered
local oceanography could affect right whale prey
availability. Development also brings increased
vessel strike risk and the potential impacts of pile
driving noise.
• Evaluating the impacts to scientific surveys has
begun.
3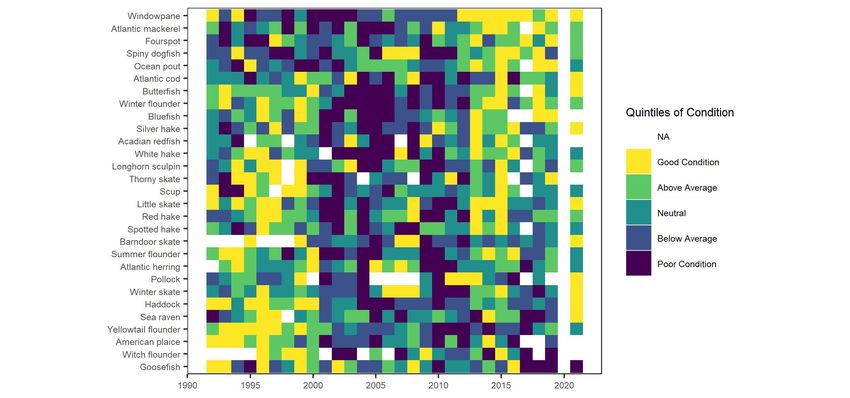
2022 STATE OF THE ECOSYSTEM   | New England

 Characterizing Ecosystem Change

 Multiple System Drivers
          The Northeast shelf
     ecosystem is changing,
          which is affecting the
 services that the ecosystem
    provides. To illustrate how
    multiple factors are driving
        change in this complex
      ecosystem, we are using
  three overarching concepts:
       multiple system drivers,
regime shifts, and ecosystem
      reorganization. Societal,
       biological, physical, and
      chemical factors are the
 multiple system drivers that influence       Regime Shift
 marine ecosystems through a variety of
                                              These drivers affect fishery management
                        different pathways.
                                              objectives such as seafood production and
                                                           recreational opportunities,
                                                           as well as other ecosystem
                                                           services we derive from
                                                           the ocean. Changes in the
                                                           multiple drivers can lead to
                                                           regime shifts — large, abrupt
                                                           and persistent changes in
                                                           the structure and function of
                                                           an ecosystem. Regime shifts
                                                           and changes in how multiple
                                                           system drivers interact
                                                           can result in ecosystem
                                                           reorganization as species
                                                           and humans respond and
                                                           adapt to the new environment.

                                                                                      4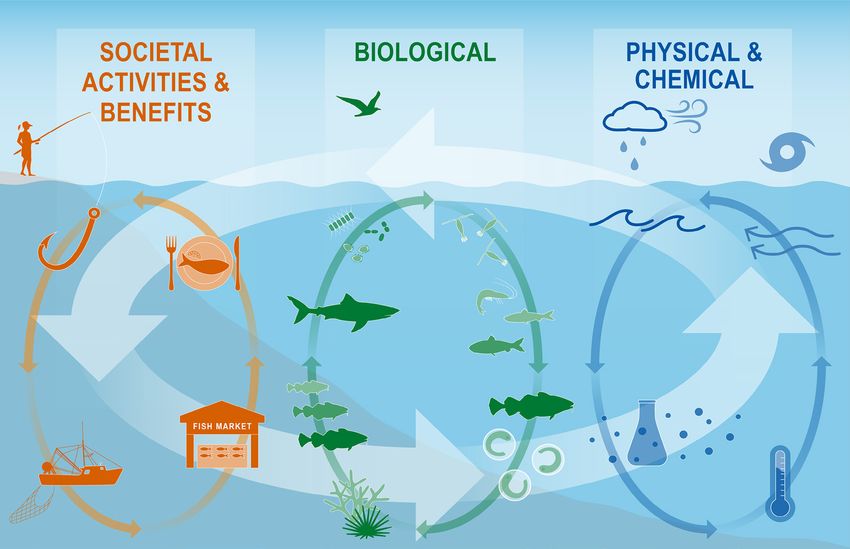
State of the Ecosystem 2022: New England                                                                 April 1, 2022

Introduction
About This Report
This report is for the New England Fishery Management Council (NEFMC). The purpose of this report is to
synthesize ecosystem information to allow the NEFMC to better meet fshery management objectives. The major
messages of the report are summarized on pages 1, 2, and 3, and synthesis themes are illustrated on page 4.
Information in this report is organized into two sections; performance measured against ecosystem-level management
objectives (Table 1), and potential risks to meeting fshery management objectives (climate change and other ocean
uses).

Report structure
The two main sections contain subsections for each management objective or potential risk. Within each subsection,
we frst review indicator trends, and the status of the most recent data year relative to a threshold (if available)
or relative to the long-term average. Second, we synthesize results of other indicators and information to outline
potential implications for management (i.e., connecting indicator(s) status to management and why an indicator(s)
is important). For example, if there are multiple drivers related to an indicator trend, which drivers may be more
or less supported by current information, and which, if any, can be afected by management action(s)? Similarly,
which risk indicators warrant continued monitoring to evaluate whether regime shifts or ecosystem reorganization
are likely? We emphasize that these implications are intended to represent testable hypotheses at present, rather
than “answers,” because the science behind these indicators and syntheses continues to develop.
A glossary of terms1 , detailed technical methods documentation2 and indicator data3 are available online. The
details of standard fgure formatting (Fig. 50a), categorization of fsh and invertebrate species into feeding groups
(Table 4), and defnitions of ecological production units (EPUs, including Georges Bank, GB, and the Gulf of Maine,
GOM; Fig. 50b) are provided at the end of the document.

                         Table 1: Example ecosystem-scale objectives for the New England Region

         Objective Categories           Indicators reported here
         Provisioning/Cultural Services
           Seafood Production  Landings; commercial total and by feeding guild; recreational harvest
           Profts              Revenue decomposed to price and volume
           Recreation          Days fshed; recreational feet diversity
           Stability           Diversity indices (fshery and ecosystem)
           Social & Cultural   Community engagement/reliance status
           Protected Species   Bycatch; population (adult and juvenile) numbers, mortalities
         Supporting/Regulating Services
           Biomass             Biomass or abundance by feeding guild from surveys
           Productivity        Condition and recruitment of managed species, Primary productivity
           Trophic structure   Relative biomass of feeding guilds, Zooplankton
           Habitat             Estuarine and ofshore habitat conditions

Performance relative to fshery management objectives
In this section, we examine indicators related to broad, ecosystem-level fshery management objectives. These
objectives are derived from National legislation as the NEFMC has not formally adopted any ecosystem-level
objectives for management. We also provide hypotheses on the implications of these trends—why we are seeing them,
what’s driving them, and potential or observed regime shifts or changes in ecosystem structure. Identifying multiple
  1 https://noaa-edab.github.io/tech-doc/glossary.html
  2 https://NOAA-EDAB.github.io/tech-doc
  3 https://github.com/NOAA-EDAB/ecodata

                                                           5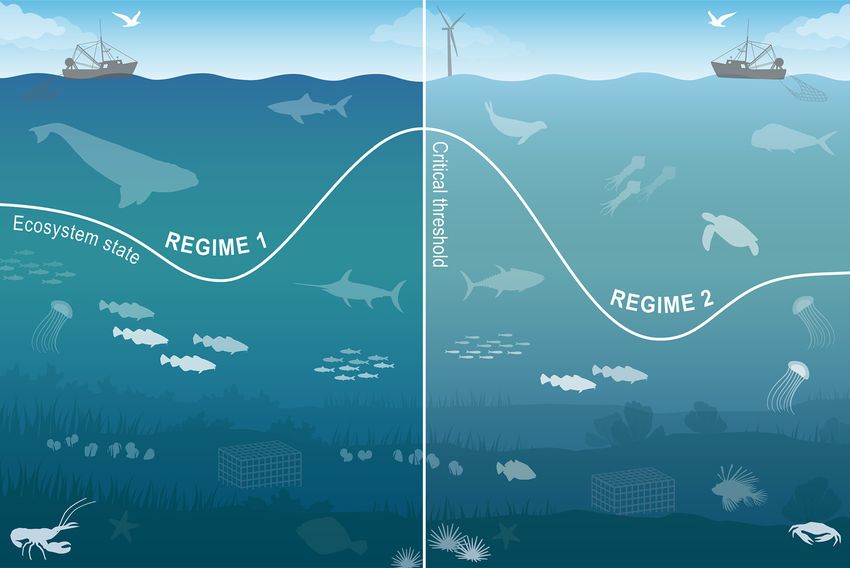
State of the Ecosystem 2022: New England

drivers, regime shifts, and potential changes to ecosystem structure, as well as identifying the most vulnerable
resources, can help managers determine whether we can do anything diferently to meet objectives and how to
prioritize for upcoming issues/risks.
Special note on data availability for the 2022 report
The Catch Accounting and Monitoring System (CAMS) that will be used to provide commercial landings and
discard information at the Ecological Production Unit (EPU) scale is under development. As of February 2022,
our standard indicators relying on EPU scale landings data cannot be calculated for 2020 (commercial seafood
production, commercial profts, ecosystem overfshing). We provide information based on coastwide commercial
landings information available at this time in [1]4 , and will calculate our standard indicators at EPU scales with
disaggregated 2020 commercial landings data when they are available.

Seafood Production
Indicator: Landings; commercial and recreational
Total commercial landings (black) within New England are not yet available for 2020; Figure 1 includes data only
through 2019. However, we do not anticipate the long-term declining trend in landings to change.

 Total Commercial Landings *No New Data
                          Georges Bank                                                                     Gulf of Maine

                    150                                                                              150
 Landings (103mt)

                                                                                  Landings (103mt)

                    100                                                                              100

                     50                                                                               50

                             1990   1995   2000   2005   2010   2015   2020                                   1990   1995   2000   2005   2010   2015   2020

Figure 1: Commercial seafood landings for Georges Bank and the Gulf of Maine through 2019. The red lines are landings
of species managed by the New England Fishery Management Council (NEFMC) while the black lines includes both the
managed species as well as landings of species not managed by the NEFMC. mt = metric tons

Although the data has not been updated for 2020, the long term downward trends in commercial landings for the
Gulf of Maine and Georges Bank identifed in earlier reports are not anticipated to change with the addition of
another year’s worth of data. Coastwide landings for a number of species managed by the NEFMC showed mixed
trends in 2020 when compared to the average landings between 2015 - 2019. Groundfsh landings were above the 5
year average, while monkfsh and scallop landings were down. Although scallop decreases are partially explained by
a decreased TAC, analyses suggest that the drop in landings is at least partially due to market disruptions due to
the COVID-19 pandemic. Lobster landings also decreased in 2020 when compared to the average landings between
2015 - 2019.
Overall, recreational harvest (retained fsh presumed to be eaten) have also declined in New England (Fig. 2).
Recreational harvest in 2020 was the lowest since estimates began.
          4 https://spo.nmfs.noaa.gov/sites/default/fles/TM221.pdf

                                                                              6
State of the Ecosystem 2022: New England

                                                                NE Recreational seafood harvest

                                     Landings (106 lbs)
                                                          100

                                                           75

                                                           50

                                                           25
                                                                   1985   1990   1995   2000    2005   2010    2015    2020

                       Figure 2: Total recreational seafood harvest (millions of pounds) in the New England region.

Recreational shark landings of pelagic and prohibited sharks have increased over the last couple of years (Fig 3).
This is likely infuenced by regulatory changes implemented in 2018 intended to rebuild shortfn mako stocks. In
2021 the International Commission for the Conservation of Atlantic Tunas (ICCAT) fnalized recommendations for
a two-year retention ban (ICCAT Rec.21-09), which will also afect total overall landings of pelagic sharks in coming
years.

                              Recreational Shark Landings
                     200000

                     150000                                                                                                   LargeCoastal
         Catch (N)

                                                                                                                              Pelagic
                     100000
                                                                                                                              Prohibited
                                                                                                                              SmallCoastal
                      50000
                                                                                                                              Unclassified

                          0
                              1980                              1990         2000              2010           2020

                          Figure 3: Recreational shark landings from Marine Recreational Information Program.

Aquaculture production is not yet included in total seafood landings, but we are working toward that in future
reports. Available aquaculture production of oysters for a subset of New England states was showing an increase
in annual production per acre leased until a sharp decline in 2020 caused by the COVID-19 disruptions (Fig. 4).

                                                                  Total Oyster Production in New England
                                     Production/Acre

                                                          80000

                                                          60000

                                                          40000
                                                                  2009    2011      2013       2015    2017     2019

                                 Figure 4: Total oyster production per acre leased for New England states.
                                                                                        7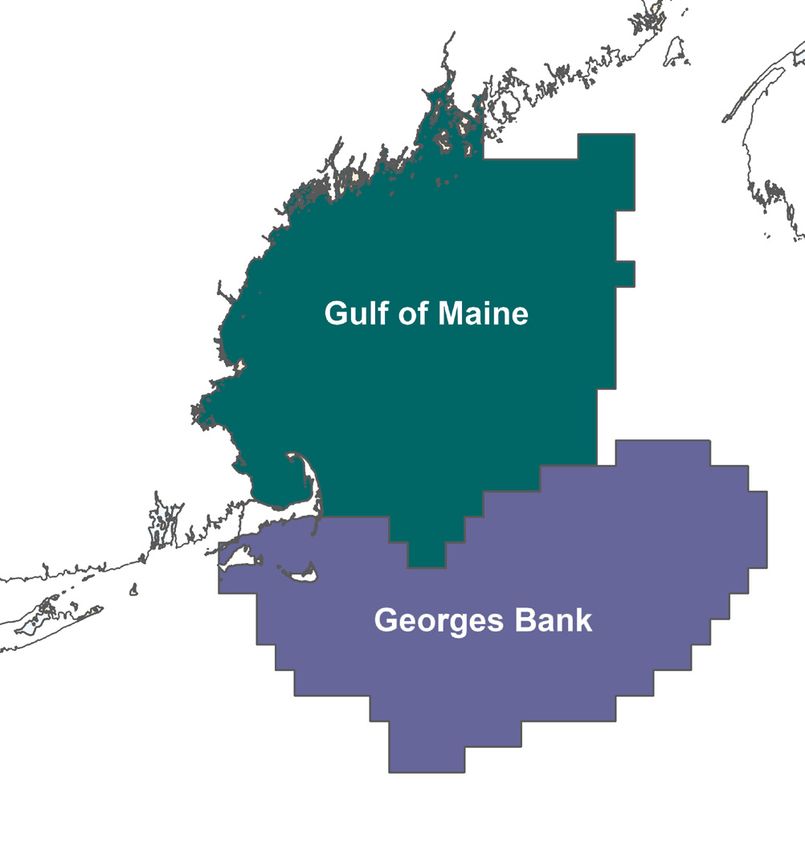
State of the Ecosystem 2022: New England

Implications
Declining commercial and recreational landings can be driven by many interacting factors, including combinations
of ecological and stock production, management actions, market conditions (including COVID-19 disruptions), and
environmental changes. While we cannot evaluate all possible drivers at present, here we evaluate the extent to
which stock status and changes in system biomass play a role.

Stock Status Eight stocks are currently estimated to be below BMSY, while status relative to BMSY could not
be assessed for 13 additional stocks (Fig. 5). Therefore, stock status and associated management constraints are
likely contributing to decreased landings. To better address the role of management in future reports, we could
examine how the total allowable catch (TAC) and the percentage of the TAC taken for each species has changed
through time.

          1.5                                           F missing          B missing     F and B missing
                                                     Barndoor Skate          GB YT            GB Cod
                                                     Clearnose Skate                         GOM Cod
                                                        Little Skate                          Halibut
                                                      Rosette Skate                        N Goosefish
                                                      Smooth Skate                         S Goosefish
                                                                                          Offshore Hake
                                                      Thorny Skate
                                                                                             Red Crab
          1.0                                          Winter Skate                        N Red Hake
                Sp. Dogfish                                                                 S Red Hake
                                                                                          N Windowpane
 F Fmsy

                            White Hake                                                     GOM Winter
                       SNEMA YT S Windowpane                                                   Witch

                Pout
          0.5                    Scallop
                      Herring
                                  Redfish
                GB Winter
                             Plaice
                SNE Winter          CCGOM YT
                                                                                                       GOM Haddock
                                Pollock       GB Haddock
          0.0       S Silver Hake N Silver Hake
                   0                     3                             6                        9
                                                             B Bmsy

Figure 5: Summary of single species status for NEFMC and jointly federally managed stocks (Goosefsh and Spiny dogfsh).
The dotted vertical line is the target biomass reference point of BMSY . The dashed lines are the management thresholds of
BMSY (verticle) or FMSY (horizontal).

System Biomass Aggregate biomass trends derived from scientifc resource surveys have been relatively stable in
both regions (Fig. 6 & Fig. 7). The benthivores group spiked during the last decade, due to haddock recruitment,
but appears to be returning to average levels (although many surveys were not completed in 2020). There are also
increasing trends in piscivores, planktivores, and benthos in at least one season in both regions. While managed
species comprise varying proportions of aggregate biomass, trends in landings are not mirroring shifts in the overall
trophic structure of survey-sampled fsh and invertebrates.

                                                            8
State of the Ecosystem 2022: New England

                               GB NEFSC BTS
 Biomass (kg tow-1)

                                Piscivore Spring                              Piscivore Fall

                      600
                      400
                      200
                        0
                               1970        1980     1990   2000   2010   2020 1970           1980   1990   2000   2010   2020

                                Benthivore Spring                             Benthivore Fall
 Biomass (kg tow-1)

                      400

                      200

                           0
                               1970        1980     1990   2000   2010   2020 1970           1980   1990   2000   2010   2020

                               Planktivore Spring                             Planktivore Fall
 Biomass (kg tow-1)

                      90
                      60
                      30
                       0
                               1970       1980      1990   2000   2010   2020 1970        1980      1990   2000   2010   2020

                               Benthos Spring                                 Benthos Fall
 Biomass (kg tow-1)

                      40
                      30
                      20
                      10
                       0
                               1970       1980      1990   2000   2010   2020 1970        1980      1990   2000   2010   2020

Figure 6: Spring (left) and fall (right) surveyed biomass on Georges Bank. The shaded area around each annual mean
represents 2 standard deviations from the mean.

                                                                         9
State of the Ecosystem 2022: New England
GOM NEFSC BTS
Biomass (kg tow-1)
Piscivore Spring Piscivore Fall
400
300
200
100
0
1970 1980 1990 2000 2010 2020 1970 1980 1990 2000 2010 2020
Benthivore Spring Benthivore Fall
Biomass (kg tow-1)
200
150
100
50
0
1970 1980 1990 2000 2010 2020 1970 1980 1990 2000 2010 2020
Planktivore Spring Planktivore Fall
Biomass (kg tow-1)
40
20
0
1970 1980 1990 2000 2010 2020 1970 1980 1990 2000 2010 2020
Benthos Spring Benthos Fall
Biomass (kg tow-1)
10.0
7.5
5.0
2.5
0.0
1970 1980 1990 2000 2010 2020 1970 1980 1990 2000 2010 2020
Figure 7: Spring (left) and fall (right) surveyed biomass in the Gulf of Maine. The shaded area around each annual mean
represents 2 standard deviations from the mean.
Efect on Seafood Production With the poor or unknown stock status of many managed species, the decline
in commercial landings most likely refects lower catch quotas implemented to rebuild overfshed stocks, as well as
market dynamics.
The decline in recreational seafood landings stems from multiple drivers. Some of the decline, such as for recreational
shark landings, continues to be driven by tightening regulations. However, changes in demographics and preferences
over recreational activities likely play a role in non-HMS (Highly Migratory Species) declines in recreational harvest,
with current harvests the lowest in the time series.
Other environmental changes require monitoring as they may become important drivers of future landings:
• Climate is trending into uncharted territory. Globally, 2021 was the sixth warmest year on record5 with
regional marine heatwaves apparent (see Climate Risks section).
• Stocks are shifting distribution, moving towards the northeastward and into deeper waters throughout the
Northeast US Large Marine Ecosystem (Fig. 8).
• Some ecosystem composition and production changes have been observed (see Stability section).
• Some fshing communities are afected by environmental justice vulnerabilities (see Environmental Justice and
Social Vulnerability section).
5 https://www.climate.gov/news-features/features/2021-global-climate-summary-6th-warmest-year-record
10State of the Ecosystem 2022: New England
Along-shelf distance
Distance (km)
900
850
800
1970 1980 1990 2000 2010 2020
Depth
100
Depth (m)
110
120
1970 1980 1990 2000 2010 2020
Figure 8: Aggregate species distribution metrics for species in the Northeast Large Marine Ecosystem.
Commercial Profts
Indicators: revenue (a proxy for profts)
Total commercial revenues have not been updated for 2020. However, we do not anticipate the long-term declining
trend in revenue from managed species in the GOM to change, as it probably refects declines in quotas and
low allowable catches for stocks with rebuilding plans. Additionally, we know that coastwide a number of species
managed by the NEFMC, as well as lobster, experienced a decline in revenue when compared to the average revenue
generated 2015 - 2019. This decline was driven by a mix of landings declines (monkfsh, lobster, scallops) and price
declines (monkfsh, lobster, scallops, and groundfsh).
Georges Bank *No New Data - ends in 2019 Gulf of Maine *No New Data - ends in 2019
500 500
Revenue (106USD)
Revenue (106USD)
400 400
300
300
200
200
100
100
1990 1995 2000 2005 2010 2015 2020 1990 1995 2000 2005 2010 2015 2020
Figure 9: Revenue through 2019 for the New England region (black) and revenue from NEFMC managed species (red).
Implications
The Bennet indicator evaluating changes in landings volume and price for New England will be updated when 2020
New England landings become available.
The continued dependence on lobster in the GOM and sea scallops on GB is afected by multiple drivers including
11State of the Ecosystem 2022: New England
resource availability and market conditions. As both species are sensitive to ocean warming and acidifcation, it is
important to monitor these and other climate drivers.
Recreational Opportunities
Indicators: Days fshed, feet diversity
Recreational efort (days fshed) increased during 1980-2010, but has since declined to just below the long-term
average (Fig. 10). Recreational feet are defned as either private vessels, shore-based, or party-charter vessels.
Recreational feet diversity, or the relative importance of each feet type, has remained relatively stable over the
latter half of the time series (Fig. 11).
Recreational effort
30
Days fished (106 N)
20
10
1990 2000 2010 2020
Figure 10: Recreational efort in New England.
Rec. fleet effort diversity
2.75
Effective Shannon
2.50
2.25
2.00
1.75
1990 2000 2010 2020
Figure 11: Recreational feet efort diversity in New England.
Implications
The absence of a long term trend in recreational days fshed and feet efort diversity suggests relative stability in
the overall number of recreational opportunities in the region.
Stability
Indicators: fshery feet and catch diversity, ecological component diversity
While there are many potential metrics of stability, we use diversity indices as a frst check to evaluate overall
stability in fsheries and ecosystems. In general, diversity that remains constant over time suggests a similar
capacity to respond to change over time. A signifcant change in diversity over time does not necessarily indicate
a problem or an improvement, but does indicate a need for further investigation. We examine commercial feet
and species catch diversity, and recreational species catch diversity (with feet efort diversity discussed above), and
diversity in zooplankton, larval and adult fshes.
12State of the Ecosystem 2022: New England
Fishery Diversity Diversity estimates have been developed for feets landing managed species, and species landed
by commercial vessels with New England permits. A feet is defned here as the combination of gear type (Scallop
Dredge, Clam Dredge, Other Dredge, Gillnet, Hand Gear, Longline, Bottom Trawl, Midwater Trawl, Pot, or Purse
Seine) and vessel length category (Less than 30 ft, 30 to 50 ft, 50 to 75 feet, 75 ft and above). Commercial fshery
feet count is at or near the time series low (Fig. 12), although the revenue feet diversity does not show a similar
decline. This suggests that the feets disengaging from the region are those that were historically smaller to start
with.
Fleet count
40
Count (n)
30
20
2000 2005 2010 2015 2020
Fleet diversity in revenue
Effective Shannon
12.5
10.0
7.5
5.0
2000 2005 2010 2015 2020
Figure 12: Fleet count and diversity in New England.
As noted above, recreational feet efort diversity is stable. However, recreational species catch diversity has been
above the time series average since 2008 with a long-term positive trend (Fig. 13). Of note is that, although the
positive trend was not signifcant in the 2021 report, a long-term trend has been reported in the past, indicating
the ephemeral nature of the increase.
Rec. diversity of catch
11
Effective Shannon
10
9
8
7
6
1990 2000 2010 2020
Figure 13: Species revenue diversity in New England.
Ecological Diversity Ecological diversity indices show mixed trends. Up to 2019, zooplankton diversity was
increasing in the GB, while no trend was evident in the GOM (Fig. ??). 2020 surveys were incomplete due to
COVID-19. Zooplankton and larval fsh diversity indicators will be updated once 2021 survey results have been
processed. Adult fsh diversity is measured as the expected number of species in a standard number of individuals
sampled from the NEFSC bottom trawl survey. There is no vessel correction for this metric, so indices collected
13State of the Ecosystem 2022: New England
aboard the research vessel Albatross IV (up to 2008) and the research vessel Henry B. Bigelow (2009 - Present) are
calculated separately (Fig. 15). This metric shows an increasing trend in the GOM with no trends on GB.
GB Zooplankton Diversity GOM Zooplankton Diversity
2.4
Shannon Diversity
Shannon Diversity
2.0
2.1
1.5
1.8
1.0
1980 1990 2000 2010 2020 1980 1990 2000 2010 2020
Figure 14: Zooplankton diversity on Georges Bank and in the Gulf of Maine, based on Shannon diversity index.
Expected Number of Species - Fall
GB GOM
n species per 1000 ind
20
Albatross
Bigelow
10
1970 1980 1990 2000 2010 2020 1970 1980 1990 2000 2010 2020
Figure 15: Adult fsh diversity for Georges Bank and in the Gulf of Maine, based on expected number of species.
Implications
Fleet diversity indices can be used to evaluate stability objectives as well as risks to fshery resilience and to
maintaining equity in access to fshery resources [2]. The relatively low diversity estimates for the commercial
fshery are likely driven by the continued reliance on just a small number of species. This trend could diminish the
capacity to respond to future fshing opportunities. Meanwhile, the increase in recreational species catch diversity
is due to recent increases in ASMFC and MAFMC managed species within the region as well as decreased limits
on more traditional regional species.
Ecological diversity indices can provide insight into ecosystem structure. Changes in ecological diversity over time
may indicate altered ecosystem structure with implications for fshery productivity and management [3]. Increasing
zooplankton diversity through 2019 was driven by the declining dominance of the calanoid copepods Centropages
14State of the Ecosystem 2022: New England
typicus, while the overall abundance of zooplankton species was increasing. Stable adult fsh diversity on GB
suggests the same overall number and evenness over time, but doesn’t rule out species substitutions (e.g., warm-
water species replacing cold-water ones). Increasing adult diversity in the GOM suggests an increase in warm-water
species and should be closely monitored.
As a whole, the examined diversity indicators suggest overall stability in the fsheries and ecosystem components.
However, increasing diversity in the recreational catch, GB zooplankton, and GOM adult fsh suggests warning signs
of a potential regime shift or ecosystem restructuring and warrants continued monitoring to determine if managed
species are afected.
Environmental Justice and Social Vulnerability
Indicators: Environmental Justice and Social Vulnerability in commercial and recreational fshing communities
Social vulnerability measures social factors that shape a community’s ability to adapt to change. A subset of these
can be used to assess potential environmental justice issues. Environmental Justice is defned in Executive Order
12898 as federal actions intended to address disproportionately high and adverse human health and environmental
efects of federal actions on minority and low-income populations. Three of the existing NOAA Fisheries Community
Social Vulnerability Indicators (CSVIs), the Poverty Index, Population Composition Index, and Personal Disruption
Index, can be used for mandated Environmental Justice analysis6 .
Social Vulnerability in Top Commercial Fishing Communities
Low High
6
MedHigh to High
All Others Communities
Commercial Reliance Index
4 Frenchboro, ME
Cranberry Isles, ME
Beals, ME* Stonington, ME*
Matinicus Isle, ME Vinalhaven, ME*
2
Newington, NH*Friendship, ME Chatham, MA*
Port Clyde-Tenants Harbor, ME Portland, ME
Winter Harbor, ME New Bedford, MA
0 Harpswell/Bailey Island, ME Narragansett/Point Judith, RI
Gloucester, MA
Boston, MA
0 10 20 30 40
Commercial Engagement Index
Low High
Figure 16: Commercial engagement, reliance, and environmental justice vulnerability for the top commercially engaged and
reliant fshing communities in New England. Communities ranked medium-high or above for one or more of the environmental
justice indicators are highlighted in bright orange. *Community scored high (1.00 and above) for both commercial engagement
and reliance indicators.
Commercial fshery engagement measures the number of permits and dealers, and pounds and value landed in
a community, while reliance expresses these numbers based on the level of fshing activity relative to the total
population of a community. Recreational fshery engagement measures shore, private vessel, and for-hire fshing
efort while reliance expresses these numbers based on fshing efort relative to the population of a community.
6 https://www.fsheries.noaa.gov/national/socioeconomics/social-indicators-coastal-communities
15State of the Ecosystem 2022: New England
In 2021, we reported the top ten most engaged, and top ten most reliant commercial and recreational fshing
communities and their associated social vulnerability. Here we apply the same selection standard for top ten fshing
communities for both sectors, and focus on examining the environmental justice vulnerability in these communities.
Communities plotted in the upper right section of Fig.16 scored high for both commercial engagement and reliance,
including Chatham, MA; Newington, NH; Stonington, Vinalhaven, and Beals, ME. Communities that ranked
medium-high or above for one or more of the environmental justice indicators are highlighted in bright orange: New
Bedford and Boston, MA; and Cranberry Isle, ME.
Fig. 17 shows the detailed scores of the three environmental justice indicators for the same communities plotted
in Fig.16. Communities are plotted clockwise in a descending order of commercial engagement scores from high
to low, with the most highly engaged community, New Bedford, MA, listed on the top. Among the communities
ranked medium-high or above for environmental justice vulnerability, New Bedford, MA scored high for the poverty
index, and medium-high for personal disruption and population composition indices. Boston scored medium-high
for personal disruption index and poverty index. Cranberry Isle scored high for the poverty index.
Figure 17: Environmental justice indicators (Poverty Index, population composition index, and personal disruption index)
for top commercial fshing communities in New England. *Community scored high (1.00 and above) for both commercial
engagement and reliance indicators.
No communities in New England scored high for both recreational engagement and reliance (Fig.18). All of the
top recreational communities scored lower than medium-high for all of the three environmental justice indicators,
meaning that environmental justice may not be a major concern in these communities at this time, based on this
particular analysis.
Fig. 19 orders communities clockwise in a descending order of recreational engagement scores from high to low,
with the most highly engaged community, Narragansett/Point Judith, RI, listed on the top. Narragansett/Point
Judith, like all of these top recreational communities ranked low for environmental justice vulnerability. In fact,
the scores below 0 for all three environmental justice indicators implies a lower than average level of vulnerability,
based on recreational engagement and reliance, among the communities included in the analysis.
16State of the Ecosystem 2022: New England
Environmental Justice in Top Recreational Fishing Communities
Low High
1.00
All Others Communities
Recreation Reliance Index
0.75
0.50
Dennis, MA
Bourne, MA
0.25 Harwich Port, MA
Truro, MA
Clinton, CT Charlestown, RI
New Shoreham, RI
Seabrook, NH Old Saybrook, CT Narragansett/Point Judith, RI
0.00 Newington, NH Newburyport, MA
Falmouth, MA Hampton, NH
Sandwich, MA Barnstable Town, MA
0 1 2 3 4
Recreation Engagement Index
Low High
Figure 18: Recreational engagement and reliance, and environmental justice vulnerability, for the top recreationally engaged
and reliant fshing communities in New England. None of these communities ranked medium-high or above for one or more
of the environmental justice indicators.
Figure 19: Environmental justice indicators (Poverty Index, population composition index, and personal disruption index)
for top recreational fshing communities in New England. *Community scored high (1.00 and above) for both commercial
engagement and reliance indicators.
17State of the Ecosystem 2022: New England
Both commercial and recreational fshing are important activities in Narragansett/Point Judith, RI and Newing-
ton, NH, meaning these communities may be impacted simultaneously by commercial and recreational regulatory
changes. Both of these communities currently score low for all of the three environmental justice indicators, indi-
cating that environmental justice may not be a major concern in these communities at the moment based on the
indicators analyzed.
Implications
These plots provide a snapshot of the presence of environmental justice issues in the most highly engaged and
most highly reliant commercial and recreational fshing communities in New England. These communities may be
vulnerable to changes in fshing patterns due to regulations and/or climate change. When any of these communities
are also experiencing social vulnerability including environmental justice issues, they may have lower ability to
successfully respond to change.
Protected Species
Protected species include marine mammals protected under the Marine Mammal Protection Act, endangered and
threatened species protected under the Endangered Species Act, and migratory birds protected under the Migra-
tory Bird Treaty Act. In the Northeast U.S., endangered/threatened species include Atlantic salmon, Atlantic and
shortnose sturgeon, all sea turtle species, and fve baleen whales. Fishery management objectives for protected
species generally focus on reducing threats and on habitat conservation/restoration. Here we report on the sta-
tus of these actions as well as indicating the potential for future interactions driven by observed and predicted
ecosystem changes in the Northeast U.S. region. Protected species objectives include managing bycatch to remain
below potential biological removal (PBR) thresholds, recovering endangered populations, and monitoring unusual
mortality events (UMEs).
Indicators: bycatch, population (adult and juvenile) numbers, mortalities
As of 2019, rolling 5 year average bycatch indices for both harbor porpoise and gray seal bycatch were below current
PBR thresholds, thus meeting management objectives. However, the 2019 bycatch estimate for gray seals was the
highest in the time series and above PBR for that year (see 2021 report7 ). Bycatch indices were not updated
because of low 2020 observer coverage caused by COVID-19 restrictions.
The North Atlantic right whale population was on a recovery trajectory until 2010, but has since declined (Fig. 20).
Reduced survival rates of adult females and diverging abundance trends between sexes have also been observed. It
is estimated that there are fewer than 100 adult females remaining in the population.
NARW abundance
450
Abundance (n)
400
350
300
250
1990 2000 2010 2020
Figure 20: Estimated North Atlanic right whale abundance on the Northeast Shelf.
7 https://repository.library.noaa.gov/view/noaa/29525
18State of the Ecosystem 2022: New England
North Atlantic right whale calf counts have generally declined after 2009 to the point of having zero new calves
observed in 2018 (Fig. 21). However, seven new calves were born in 2019, 10 were born in 2020, and preliminary
2021 observations of 18 calves have been recorded as of January 2022..
NARW calf abundance
40
30
Abundance (n)
20
10
0
1990 2000 2010 2020
Figure 21: Number of North Atlantic right whale calf births, 1990 - 2019.
This year, the Unusual Mortality Event (UME) for North Atlantic right whales continued. Since 2017, the total
UME right whale mortalities includes 34 dead stranded whales, 13 in the US and 21 in Canada. When alive but
seriously injured whales (16) are taken into account, 50 individual whales are included in the UME. During 2020,
two mortalities were documented, however, recent research suggests that many mortalities go unobserved and the
true number of mortalities are about three times the count of the observed mortalities [4]. The primary cause of
death is “human interaction” from entanglements or vessel strikes8 .
Two additional UMEs continued from previous years for humpback whales and minke whales; suspected causes
include human interactions and/or infectious disease. A UME for both gray and harbor seals was declared from
2018-2020 due to a high number of mortalities thought to be caused by phocine distemper virus, but is pending
closure as of January 20229 .
Implications
Bycatch management measures have been implemented to maintain bycatch below PBR thresholds. The downward
trend in harbor porpoise bycatch can also be due to a decrease in harbor porpoise abundance in US waters, reducing
their overlap with fsheries, and a decrease in gillnet efort. The increasing trend in gray seal bycatch may be related
to an increase in the gray seal population (U.S. pup counts).
The number of gray seals in U.S. waters has risen dramatically in the last three decades. Based on a survey
conducted in 2016, the size of the gray seal population in the U.S. during the breeding season was approximately
27,000 animals, while in Canada the population was estimated to be roughly 425,000. A survey conducted in 2021
in both countries will provide updated estimates of abundance. The population in Canada is increasing at roughly
4% per year, and contributing to rates of increase in the U.S., where the number of pupping sites has increased
from 1 in 1988 to 9 in 2019. Mean rates of increase in the number of pups born at various times since 1988 at
four of the more data-rich pupping sites (Muskeget, Monomoy, Seal, and Green Islands) ranged from no change on
Green Island to high rates of increase on the other three islands, with a maximum increase of 26.3% (95%CI: 21.6 -
31.4%; [5] Fig. 22). These high rates of increase provide further support for the hypothesis that seals from Canada
are continually supplementing the breeding population in U.S. waters.
8 https://www.fsheries.noaa.gov/national/marine-life-distress/2017-2022-north-atlantic-right-whale-unusual-mortality-event
9 https://www.fsheries.noaa.gov/national/marine-life-distress/active-and-closed-unusual-mortality-events
19State of the Ecosystem 2022: New England
Estimated Gray Seal Pup Births
Green Monomoy
200
2000
100
1000
0
-100 0
Pup Count
2000 2010 2020 1990 2000 2010 2020
Muskeget Seal
2000
6000 1500
4000 1000
2000 500
0
0
1990 2000 2010 2020 2000 2010 2020
Figure 22: Estimated mean rates of increase (solid line) and CIs (shaded area) in number of gray seal pups born at four
United States pupping colonies at various times from 1988 to 2019. From Wood et al. 2019
Strong evidence exists to suggest that interactions between right whales and both the fxed gear fsheries in the U.S.
and Canada and vessel strikes in the U.S. are contributing substantially to the decline of the species [6]. Further,
right whale distribution has changed since 2010. New research suggests that recent climate driven changes in ocean
circulation have resulted in right whale distribution changes driven by increased warm water infux through the
Northeast Channel, which has reduced the primary right whale prey (Calanus fnmarchicus) in the central and
eastern portions of the Gulf of Maine [6–8]. Additional potential stressors include ofshore wind development,
which overlaps with important habitat areas used year-round by right whales, including mother and calf migration
corridors and foraging habitat [9]. This area is also the only known right whale winter foraging habitat. Additional
information can be found in the ofshore wind section [10].
The UMEs are under investigation and are likely the result of multiple drivers. For all three large whale UMEs,
human interaction appears to have contributed to increased mortalities, although investigations are not complete.
An investigation into the cause of the seal UME so far suggests phocine distemper virus as a potential cause.
A climate vulnerability assessment is currently underway for Atlantic and Gulf of Mexico marine mammal popula-
tions and will be reported on in future versions of this report.
20State of the Ecosystem 2022: New England
Risks to meeting fshery management objectives
Climate and Ecosystem Productivity
Large scale climate related changes in the ecosystem can lead to changes in important habitats and ecological
interactions, potentially resulting in regime shifts and ecosystem reorganization.
Climate Change Indicators: ocean temperatures, heatwaves, currents, acidifcation
Ocean temperature and salinity Ocean temperatures continue to warm at both the surface (Fig. 23) and bottom
(Fig. 24) throughout the Northeast Shelf including New England. Seasonal sea surface temperatures in 2021 were
above average throughout the year, with some seasons rivaling or exceeding the record warm temperatures observed
in 2012.
SST anomaly (2021)
Winter Spring
45°N
44°N
43°N
42°N
41°N
Temp.
40°N Anomaly (C)
>4
39°N
Latitude
2
Summer Fall
45°N
0
-2
44°NState of the Ecosystem 2022: New England
Bottom Temperature Anomaly
Georges Bank Gulf of Maine
2 2
Temperature Anomaly (C)
Temperature Anomaly (C)
1 1
0 0
-1 -1
1980 1990 2000 2010 2020 1980 1990 2000 2010 2020
Figure 24: Annual Georges Bank and Gulf of Maine bottom temperature anomalies. (black = observations, red = reanalysis)
Marine heatwaves A marine heatwave is a warming event that lasts for fve or more days with sea surface tem-
peratures warmer than 90% of previously observed (1982-2011) temperatures for that date [11]. Marine heatwaves
measure not just high temperature, but how long the ecosystem is subjected to the high temperature. They are
driven by both atmospheric and oceanographic factors and can have dramatic impacts on marine ecosystems.
The region is experiencing more frequent marine heatwaves over the last decade, including 2021, compared to the
historical period.
Georges Bank experienced six distinct marine heatwaves throughout all seasons in 2021, which included the warmest
event on record. This record event began on May 27th and lasted 39 days (Fig. 25). Relative to prior years, this
marine heatwave ranked 1st on record in terms of maximum intensity (+4.50 ◦ C above average on July 1st ) and
13th on record in terms of cumulative intensity (98 ◦ C-days) (Fig 26). The strongest four marine heatwaves on
record in Georges Bank occurred over the last fve years (2015, 2016, 2020, 2021).
GB Marine Heatwaves 2021
Climatology
20
Temperature (C)
Temperature
Threshold
15
10
5
Jan Feb Mar Apr May Jun Jul Aug Sep Oct Nov Dec
Figure 25: Marine heatwave events (red shading above black line) on Georges Bank occuring in 2021.
22State of the Ecosystem 2022: New England
Georges Bank
Cumulative Intensity (degree C x days) Maximum Intensity (degree C)
4
400
3
200
2
0
1990 2000 2010 2020 1990 2000 2010 2020
Figure 26: Marine heatwave cumulative intensity (left) and maximum intensity (right) on Georges Bank.
The Gulf of Maine experienced marine heatwaves over 80% of the year in 2021. Six distinct marine heatwaves
occurred throughout all seasons with the strongest event beginning on June 6th and lasted 28 days (Fig 27).
Relative to prior years, this marine heatwave ranked 8th on record in terms of maximum intensity (+3.81 ◦ C
above average on June 29th ). The marine heatwave that began on September 7th currently ranks 6th in cumulative
intensity (200 ◦ C-days) (Fig 28). This marine heatwave continued throughout December.
GOM Marine Heatwaves 2021
20 Climatology
Temperature (C)
Temperature
15 Threshold
10
5
Jan Feb Mar Apr May Jun Jul Aug Sep Oct Nov Dec
Figure 27: Marine heatwave events (red shading above black line) in the Gulf of Maine occuring in 2021.
Gulf of Maine
Cumulative Intensity (degree C x days) Maximum Intensity (degree C)
600
Heatwave Intensity
4
400
3
200
2
0
1990 2000 2010 2020 1990 2000 2010 2020
Figure 28: Marine heatwave cumulative intensity (left) and maximum intensity (right) in the Gulf of Maine.
23State of the Ecosystem 2022: New England
Ocean currents and features Variability of the Gulf Stream is one of the major drivers of changes in the oceano-
graphic conditions of the Slope Sea and subsequently the Northeast U.S. continental shelf [12]. Changes in the Gulf
Stream and Slope Sea can afect large-scale climate phenomena as well as local ecosystems and coastal communities.
During the last decade, the Gulf Stream has become less stable and shifted northward [13,14] (Fig. 29). A more
northern Gulf Stream position is associated with warmer ocean temperature on the northeast shelf [15], a higher
proportion of Warm Slope Water in the Northeast Channel, and increased sea surface height along the U.S. east
coast [16].
Gulf Stream Index
Gulf Stream position anomaly
2
1
0
-1
-2
1960 1980 2000 2020
Figure 29: Index representing changes in the location of the Gulf Stream north wall. Positive values represent a more
northerly Gulf Stream position.
In 2019, we also observed the second lowest proportion of Labrador Slope Water entering the Gulf of Maine since
1978 (Fig. 30). The changing proportions of source water afect the temperature, salinity, and nutrient inputs to
the Gulf of Maine ecosystem.
Slopewater Proportions in NE Channel
Percent of Total Slopewater
100
75
Origin
50 WSW
LSW
25
0
1980 1990 2000 2010 2020
Figure 30: Proportion of Warm Slope Water (WSW) and Labrador slope water (LSLW) entering the GOM through the
Northeast Channel.
Since 2008, the Gulf Stream has moved closer to the Grand Banks, reducing the supply of cold, fresh, and oxygen-
rich Labrador Current waters to the Northwest Atlantic Shelf [17]. Nearly every year since 2010, warm slope water
made up more than 75% of the annual slope water proportions entering the Gulf of Maine. In 2017 and 2019, almost
no cooler Labrador Slope water entered the Gulf of Maine through the Northeast Channel (Fig. 30). The changing
proportions of source water afect the temperature, salinity, and nutrient inputs to the Gulf of Maine ecosystem.
In 2021, warm slope water continued to dominate (86.1%) inputs to the Gulf of Maine. The 2022 position of the
north wall of the Gulf Stream is forecasted to be similar to 2021 [18], extending this pattern.
The increased instability of the Gulf Stream position and warming of the Slope Sea may also be connected to the
24State of the Ecosystem 2022: New England
regime shift increase in the number of warm core rings formed annually in the Northwest Atlantic [12,19] (Fig. 31).
Timing of ring formation may also be changing. In 2021, a remarkable number of rings were observed simultaneously
near the shelf break in June. When warm core ring water moves onto the continental shelf, it can alter the habitat
and disrupt seasonal movements of fsh [20].
Warm Core Rings
40
Warm Core Ring Births
30
20
10
1980 1990 2000 2010 2020
Figure 31: Warm core ring formation on the Northeast U.S. Shelf: Annual number of rings (left) and June 2021 rings (right),
where the black line is the 200 m isobath (the shelf break) and the red lines are the 20 and 24 degree isotherms.
When warm core rings and eddies interact with the continental slope they can transport warm, salty water to the
continental shelf [21], and this is now happening more frequently [20,22]. These interactions can be signifcant
contributors to marine heatwaves along the continental shelf [21,23] as well as the movement of shelf-break species
inshore [20,24,25].
Changes in ocean temperature and circulation alter habitat features such as the seasonal cold pool, a 20–60 m
thick band of cold, relatively uniform near-bottom water that persists from spring to fall over the mid and outer
shelf of the Mid-Atlantic Bight and southern fank of Georges Bank [26,27]. It is a reservoir of nutrients that feeds
phytoplankton productivity, is essential fsh spawning and nursery habitat, and afects fsh distribution and behavior
[26,28]. The average temperature of the cold pool is getting warmer over time [29,30], the area is getting smaller
[31], and the duration is getting shorter (Fig. 32).
Colder
2 Longer Larger
0
Cold Pool Index (x(-1))
1
Spatial Extent Index
Persistence Index
0
0
-100
-1 -1
-200
-2
Warmer Shorter Smaller
1970 1990 2010 1970 1990 2010 1970 1990 2010
Figure 32: Seasonal cold pool indices: mean temperature within the cold pool, cold pool persistence, and spatial extent.
Ocean Acidifcation Ocean acidifcation (OA) has caused measured declines in global ocean pH. On the Northeast
Shelf, summer bottom pH (2007-2021) varied spatially and temporally, ranging from 7.69-8.07 (Fig. 33, left panel).
The lowest pH values were recorded in the Gulf of Maine. In summer 2021, water column pH ranged from 7.72-8.18
(Fig. 33, right panel) in the Gulf of Maine. The highest values occurred at the surface and decreased with depth,
reaching minimum values in the deeper waters (below 200 m) of Jordan and Wilkinson Basins.
25State of the Ecosystem 2022: New England
Figure 33: Left: Summer bottom pH collated from all quality-controlled vessel- and glider-based measurements from 2007-
2021. Right: Glider-based pH profles collected during summer 2021 in the Gulf of Maine.
Ecosystem Productivity Indicators: phytoplankton, zooplankton, forage fsh, fsh condition
Phytoplankton Phytoplankton support the food web as the primary food source for zooplankton and flter feeders
such as shellfsh. Numerous environmental and oceanographic factors interact to drive the abundance, composition,
spatial distribution, and productivity of phytoplankton. In 2021, phytoplankton biomass (measured as chlorophyll
a concentration) was above average in winter, but below average during the typical spring bloom period in both
Georges Bank and Gulf of Maine. Summer concentrations were also low, but there was an anomalously high fall
bloom (Fig. 34). Primary productivity (the rate of photosynthesis) was above average during the winter bloom
and well above average on Georges Bank during the summer (Fig. 35).
Chlorophyll a
GB GOM
3
2
mg m^-3
1
0
Jan. Mar. May July Oct. Dec. Jan. Mar. May July Oct. Dec.
Figure 34: Weekly chlorophyll concentrations on Georges Bank and in the Gulf of Maine are shown by the colored line for
2021. The long-term mean is shown in black and shading indicates +/- 1 sample SD.
26State of the Ecosystem 2022: New England
Primary Production
GB GOM
1.5
gC m^-2 d^-1
1.0
0.5
Jan. Mar. May July Oct. Dec. Jan. Mar. May July Oct. Dec.
Figure 35: Weekly primary productivity on Georges Bank and in the Gulf of Maine are shown by the colored line for 2021.
The long-term mean is shown in black and shading indicates +/- 1 sample SD.
The seasonal cycle of size distribution of phytoplankton shows that the spring and fall bloom periods are dominated
by larger-celled microplankton, while smaller-celled nanoplankton dominate during the warmer summer months.
The proportion of the smallest phytoplankton, picoplankton (0.2-2 microns), are relatively constant throughout the
year. In 2021, microplankton proportions were above average during the winter and fall bloom periods, but below
average for the summer months in both Georges Bank and the Gulf of Maine (Fig. 36).
Phytoplankton Size Class
Georges Bank Gulf of Maine
100
75
Percent
50
25
0
n
b
ar
M r
ay
n
l
g
p
n
l
ct
ov
ec
b
ar
r
ay
n
g
p
ct
ov
ec
Ju
Ju
Ap
Ap
Ja
Fe
Ju
Au
Se
Ja
Fe
Ju
Au
Se
O
O
M
M
N
D
M
N
D
Picoplankton Nanoplankton Microplankton
Figure 36: The annual climatology (1998-2020) percent composition of the phytoplankton size classes on Georges Bank and
Gulf of Maine based on satellite observations in the shaded portions. The 2021 proportions for the microplankton (>20
microns, green) and nanoplankton (2-20 microns, orange) are shown in the bold lines.
Zooplankton While zooplankton indicators could not be updated for this report due to 2020 survey disruptions
and lags in sample processing, data up to 2019 showed long-term increasing trends of gelatinous zooplankton and
krill on the northeast shelf (see 2021 report10 ). Preliminary 2021 observations found the total volume of plankton
caught in the bongo net was signifcantly greater than the previous years due to increased gelatinous zooplankton,
predominantly salps (Thalia democratica). Unusually high concentrations of salps were found throughout the
Northeast shelf and in the Slope Sea during other summer 2021 scientifc surveys, which may be associated with
10 https://repository.library.noaa.gov/view/noaa/29525
27You can also read