Semi-open landscapes of former military training areas are key habitats for threatened birds - Tuexenia.de
←
→
Page content transcription
If your browser does not render page correctly, please read the page content below

Tuexenia 41: 273–297. Göttingen 2021.
doi: 10.14471/2021.41.006, available online at www.tuexenia.de

Semi-open landscapes of former military training areas are
 key habitats for threatened birds
 Halboffene Landschaften ehemaliger militärischer Übungsplätze sind
 wichtige Lebensräume für gefährdete Vogelarten

 Heike Culmsee1, 2 * , Boris Evers3, Tobias Leikauf3 & Karsten Wesche4, 5, 6
 1
 State Agency for Environment, Nature Conservation and Geology Mecklenburg Western Pomerania,
 Department of Nature Conservation and Natural Parks, Goldberger Str 12b, 18273 Güstrow,
 Germany; 2Plant Ecology and Ecosystems Research, Albrecht-von-Haller Institute for Plant Sciences,
 University of Göttingen, Untere Karspüle 2, 37073 Göttingen, Germany; 3DBU Natural Heritage,
 German Federal Environmental Foundation, An der Bornau 2, 49090 Osnabrück, Germany;
 4
 Senckenberg Museum of Natural History Görlitz, PB 300 154, 02806 Görlitz, Germany;
 5
 International Institute Zittau, Technische Universität Dresden, Markt 23, 02763 Zittau, Germany;
 6
 German Centre for Integrative Biodiversity Research (iDiv) Halle-Jena-Leipzig, Deutscher Platz 5e,
 04103 Leipzig, Germany
 *Corresponding author, e-mail: heike.culmsee@lung.mv-regierung.de

 Abstract
 Military training areas (MTAs) show high numbers of rare and threatened species and diverse habi-
tat patterns due to low nitrogen input and heterogeneous disturbance dynamics caused by military
training activities that produce fine-scale landscape mosaics. Since the 1990s, major parts of MTAs in
Europe have been decommissioned. In Germany, most of them were transferred to the national natural
heritage now facing the challenge of developing comprehensive conservation management strategies. In
order to elucidate their current conservation value in terms of habitat patterns and associated breeding
birds we selected 14 former MTAs (c. 200 km²). We defined semi-open landscapes as sparsely wooded
(> 20−46% wood cover) to densely wooded (> 46−68%) transition zones between open land and for-
ests. Out of 6,476 breeding bird territories in total, the guild of birds associated with semi-open land-
scapes was exceptionally large, accounting for 61% of the total and 71% of all threatened birds, while
the total semi-open area made up only 28% of the study areas. Six selected keystone species (Anthus
trivialis, Caprimulgus europaeus, Emberiza citronella, Lanius collurio, Lullula arborea, and Sylvia
nisoria) depended on different species-specific key resources (optimal wood cover, single or combina-
tion of habitat types). We concluded that preserving/restoring such semi-open landscapes requires
large-scale management approaches towards mosaics of different successional stages or structural
elements with varying wood cover and associated habitat types, and should be adapted to the desired
keystone species. Promoting combined open land/woodland management of semi-open landscapes
should become a policy priority for adapting EU Common Agricultural Policy (CAP) to the needs of
bird conservation.
Keywords: European Birds Directive, habitat mapping, Red List of threatened species, succession
Erweiterte deutsche Zusammenfassung am Ende des Artikels

Manuscript received 31 January 2021, accepted 06 June 2021
Published online 31 October 2021
Co-ordinating Editor: Martin Diekmann 273

1. Introduction
 Military training areas (MTAs) may harbour an unusually high biodiversity (AYCRIGG et
al. 2015) and large numbers of threatened species (WARREN et al. 2007, REIF et al. 2011,
ČÍŽEK et al. 2013). The European Commission’s Natura 2000 program recognised the
importance of MTAs for the conservation of threatened habitats and rare and endangered
species (GAZENBEEK 2005). Their high biodiversity values are related to heterogeneous
disturbance regimes generated by military training that produces mixtures of regularly and
heavily disturbed, irregularly disturbed and largely untouched portions of MTAs, resulting in
unique and highly dynamic fine-scale landscape patterns (WARREN et al. 2007). These large-
ly resemble traditional land-use forms in historical central European landscapes, which had
originally been maintained by extensive management with low nitrogen input and high tem-
poral and spatial variation of disturbance, creating a fine-grained mosaic of habitats (WAR-
REN et al. 2007, BUŠEK & REIF 2017). That contrasts with the majority of modern cultural
landscapes in Europe where, due to specialisation in agricultural production and simplifica-
tion of cropping systems (STOATE et al. 2009), disturbances usually occur in relatively large
areas in a homogeneous fashion of constant frequency, intensity, and periodicity of human
impact.
 Since 1989, about 1.5 million ha of MTAs have been decommissioned due to interna-
tional disarmament agreements in a unified Europe on both sides of the former Iron Curtain
(ELLWANGER & REITER 2019). In Central Europe, open habitats like grasslands, heathlands,
and inland dunes of the atlantic and continental biogeographical regions, reported as habitat
types of Annex I of the European Habitats Directive (92/43/EEC), are located almost exclu-
sively in both actively used and decommissioned MTAs (GAZENBEEK 2005, ELLWANGER &
REITER 2019). However, particularly pioneer plant communities, such as dry acidic grass-
lands, dramatically decreased for the benefit of later successional stages after the abandon-
ment of MTAs (JENTSCH et al. 2009). To halt this decline, in Germany, 120,000 ha of
decommissioned MTAs of high conservation value became part of the national natural herit-
age scheme (BMU 2017). Since 2009, this land was transferred to become private property
of environmental foundations and conservation organisations. Although major efforts were
made for conserving biodiversity (e.g., SCHULZE et al. 2015, LORENZ et al. 2016), the new
land owners still face the challenges of keeping land open under the situation of often heavy
ammunition loads and of substituting the disturbance regimes on former MTAs by re-
establishing dynamic small-scale, semi-open landscape patterns by civil measures (ELL-
WANGER & REITER 2019). Implementing such an alternative management requires compre-
hensive knowledge of the dependency of target species on the specific forms of suitable
landscapes that need to be maintained or restored.
 In this study, we used the guild of birds associated with semi-open habitats as target
species assemblage for the management of decommissioned MTAs transferred to the nation-
al natural heritage. Typical representatives of the semi-open bird guild are European Nightjar
(Caprimulgus europaeus), Red-backed Shrike (Lanius collurio), and Woodlark (Lullula
arborea). Birds are highly valuable indicators of biodiversity, because they represent various
trophic levels including top parts of food chains. They are widespread, diverse, and mobile,
and they are sensitive to anthropogenic changes over short time-scales (GREGORY &
VAN STRIEN 2010). There have been various approaches to select indicator species among
birds. First, rare species may be disproportionately vulnerable to extinction and have thus
dominated lists of species of conservation priority (GASTON 2008). In Europe, however,
common birds are currently declining more rapidly than rare species (INGER et al. 2015), and

274

population sizes of common species may be important indicators of the overall quality of
the habitats in which they occur (GASTON 2008). Therefore, from the conservation perspec-
tive, not rarity alone should be considered but, in addition, the threat situation in which we
find common species. Second, along a generalist-specialist gradient (JULLIARD et al. 2006),
specialist species restricted to a relatively narrow ecological niche are often regarded as
better indicators (GREGORY & VAN STRIEN 2010). Nevertheless, again, from the conservation
perspective, bird species specialised in a certain habitat type may be of least concern if the
abundance and distribution of the habitat type remains stable. Availability of sites within the
respective niche seems then to be more important than niche breadth (GREGORY & GASTON
2000). As fine-scale mosaics of open habitats and different successional stages have become
rare resources outside of protected areas and MTAs (STOATE et al. 2009, EGGERS et al.
2010), we therefore assume that they represent habitats suitable for threatened species.
 In Germany, comprehensive management strategies for maintaining the high level of
biodiversity values on decommissioned MTAs that were transferred to the national natural
heritage scheme are still missing (ELLWANGER & REITER 2019), although land owners make
great efforts to manage open habitats. This is particularly true for threatened bird species that
often depend not only on a specific habitat type but on the availability of multiple resources
in a mosaic of habitats. The composition of habitat types in a landscape (complexity) and the
physiognomic or spatial arrangement of those habitats (configuration) are two essential
features required to describe any landscape (DUNNING et al. 1992). From the perspective of
our target bird species (organism-centred), we might define landscape as an area of land
containing a mosaic of habitat patches, within which a particular “focal” habitat or resource
patch is embedded (DUNNING et al. 1992, MCGARIGAL 2015). Because suitable habitat or
resource patches can only be defined relative to a particular bird’s perception and scaling of
the environment (WIENS 1976), landscape size would differ among organisms. Accordingly,
we may examine landscapes from two perspectives: First, if the territory actually occupied
by a breeding bird is known, the mosaic of habitat or resource patches within the organism’s
normal home range can be inspected (hereafter: territory-based landscape analysis). Second,
for identifying the parts of a landscape that might be occupied by the target species or spe-
cies assemblage (habitat guild), the overall distribution of the suitable mosaic of habitat or
resource patches may be investigated in comparison to the matrix of the (non-suitable)
surroundings in a study area (hereafter: regional-scale landscape analysis). We are not aware
of any study that comparatively quantified the resources required by target breeding bird
species in order to derive conservation management recommendations.
 Within the framework of management planning in national natural heritage areas we
collected an extensive dataset containing assessments of habitats, forest structure, and breed-
ing birds in a network of 14 decommissioned MTAs comprising in total more than 200 km²
distributed all over Germany. By systematically evaluating current bird distribution patterns
in relation to the complex landscapes and reviewing appropriate measures, we aimed at
defining explicit quantitative goals for conserving biodiversity, as GASTON et al. (2008)
identified the lack of such quantitative goals as major shortfall in the implementation of
European protected area systems. Here, we specifically present our results on semi-open
habitats and the related bird assemblages. Our first goal was to quantify the present-day
spatial mosaic of habitat patches in our study areas. We expected that (1) decommissioned
MTAs possess a significant portion of fine-scale landscape patterns, and that (2) these fine-
scale patterns occur as large semi-open transition zones between open land and forests being

 275

mainly created by different stages of succession. Our second goal was to evaluate the occur-
rence of the target birds of semi-open habitats. Since present-day bird diversity loss in
Europe is particularly high in open habitats rather than in forests (GERLACH et al. 2019,
GREGORY et al. 2019), we assumed that (3) it is mainly the fine-scale semi-open mosaic of
nutrient-poor open habitats and early successional stages that harbour a substantial portion of
threatened bird species. Given that each bird species is (more or less) confined to the availa-
bility of certain resources, we further expected that (4) the species of the semi-open land-
scape bird assemblages occupy species-specific habitat resources, which can be qualified
and quantified. This enabled us to provide management recommendations for six keystone
bird species of the semi-open landscape guild.

 2. Methods

 2.1 Study areas
 Our 14 study areas in Germany represent a wide range of ecosystems from the North Sea coast to
the Baltic Sea islands and adjacent mainland, from the central parts to the southern fringes of the Pleis-
tocene lowlands of eastern Germany, and to the Mesozoic scarplands and Franconian basin of northern
Bavaria (Fig. 1, Table 1). Across 585 km between the most distant sites, they span large gradients in
continentality and precipitation from the sub-oceanic northwest to the most sub-continental east in the
far southeast of the lowlands as well as in central Bavaria. All study areas are part of the national natu-
ral heritage scheme (REITER & DOERPINGHAUS 2015). Since 2009, the formerly government-owned
land was transferred to private property of the German Federal Environmental Foundation. The study
areas are former MTAs that were decommissioned between 1992 and 2007. They show recurrent land-
scape patterns of forests that served as buffer or safety zones around military activities, which took
place on one central and/or several interspersed open areas used as shooting or bombing ranges, combat
zones, detonation sites, etc. These activities, often with irregular frequency, led to the conservation of
open habitats such as heathlands or high nature value grasslands and to dynamic landscapes with differ-
ent successional stages. Inventories comprised 20,101 ha with size of study areas ranging from 196 to
3,881 ha (mean of 1,436 ha ± 1,134 SD). In total, 49% of them are Special Protected Areas (SPA)
under the European Birds Directive (2009/147/EG, and 2013/17/EU), being partly or completely classi-
fied as Important Bird Areas (IBA; DOER et al. 2002).

 2.2 Habitat data
 Habitats, defined as areas with particular environmental conditions that are sufficiently uniform to
support a characteristic assemblage of organisms (DAVIES et al. 2004), were surveyed by using a stand-
ardised mapping protocol. This required a full survey of all habitats in a study area with the designation
of vegetation types, estimated abundances of vascular plant species, and supplementary data such as
structural and ecological characteristics (e.g., shrub encroachment) on the single habitat (polygon)
level. Mapping scale was 1:2,500. Minimum areas for the delimitation of habitat boundaries generally
applied were 0.5 ha for forest habitats and 0.1 ha for open vegetation habitats and therein dispersed
single forest patches. Smaller, vegetation type-specific minimum areas of 0−1000 m² were employed
for habitats protected under §30 of the Federal Nature Conservation Act (BNATSCHG 2009), which are
further specified in the available guidelines of the German federal state authorities (e.g., 100 m² for
heathlands). Habitats sized below the specific minimum areas were recorded as integral parts of other
delimited habitats (preferably unprotected) resulting in a habitat complex with a first-order main habi-
tat, followed by secondary-, tertiary-order etc. habitats (e.g., single trees, pathways < 5 m width, bush-
grass fallow < 0.1 ha). Such subsidiary vegetation types were quantified as percentage share of the
habitat complex. Habitat classification primarily followed the classification systems of the concerned

276

Fig. 1. Location of the study areas in the North German lowlands and the Mesozoic scarplands, Germa-
ny. The map is projected on Universal Transverse Mercator (UTM) zone 32 N, ETRS 1989. Geograph-
ical boundaries of main natural landscapes are adopted from GAUER & ALDINGER (2005) and are based
on digital data made available by Thünen Institute (Braunschweig, Germany). Compare Table 1 for
study area acronyms.
Abb. 1. Lage der Untersuchungsgebiete im Norddeutschen Tiefland und im mesozoischen Schichtstu-
fenland Deutschlands. Die Karte ist in Zone 32 N, Universal Transverse Mercator (UTM), ETRS 1989,
projiziert. Die Abgrenzungen der Naturlandschaften wurden von GAUER & ALDINGER (2005) über-
nommen und basieren auf digitalen Daten, die vom Thünen-Institut (Braunschweig, Deutschland) zur
Verfügung gestellt wurden. Vgl. Tabelle 1 für Akronyme der Untersuchungsgebiete.

federal states. The primary habitat code was then translated to the best possible resolution of the stand-
ardised federal habitat code (long code; FINCK et al. 2017). Habitat surveys were conducted by special-
ised consultant offices from 2012−2016 taking one to two vegetation periods depending on the size of
the study area (Table 1). The resulting thematic datasets were entered in a comprehensive database and
combined to a non-overlapping polygon feature layer.
 In the present study, we added two types of additional attributes to the thematic habitat feature
dataset. First, woody plant coverage (estimated percentage cover of trees and shrubs, hereafter: wood
cover) was determined for each habitat (polygon). In open habitats, wood cover was derived from the
structural attribute ‘shrub encroachment’ appraised during field survey, and the percentage share of
scrubs, single trees, and groups of trees as subsidiary habitats in habitat complexes. Scrubs, hedges and
single forest patches imbedded in open land were estimated having 100% wood cover unless they

 277

Table 1. Basic data on the 14 study areas within the national natural heritage scheme of Germany, located in several different federal states and main geographical landscapes, with the year in

278
 which the military training area (MTA) was decommissioned, the area of habitat and breeding bird surveys conducted between 2012 and 2018, and the corresponding number of 1 ha landscape
 units (LU). Climate data (mean annual temperature and rainfall) from German National Meteorological Service (DWD), based on the reference period 1981–2010, and Ivanov continentality index
 (KI), derived from this data.
 Tabelle 1. Grunddaten zu 14 Untersuchungsgebieten des Nationalen Naturerbes in verschiedenen Bundesländern und Hauptlandschaftseinheiten, Jahr der Stilllegung der militärischen
 Übungsplätze (MTA), Jahres- und Flächenangaben der Biotoptypen- und Brutvogelkartierungen mit entsprechender Anzahl von 1 ha Landschaftseinheiten (LU). Klimadaten (mittlere
 Jahrestemperatur und Niederschlag) des Deutschen Wetterdienstes (DWD), basierend auf dem Referenzzeitraum 1981–2010, und daraus abgeleiteter Ivanov-Kontinentalitätsindex (KI).
 Study area Acronym State Geographical MTA Survey area LU Habitat Bird Tmean Rainfall KI
 landscape decommissioned (ha) (n ) survey survey (°C) (mm yr-1 )
 (yr) (yr) (yr)
 1 Cuxhavener Küstenheiden CU Lower Saxony Pleistocene lowlands 2004 1,433 1,575 2014 2015 9.4 862 75
 2 Prora PR Mecklenburg Western Pomerania Pleistocene lowlands 1990 1,768 2,028 2012–2013 2014 8.7 656 80
 3 Peenemünde PE Mecklenburg Western Pomerania Pleistocene lowlands 1996 2,027 2,312 2014–2015 2016 8.7 594 83
 4 Ueckermünder Heide UE Mecklenburg Western Pomerania Pleistocene lowlands 1994–2007 2,657 3,370 2013–2015 2017 8.9 571 87
 5 Rüthnicker Heide RH Brandenburg Pleistocene lowlands 1990 3,881 4,126 2013 2017 9.2 582 90
 6 Roßlauer Elbauen RO Saxony-Anhalt Pleistocene lowlands 2006 321 438 2015 2016 9.6 600 92
 7 Kühnauer Heide KH Saxony-Anhalt Pleistocene lowlands 1992 958 1,028 2013–2014 2015 9.8 546 92
 8 Oranienbaumer Heide OH Saxony-Anhalt Pleistocene lowlands 1992 2,117 2,263 2012–2013 2018 9.8 587 92
 9 Glücksburger Heide GH Saxony-Anhalt Pleistocene lowlands 1992 2,644 2,817 2014 2016 9.4 561 95
 10 Weißhaus WE Brandenburg Pleistocene lowlands 2007 1,134 1,259 2014 2017 9.2 609 94
 11 Mellrichstadt ME Bavaria Mesozoic scarplands 2006 207 245 2015–2016 2018 8.3 718 93
 12 Reiterswiesen RW Bavaria Mesozoic scarplands 1993 321 392 2015 2018 8.7 771 94
 13 Tennenlohe TE Bavaria Mesozoic scarplands 1994 437 506 2016 2018 9.0 777 99
 14 Hainberg HB Bavaria Mesozoic scarplands 1994 196 240 2016 2018 9.1 664 99

appeared in a habitat complex with subsidiary open habitat types. The estimates of wood cover in
forests were based on the stocking level of contemporary forest inventory data. Second, universally
valid habitat types were assigned based on the hierarchical system of the standardised federal habitat
classification. Having the federal code already resolved to the long code, we assigned each habitat
(polygon) to a two-digit superordinate short code on the rank of a plant community formation according
to FINCK et al. (2017). Formation is a high-ranking classification level aggregating plant communities
with similar plant growth forms and structural features but different species compositions (e.g., grass-
lands, heathlands, mires, scrubs, forests).

 2.3 Bird data
 Breeding birds were recorded in the entire study areas using territory mapping according to the
methodological standard of SÜDBECK et al. (2005). During the breeding season (March–June/July) of
the respective survey year (Table 1), each study area was visited seven times between sunrise and
10 a.m., and additionally, in order to record nocturnal species like owls or European Nightjar (Caprim-
ulgus europaeus), five times between dusk and late night (each up to three times in the early and late
breeding seasons). Study areas larger than 500 ha were divided into counting plots that could each be
visited within one field-survey day by the investigator. During the visits, birds were recorded and clas-
sified according to the European Ornithological Atlas Committee (EOAC) criteria as applied in the
Atlas of European breeding birds (HAGEMEIJER & BLAIR 1997) that distinguishes between “possible
breeding” (‘A’), “probable breeding” (‘B’), and “confirmed breeding” (‘C’) categories. In this study,
“breeding” in terms of breeding pair and “territory” in terms of individual territorial behaviour even
without confirmed breeding record are used synonymously. A “territory” was defined as (1) any two
records of species-specific territorial behaviour on separate days at a minimum seven-day interval
during the main breeding season of each species (category ‘B’), or (2) single records of evident breed-
ing activity (e.g., observation of nests with eggs or chicks or food-carrying adults, category ‘C’). The
survey included all bird species native to and regularly breeding in Germany that are considered being
rare (annually up 10,000 pairs/territories) or semi-frequent (>10,000−100,000) (GRÜNEBERG et al.
2015). Common bird species (> 100,000) were only recorded if they were listed in Annex I of the
European Birds Directive, red-listed in Germany (GRÜNEBERG et al. 2015) or protected under the
Federal Nature Conservation Act (BNATSCHG 2009). Yellowhammer (Emberiza citrinella), Common
Redstart (Phoenicurus phoenicurus), and Common Starling (Sturnus vulgaris), all common bird species
of least concern according to the 4th ed. of the German red list of birds (SÜDBECK et al. 2007), were
moved to ‘near threatened’ in the 5th ed. (GRÜNEBERG et al. 2015), thus these species were not consid-
ered in the survey of 2014. Bird surveys were conducted by specialised consultant offices from
2014−2018. The resulting thematic datasets (bird territory centroids) are available as an attributed point
feature layer. Unique species codes were given following the European Union for Bird Ringing species
code (EURING 2019). Nomenclature of scientific and English bird names follows GILL & DONSKER
(2019).
 In this study, we only evaluated records of probable and confirmed breeding bird territories (EOAC
categories ‘B’ and ‘C’), which were situated with their territory’s centroid in the extent of the available
habitat maps. This applied to a total of 93 bird species. We assigned these species to habitat guilds and
identified the home ranges (mean territory areas) of the bird species related to semi-open landscapes in
Central Europe based on an extensive literature research (FLADE 1994, GLUTZ VON BLOTZHEIM &
BAUER 1998, BAUER et al. 2005). The analysis across habitat-specific guilds included all breeding bird
species recorded under the above-mentioned selection criteria, but neglected the colony-breeding Great
Cormorant (Phalacrocorax carbo), because it occupied only few hectares (< 0.05% of the study areas).

 2.4 Landscape-scale data compilation
 We analysed the landscapes of the study areas on two spatial scales, following the two approaches
referred to in chapter 1, the regional scale defined as the entire study area (regional-scale landscape
analysis) and the territories occupied by breeding birds as sections of the landscape (territory-based
landscape analysis).

 279
For the regional-scale landscape analysis, we subdivided each of the 14 study areas into 1 ha
(100 × 100 m) grid-cells (hereafter: landscape units) by using the Grid Index Features tool integrated in
the Cartography toolbox of ArcGIS Desktop Advanced applications v. 10.5.1 (ESRI Inc., Redlands,
CA), starting in the most north-western corner and filling the rows consecutively to the study area
borderline. This grain size is close to the average (median) range of the territories of 1.5 ha typically
occupied by the studied bird species of semi-open landscapes during the breeding season. According to
the habitat mapping scheme, 1 ha is furthermore amply above the minimum area of 0.1 ha for the
delimitation of isolated forest habitat patches. This allowed us identifying our target habitats that were
semi-open landscapes with transitional habitat complexes (ecotones), where a mosaic of predominating
open vegetation patches was intermingled with forest patches.
 We computed a geometric union of the polygon feature datasets of landscape units and habitats and
wrote all features and their attributes to a unified output feature class (union function). Based on this
unified dataset we calculated several aggregated structural and compositional attributes and wrote them
to the landscape unit feature dataset. To avoid edge effects in landscape units that had incomplete
habitat data because they were situated at the borderline of a study area, we added the total habitat area
per landscape unit to be considered as reference area in the subsequent analyses. We summarised the
wood cover (in %) of each landscape unit as the average of the area-weighted wood cover of all occur-
ring habitats. In total, we used 22,599 landscape units covering 20,101 ha of survey area.
 Territory-based landscape analysis was performed on the section of the landscape that represented
the normal home range of the breeding birds. We compiled the information on species-specific mean
home range areas during the breeding season from literature (Supplement S1). Estimating relatively
even mobility patterns of breeding birds we generated circular polygons centred on the input points of
territory centres using the buffer function of the ArcGIS Analysis toolbox. We computed a geometric
union of the polygon feature datasets of bird territories for each species and habitat and wrote all fea-
tures and their attributes to a unified output feature class (union function) and deleted all outlying
spatial information. For each single bird territory, we then calculated wood cover and formation shares
using the same procedures as described for the landscape units. In total, the number of territories ac-
counted for in this study was 3,125 covering 3,754 ha of habitat area (after the union of overlapping
territories).
 To account for the explanatory value of the climatic conditions in the study areas, we used tempera-
ture and precipitation data available as interpolated 100 ha raster datasets for the period 1981−2010
(DWD 2019). For each landscape unit and territory, we extracted the mean annual temperature and
precipitation values from the centre of the closest climate data grid cell. Furthermore, we calculated the
Ivanov continentality index KI (FRANKENBERG 1991), which is based on temperature values and geo-
graphical latitude, with values KI < 100 indicating an oceanic climate and KI > 100 continental climate.

 2.5 Statistical analysis
 Statistical analysis was performed using RStudio v. 1.2.1335 (RSTUDIO TEAM 2019, based on
R v. 3.6.2, R CORE TEAM 2019), unless otherwise stated.
 Landscapes were classified based on wood cover values of the 1 ha landscape units into five clus-
ters using the ‘kmeans’ algorithm implemented in the ‘classIntervals’ function of the ‘classInt’ package
(VIVAND et al. 2019) (Table 2, Fig. 2). The k-means algorithm clusters similar objects into a predefined
number of clusters in which each observation belongs to the cluster with the nearest mean, preferring
clusters with low variance and similar size (MACKAY 2005). To evaluate the spatial association of
landscape units (cluster and outlier analysis), Anselin Local Moran’s I (ANSELIN 1995) based on wood
cover values was calculated, with the ‘inverse distance’ and the ‘Euclidean distance’ options and 499
random permutations for estimating pseudo p-values (p ≤ 0.05), by using the Mapping Clusters tool
integrated in the Spatial Statistics toolbox of ArcGIS.
 Out of the observed breeding bird species of semi-open landscapes, a subset of six keystone species
was selected representing different abundances across the dataset and a range of intermediate-sized bird
territories. We excluded species when they had (1) territories > 3 ha in order to avoid edge effects

280

(missing landscape data), (2) small total sample sizes (< 30 breeding pairs/territories), (3) a high esti-
mated proportion of missing data (semi-frequent birds that were red-listed only in 2015), or were
(4) host- or colony-breeding. The remaining subset covered the large majority (79%) of the sample
total. Differences in species-attributed wood cover values in territories (as the dependent variable) were
analysed using linear mixed effects models (LME) that incorporate both fixed- and random-effects
terms in a linear predictor expression from which the conditional mean of the response can be evaluated
(BATES et al. 2015) (Fig. 4, Supplement E2). We created and tested the fit of five different models
against a null model by using ‘lmerTest’ package (KUZNETSOVA et al. 2019), which integrates the
‘lmer4’ package (BATES et al., 2019). Wood cover was square root-transformed in order to best ap-
proach a normal distribution. To account for the block structure of the study areas, we used the study
area as random-effects term of the form (1 | studyarea) in all fitted models, and in the null model the
alternative term 1 + (1 | studyarea), meaning a random intercept with fixed mean. As fixed effects we
used the scaled (z-transformed) KI and the scaled geographical latitude (x_coord) (as independent
variables) in different combinations as factors and interactions with species. Models were tested with t-
tests using Satterthwaite’s method. ANOVA-based comparison of all models resulted in the best fitting
model formula:
 ← ( ~ ∗ ( ) + ( ) + (1 | ))

 Habitat types that differentiated the territories of the different bird species were identified by the
algorithm proposed by TSIRIPIDIS et al. (2009), which uses a fidelity threshold based on differences in
relative constancy (Table 3). Here, ‘fidelity’ measures the association of certain bird species with
a habitat class. The algorithm searches for habitats, which in one or more groups are positively or
negatively differentiated against one or more other groups. The phi coefficient (φ) is the most appropri-
ate fidelity measure if dataset sizes vary (CHYTRÝ et al. 2002), because the influence of the total num-
ber of samples in a dataset as well as that of the relative number of samples in the compared bird spe-
cies is reduced by standardisation procedures. Positive/negative values of φ, which may take values
from -1 to +1, indicate that the habitat type occurs more/less frequently than would be expected by
chance. We calculated fidelity measures by using a macro incorporated in a MS Excel (Microsoft
Corp., Redlands, CA) spread sheet.

 3. Results

 3.1 Structural configuration of landscapes
 Structural classification of landscape units resulted in five natural wood cover classes
(Fig. 2a–b, Table 2, Supplement E1). A total of 22,599 landscape units, sized 1 ha, covered
a survey area of 20,101 ha. Accounting for landscape units situated at the border of a study
area, we found an even distribution of incompletely surveyed landscape units across the
classes (mean count : area ratio between classes = 1.1 ± 0.1 sd).
 Wood-dominated landscapes with ≥ 68% wood cover (c4) and closed forests with ≥ 87%
wood cover (c5) together made up for about 60% or c. 12,126 ha of the total survey area.
Semi-open landscapes occurred in two distinct wood cover classes (c2, c3), summing up to
about 5,548 ha or less than a third (28%) of the survey area (mean 33% ± 15 sd). Thereof,
sparsely wooded semi-open landscapes (c2) contained scattered trees and shrubs that cov-
ered between 20 and 46% of a landscape unit. They differed from densely wooded semi-
open landscapes (c3) with scattered or clustered trees and shrubs with ≥ 46 to 68% wood
cover. In most study areas, densely wooded semi-open landscapes with an average share of
18% (± 7 sd) were slightly higher represented than sparsely wooded semi-open landscapes

 281

282
 Fig. 2. Classification of 1 ha landscape units (n = 22,599) based on percentage wood cover. (a) Histogram of wood cover values in 5% intervals and a normal curve
 with the mean of 65.9% (± 31.0 sd). (b) Class intervals of five clusters with break values generated by the k-means algorithm. (c) Differences in spatial association
 based on z-scores of Anselin Local Moran’s I between wood cover classes c1–c5 derived from k-means analysis with 0.95 confidence level (dashed horizontal
 lines), z-scores ≥ 1.96 meaning that neighbouring landscape units have significantly similar low or high cover values (spatial clustering) and z-scores ≤ -1.96 mean-
 ing that a landscape unit is an outlier having a significantly higher or lower cover value than the neighbouring landscape units. Boxes are drawn with widths pro-
 portional to the square-roots of the number of observations in the groups. Notches show that medians of all groups are significantly different at p ≤ 0.05.
 Abb. 2. Klassifizierung von 1 ha Landschaftseinheiten (n = 22.599) anhand der prozentualen Gehölzbedeckung. (a) Histogramm der Gehölzbedeckungswerte in
 Intervallen von 5 % und eine Normalverteilungskurve mit einem Mittelwert von 65,9 % (± 31,0 sd). (b) Klassenintervalle von fünf Clustern mit vom k-Mittelwert-
 Algorithmus erzeugten Unterbrechungswerten. (c) Unterschiede in der räumlichen Klumpung, basierend auf den Z-Scores des Anselin Local Morans I zwischen
 den Gehölzbedeckungsklassen c1–c5, abgeleitet aus der K-Mittelwert-Analyse mit einem Konfidenzniveau von 0,95 (gestrichelte horizontale Linien). Z-Scores
 ≥ 1,96 bedeuten, dass benachbarte Landschaftseinheiten signifikant ähnliche niedrige oder hohe Deckungswerte besitzen (räumliche Clusterbildung) und Z-Scores
 ≤ -1,96 bedeuten, dass eine Landschaftseinheit ein Ausreißer mit einem signifikant höheren oder niedrigeren Deckungswert als die benachbarten Landschaftsein-
 heiten ist. Die Breite der Boxplots ist proportional zur Quadratwurzel der Anzahl der Beobachtungen in der jeweiligen Gruppe. Einkerbungen zeigen an, dass die
 Mediane aller Gruppen bei p ≤ 0,05 signifikant unterschiedlich sind.
Table 2. Description of five structural landscape types based on wood cover classes (c1−c5) with upper
thresholds of percentage wood cover in 1 ha landscape units (LU), the respective habitat area (ha), and
the proportion of landscape based on the total habitat area of all study areas and the mean proportion of
landscapes (± sd, in %) in 14 national natural heritage areas in Germany. Compare Supplement E1 for
study area details.
Tabelle 2. Beschreibung der fünf strukturellen Landschaftstypen nach Gehölzbedeckungsklassen
(c1-c5) mit oberen Schwellenwerten für die prozentuale Gehölzbedeckung in 1 ha Landschaftseinheiten
(LU), der jeweils kartierten Biotopfläche (ha), dem Anteil an der Gesamtlandschaft (basierend auf der
gesamten Fläche aller Untersuchungsgebiete) und dem mittleren Anteil an der Landschaft (± Standard-
abweichung, in %) auf 14 Naturerbeflächen. Vgl. Anhang E1 für Details zu den Untersuchungs-
gebieten.

Class Wood cover Description LU Habitat area Proportion of Proportion of
 (%) upper (n) (ha) landscape, landscapes,
 threshold total (%) mean ± sd
 (%)
c1 19.7 Open landscape (at most few 3,018 2,427 12.1 16.4 ± 13.5
 single/isolated trees/shrubs)
c2 45.7 Sparsely wooded semi-open 2,435 2,188 10.9 14.7± 8.2
 landscape (trees/shrubs
 scattered)
c3 67.8 Densely wooded semi-open 3,712 3,360 16.7 18.1 ± 7.3
 landscape (trees/shrubs
 scattered to clustered)
c4 86.7 Wood-dominated landscape 6,234 5,737 28.5 27.0 ± 11.3
c5 100.0 Landscape with closed wood 7,200 6,390 31.8 23.7 ± 17.1
 canopy/closed forests

Sum 22,599 20,101 100.0

(mean 15% ± 8 sd). Absolute semi-open area (c2+c3) per study area varied widely from
77 ha to 1,251 ha (in mean 396 ha ± 345 sd). We identified the largest semi-open areas in the
north-eastern German Pleistocene lowlands (study areas GK, PR, OH, and UE). The six
smaller study areas (< 1,000 ha) had a higher proportion of semi-open area (mean 42%) than
the other eight study areas (mean 26%).
 The two types of semi-open landscapes (c2, c3), wood-dominated landscapes (c4) and
landscapes with closed wood canopy (c5) formed large-scale coherent ecotones (Fig. 2c).
Such smooth transitions between landscapes with different wood cover values were indicat-
ed by Anselin Local Moran’s I analysis that showed, with the interquartile range of boxplots
of z-scores between + 1.96 and -1.96, a distribution as random mosaics in 50% or more of all
landscape units in wood cover classes c2−c5. However, medians of all groups were signi-
ficantly different and sparsely wooded semi-open landscapes (c2) and closed forests
(c5) tended to cluster. This contrasted to the configuration of open landscapes (c1), which
showed distinctive spatial structuring. In total, they constituted only 12% (mean
16% ± 14 sd) of the study areas, but more than 50% of them were significantly more clus-
tered than expected by chance.

 283
3.2 Abundances of habitat-specific guilds
 We counted a total of 6,476 breeding pairs or territories of 93 bird species across all hab-
itat-specific guilds (Fig. 3). Nearly half of the pairs/territories (n = 3,047 or 47%) represent-
ed ‘threatened’ bird species (national red list categories RL1−RL3), and another 30%
(n = 1,963) were classified ‘near threatened’ (NT). The bird guild associated with semi-open
landscapes was exceptionally large accounting for 61% (n = 3,937) of the total and 71%
(n = 2,152) of all bird species classified ‘threatened’. Among the threatened birds, the guild
of open landscapes was the second-largest group (n = 964 in all, n = 645 in RL1−RL3 spe-
cies), with Eurasian Skylark (Alauda arvensis), European Stonechat (Saxicola rubicola),
Whinchat (Saxicola rubetra), and Corn Bunting (Emberiza calandra) being the most abun-
dant species (89% of the guild total). Despite the large forested area (Table 2), the forest-
specific guild was relatively small (n = 962) and its species were largely of ‘least concern’
(LC) or 'near threatened' (NT).

Fig. 3. Breeding birds with probable or confirmed breeding (based on EOAC categories ‘B’ or ‘C’)
sorted by habitat-specific guilds in 14 national natural heritage areas in Germany. Different signatures
indicate the status according to the German Red List of breeding birds (GRÜNEBERG et al. 2015), with
the threat categories ‘RL1’ (critically endangered), ‘RL2’ (endangered), and ‘RL3’ (vulnerable), and,
furthermore, ‘NT’ (near threatened) for species added to the pre-warning list, and ‘LC’ (least concern)
for unthreatened species. A total number of 6,476 breeding birds were counted in 92 species, and, as
indicated by the asterisk, an additional 4,071 colony-breeding Great Cormorants (Phalacrocorax carbo)
were recorded at Peenemünde (PE).
Abb. 3. Brutvögel mit wahrscheinlicher oder bestätigter Brut (basierend auf den EOAC-Kategorien „B“
oder „C“), sortiert nach lebensraumspezifischen Gilden auf 14 Naturerbeflächen. Unterschiedliche
Signaturen geben den Status gemäß der Roten Liste der Brutvögel Deutschlands (GRÜNEBERG et al.
2015) mit den Gefährdungskategorien 'RL1' (vom Aussterben bedroht), 'RL2' (stark gefährdet) und
'RL3' (gefährdet) an. Zusätzliche Kategorien sind "NT" (Vorwarnliste) und "LC" (ungefährdet). Insge-
samt wurden 6.476 Brutvögel aus 92 Arten gezählt. Das Sternchen zeigt an, dass in Peenemünde (PE)
zusätzlich 4.071 Kormorane (Phalacrocorax carbo) gezählt wurden.

284
3.3 Diversity and distribution of birds of semi-open landscapes
 We recorded 20 bird species associated with semi-open landscapes with a total of
3,937 records of probable or confirmed breeding status (Supplement S1). Tree Pipit (Anthus
trivialis) was most abundant comprising 1,586 or 40% of all territories. Further common
species that were present in almost all study areas, each with a total of > 300 territories, were
Yellowhammer, Woodlark (Lullula arborea), and Red-backed Shrike (Lanius collurio).
An additional eight species were similarly distributed across all study areas but had lower
frequencies. Among them, the European Nightjar was restricted to areas dominated by dry
sandy soils. It was most frequent in the subcontinental north-eastern lowlands, in particular
in the study areas OH and GH, which represented exceptionally large semi-open landscapes.
Similar distribution patterns, even more restricted to the north-eastern lowlands, were found
in Great Grey Shrike (Lanius excubitor) and Eurasian Hoopoe (Upupa epops), which both
possess very spacious home ranges of 40 and 70 ha, respectively. Barred Warbler (Sylvia
nisoria) had its main distribution centre in the study areas close to the Baltic Sea (PR, PE),
but reached as far as the south-eastern border of the north-east German lowlands. Other rare
birds centred to our study areas at the Baltic Sea shoreline of Mecklenburg Western Pomera-
nia (PR, PE, UE) were Common Rosefinch (Carpodacus erythrinus), River Warbler
(Locustella fluviatilis), and Thrush Nightingale (Luscinia luscinia). Considering the semi-
open landscapes identified in the study areas (wood cover classes c2+c3) as suitable habitats,
we estimated an average bird density of 0.7 breeding pairs or territories ha-1. Highest densi-
ties of 2.4 and 1.6 birds ha-1 were recorded in semi-open limestone areas of Bavaria (RW,
ME).

 3.4 Bird species-specific habitat occupation
 Characteristic birds of semi-open landscapes occupied different species-specific structur-
al habitats (Fig. 4). Mean wood cover values in territories varied significantly between all six
selected species (LME: p ≤ 0.01, Supplement E2). The territories occupied by these bird
species were composed of a high number of co-occurring habitat types and showed distinct
compounds characterising specific niches (Table 3, Fig. 5).
 Tree Pipit, the most frequent species, was associated with densely wooded habitats (c3),
with a specific mean wood cover of 58% and the widest wood cover range (interquartile
range, IQR: 33−83%). It was closely associated with coniferous forests occurring with
a mean percentage cover of 45% in its territories correlating with the described relatively
high wood cover values that distinguished it from all other investigated species. An overlap-
ping niche was occupied by Red-backed Shrike and Barred Warbler, which concentrated in
transition zones from open (c1) to sparsely wooded semi-open (c2) landscapes and had an
upper limit (0.75p) at about 34 and 32% wood cover, respectively. Both species were highly
dependent on the presence of shrubs and hedges. The rare Barred Warbler was almost exclu-
sively distributed in study areas with maritime climatic conditions (Supplement S1: PR, PE;
Supplement E2: LME: species*KI interaction, p ≤ 0.05), and showed the most complex
habitat dependency being strongly associated to grasslands, salt meadows and other open
coastal habitats at its distribution peak in PE, as well as wetlands and reeds, but also broad-
leaved forests. The relatively frequent Red-backed Shrike also showed a peak associated
with maritime climate (PR, PE) and a secondary peak in KH and OH but appeared with
varying numbers in all study areas (Supplement S1).

 285
Fig. 4. Structural characteristics of habitats by means of wood cover (in %) in the territorial ranges of
six breeding bird species of semi-open landscapes (n = 3,125) in 14 national natural heritage areas in
Germany. Compare Supplement S1 for full scientific bird species names and Supplement E2 for statis-
tical results. Boxes are drawn with widths proportional to the square-roots of the number of observa-
tions in the groups, and notches display the 95% confidence interval of the median. Dashed horizontal
lines depict thresholds of wood cover classes (c1−c5).
Abb. 4. Strukturelle Merkmale der Lebensräume von sechs Brutvogelarten halboffener Landschaften
auf Grundlage der Gehölzbedeckung (in %) in Revieren (n = 3.125) auf 14 Naturerbeflächen. Vgl.
Beilage S1 für vollständige wissenschaftliche Vogelartnamen und Anhang E2 für weitere statistische
Analyseergebnisse. Die Breite der Boxplots ist proportional zu den Quadratwurzeln der Anzahl der
Beobachtungen in den Gruppen, Einkerbungen zeigen das 95 % -Konfidenzintervall des Medians an.
Gestrichelte horizontale Linien zeigen Schwellenwerte der Gehölzbedeckungsklassen an (c1–c5).

 The focal structural habitats of European Nightjar, Yellowhammer and Woodlark were
sparsely wooded semi-open landscapes (c2). European Nightjar, which is a semi-frequent
species, extended into densely wooded landscapes (0.75p = 50% wood cover) but did not
overlap with open landscapes. It lived at forest fringes in a complex with heathlands that
reached high cover values of 52% on average, but avoided a high coverage of coniferous as
well as broadleaved forests. Woodlark and Yellowhammer, both frequent species, did not
extend into densely wooded but to open landscapes (0.25p = 10 or 15% wood cover). Wood-
lark was highly associated with heathlands, although grasslands were present with on aver-
age 27% coverage and a substantial population on Bavarian calcareous dry grasslands (ME,
RW, cp. Supplement S1). Yellowhammer was the only species that showed no distinct habi-
tat type preferences, also it tended to avoid heathlands and forest fringes.

286
Table 3. Mean percentage cover of habitat types (F08−F57, according to FINCK et al. 2017) in territo-
ries of six selected breeding bird species of semi-open landscapes in 14 national natural heritage areas.
Habitat types that, based on constancy tables, positively differentiated the territories of the different
bird species are printed in bold letters with grey-shaded fields, and those that negatively differentiated
are printed solely in bold letters, with phi coefficients (φ) given for differential habitat types. Compare
Supplement S1 for full scientific bird species names.
Tabelle 3. Mittlerer prozentualer Deckungsgrad der Vegetationsformationen (F08−F57, nach FINCK et
al. 2017) in den Revieren sechs ausgewählter Brutvogelarten halboffener Landschaften auf 14 Natur-
erbeflächen. Vegetationsformationen, die auf der Grundlage von Stetigkeitstabellen die Reviere der
verschiedenen Vogelarten positiv differenzierten, sind in fetten Buchstaben mit grau schattiertem Hin-
tergrund gedruckt, und diejenigen, die negativ differenzierten, sind ausschließlich in fetten Buchstaben
gedruckt, wobei der Phi-Koeffizient (φ) für differenzierende Vegetationsformationen angegeben ist.
Vgl. Beilage S1 für vollständige wissenschaftliche Vogelartennamen.

FID Habitat type AnthTri CaprEur EmbeCit LaniCol LullArb SylvNis φ
 n 1,586 173 567 338 427 34
F08 Salt meadows 0.08 . 0.12 1.75 . 14.53 0.50
F09 Beach and sea shore 0.01 . 0.01 0.05 . 0.57 0.39
F10 Dunes 0.05 . 0.18 0.38 . 3.45 0.41
F11 Cliffs 0.01 . . 0.09 . . .
F22 Springs . . 0.01 . 0.01 . .
F23 Flowing water 0.03 . 0.06 0.46 . 0.95 .
F24 Still water 0.05 0.20 0.03 0.32 0.18 0.54 .
F32 Rocks 0.12 0.10 0.49 0.08 0.28 . .
F33 Fields 0.14 . 0.08 0.62 0.21 . .
F34 Grasslands 10.98 9.14 40.38 34.09 27.40 31.31 0.25
F35 Wetlands 0.45 0.06 2.61 6.91 0.70 7.75 0.38
F36 Raised bogs 0.29 0.00 0.23 0.63 0.19 . .
F37 Sedge fens 0.13 . 0.07 0.93 0.01 . .
F38 Reeds 0.12 . 1.33 4.12 0.08 3.59 0.25
F39 Forbs and copse 7.03 10.09 11.59 13.49 12.66 9.80 .
F40 Heathlands 16.84 52.38 11.62 10.54 30.30 6.00 0.52
F41 Shrubs and hedges 1.07 0.14 3.75 8.14 1.31 4.37 0.33
F42 Forest fringes 7.50 15.30 2.38 2.16 8.31 5.67 0.28
F43 Broadleaved forests 9.26 1.84 10.86 6.83 3.52 10.42 0.23
F44 Coniferous forests 44.81 10.46 11.21 7.29 13.62 0.75 0.26
F51 Gardens . . . . 0.03 . .
F52 Traffic 0.90 0.28 2.82 0.93 1.14 0.31 .
F53 Buildings 0.07 . 0.07 0.14 0.02 . .
F54 Disposal sites 0.04 . 0.04 0.05 . . .
F57 Others 0.02 . 0.07 . 0.03 . .

 Among all selected bird species, wood cover range (IQR) varied from 50 in Tree Pipit to
21 in Barred Warbler, almost linearly descending with count numbers. Thus generally, with
exception of European Nightjar (IQR = 30), the rarer a species was, the smaller was its
occupied niche in terms of wood cover in its territory.

 287
a) b)

 c) d)

 e) f)

 g) h)

288
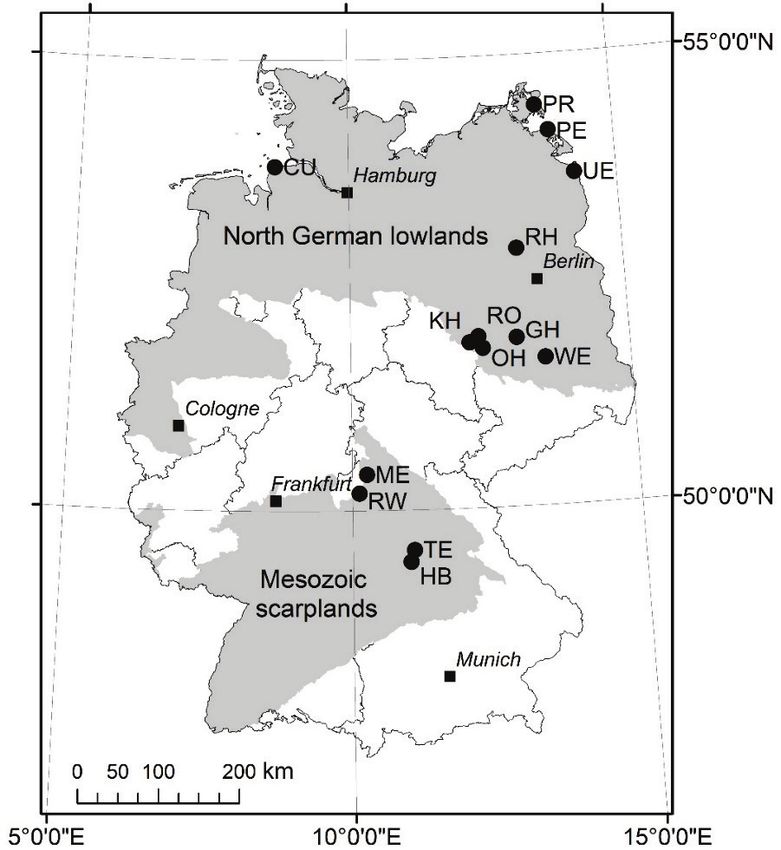
4. Discussion
 Actively used MTAs are landscapes with heterogeneous disturbance regimes, in which
different successional stages are present simultaneously occurring as fine-scaled mosaics
(WARREN et al. 2007). Intense military exercises can be beneficial for pioneer communities
of fauna and flora, followed by other successional stages (GAZENBEEK 2005). Having been
decommissioned 13−30 years ago our 14 former MTAs were still very heterogeneous land-
scapes as shown by five distinct wood cover classes each covering significant portions of the
landscapes (Fig. 2b, Table 2). While open landscapes appeared as connected open areas,
semi-open landscapes, wood-dominated landscapes, and closed forests were mostly patchy
mosaics merging into each other (Fig. 2c). This contrasts with the widely identified ongoing
homogenisation of Central European landscapes driven by agricultural intensification,

Previous page (vorherige Seite):

Fig. 5. Semi-open landscape sceneries of selected study areas: a) Juniperus communis formation on
heath over flint-stone beach wall formation (Prora, August 2018); b) Semi-natural dry grasslands and
scrubland facies on calcareous substrates (Festuco-Brometalia) with interspersed single shrubs and
trees (Mellrichstadt, April 2018); c) Mosaic of Calluna heathland (Genistion pilosae), and xeric sand
grassland (Koelerion glaucae), all-year grazed by cattle and horses, with Betula pendula succession
thinned to 30% wood cover (Oranienbaumer Heide, June 2015); d) Marshes and salt meadows (Glauco-
Puccinellietalia maritimae, Thero-Salicornietea) with scattered scrubs, extensively grazed by cattle
(Peenemünde, May 2017); e) Inland dunes with open grasslands and dry sand heath with Calluna and
Genista, and Cytisus scoparius scrubland, in transition to Pinus sylvestris forest, grazed by Przewalski
horses (Tennenlohe, July 2012); f) Structurally rich, sparse Pinus sylvestris forest with Vaccinium
myrtillus undergrowth (Vaccinio-Pinetum) with manifold inner forest fringes (Weißhaus, July 2016);
g) Forest fringe with smooth transition zone from heathland to forest (Cuxhavener Küstenheiden, June
2019); h) Fine-scale mosaic of open heathlands (purple), Calamagrostis grassland (light-green), and
successional trees (Pinus sylvestris, Betula pendula) (Glücksburger Heide, September 2004), con-
trasting to the agricultural landscape in the background (Photos: (a‒g) H. Culmsee, (h) F. Meyer, Halle
(Saale)).
Abb. 5. Halboffene Landschaften ausgewählter Untersuchungsgebiete: a) Juniperus communis-Forma-
tion auf Zwergstrauchheide über dem Strandwallsystem der Feuersteinfelder (Prora, August 2018);
b) Naturnahe Kalk-Halbtrockenrasen und deren Verbuschungsstadien (Festuco-Brometalia) mit einge-
streuten einzelnen Sträuchern und Bäumen (Mellrichstadt, April 2018); c) Mosaik trockener europäi-
scher Heiden (Genistion pilosae) und subkontinentaler Blauschillergrasrasen (Koelerion glaucae) mit
ganzjähriger Rinder- und Pferdebeweidung sowie Betula pendula-Sukzession, die auf 30 % Gehölzbe-
deckung reduziert wurde (Oranienbaumer Heide, Juni 2015); d) Von Rindern beweidete Sümpfe und
Salzwiesen (Glauco-Puccinellietalia maritimae, Thero-Salicornietea) mit vereinzelten Gehölzen
(Peenemünde, Mai 2017); e) Binnendünen mit offenen Grasflächen und trockenen Sandheiden mit
Calluna und Genista sowie Cytisus scoparius-Gebüschen, die von Przewalski-Pferden beweidet wer-
den, im Übergang zu Kiefern-Wald (Pinus sylvestris) (Tennenlohe, Juli 2012); f) Strukturreicher, licht-
durchfluteter Kiefern-Wald mit Vaccinium myrtillus (Vaccinio-Pinetum) mit vielfältigen Waldinnen-
rändern (Weißhaus, Juli 2016); g) Waldrand mit sanfter Übergangszone von einer offenen Heide zum
geschlossenen Wald (Cuxhavener Küstenheiden, Juni 2019); h) Feinskaliges Mosaik aus offenen Hei-
deflächen (lila), Calamagrostis-Grasland (hellgrün) und Gehölzsukzession (Pinus sylvestris, Betula
pendula) (Glücksburger Heide, September 2004), das in starkem Kontrast zur Agrarlandschaft im
Hintergrund steht (Fotos: (a‒g) H. Culmsee, (h) F. Meyer, Halle (Saale)).

 289
urbanisation, and land abandonment (SUTCLIFFE et al. 2015, BÁLDI & BATÁRY 2011, STOATE
et al. 2009). However, with wood-dominated landscapes and closed forests together making
up about 60% of the study areas, late successional stages largely dominated the decommis-
sioned MTAs.
 Open landscapes covered 12% of the study areas and were the only cover class that
occurred significantly clustered, i.e., as continuous open land. This suggests that manage-
ment measures, such as grazing or mowing, have been taken for preserving open landscapes.
Being part of the national natural heritage scheme and, in addition, in most cases of the
European Natura 2000 protected area system, the studied decommissioned MTAs were not
completely abandoned to natural succession, but, instead, alternative management measures
were implemented in at least part of the areas, such as large herbivore grazing regimes
(LORENZ et al. 2016) or controlled burning (SCHULZE et al. 2015). It apparently is difficult to
substitute the often-incidental disturbance dynamics of military use by other mechanical
measures, because the latter are usually not as severe and often remain spatially fixed by
pasture fences, leased farmland or agricultural support boundaries. In Central Europe, specif-
ic pioneer communities (e.g., pioneer grasslands on sandy soils) have largely declined in
decommissioned MTAs and, although parts of these landscapes may still remain structurally
open, they have been followed by other successional stages (e.g., heathlands, later grassland
stages with closed vegetation cover) (ELLWANGER & REITER 2019). Management options
have been developed for restoring semi-open heathland landscapes by controlled burning
that creates bare soil followed by heathlands and tree succession (SCHULZE et al. 2015). An
experimental study found that topsoil removal and tank driving could fully restore pioneer
plant communities (JENTSCH et al. 2009), though substitution measures should be economi-
cally feasible and top soil removal is often prohibited because of contamination with muni-
tion on these sites. Nevertheless, former MTAs have low nitrogen loads and the subsequent
management, which is usually extensive, is comparable to traditionally managed landscapes
(BUŠEK & REIF 2017). Such open habitats are usually of high conservation value. Thus,
despite the relatively small open area, our study areas harboured substantial populations of
endangered bird species (Fig. 3), which are themselves dependent on mostly relatively rare
and often threatened open habitat types.
 A unique characteristic of our study areas were large semi-open landscapes with a total
cover of 28% of the survey area. We defined semi-open landscapes as transition zones be-
tween open land and forests, in which open habitats (e.g., heathlands, semi-natural grass-
lands) are interlinked with scrubs, single or groups of trees. We found two distinct classes,
sparsely wooded (>20−46% wood cover) and densely wooded (> 46−68%) semi-open land-
scapes (Table 2). Birds associated with these semi-open landscapes made up 61% of all
breeding bird records and 71% of all breeding birds classified ‘threatened’ (Fig. 3, Supple-
ment S1). Thus, this habitat guild is of primary conservation concern and semi-open land-
scapes must be regarded as extraordinary diversity hotspots and refuges for threatened birds.
The high proportion of threatened birds suggests that such semi-open habitat complexes
have become a rare resource in the surrounding Central European landscapes. In the context
of actively used MTAs in the Czech Republic, the number of threatened bird species was
significantly higher in the MTAs than in the control areas (BUŠEK & REIF 2017), and early-
successional stages hosted bird communities with the highest habitat specialisation and
threat level (REIF et al. 2013). Abandoned MTAs also possessed higher number of birds of
conservation concern associated with open habitats than predicted by their total population
size (REIF et al. 2011). Open and semi-open habitats of abandoned MTAs were identified as

290
You can also read