3.4 Introduction to Scanning-Slit Profilers
←
→
Page content transcription
If your browser does not render page correctly, please read the page content below
3.4 Introduction to Scanning-Slit Profilers

The scanning slit beam profiler moves two narrow orthogonal slits in front of a linear
photo-detector through the beam under analysis. Light passing through the slit induces
a current in the detector. Thus, as the slit scans through the beam, the detector signal
is linearly proportional to the spatial beam irradiance profile integrated along the slit.
A digital encoder provides accurate slit position. The photo-induced current signal
is digitized and analyzed to obtain the beam profile in both X and Y from the two
orthogonal slits.
The slit apertures act as physical attenuators, preventing detector saturation for most
beam applications. High dynamic range amplification allows operation over many orders
of magnitude in beam power.
From these profiles, important spatial information such as beam width, beam
position, beam quality, and other characteristics are determined. This technique can
accommodate a wide variety of test conditions. Because slit scanners measure beams
at high powers with little or no attenuation, they are ideal to profile beams used in
material processing.
Carbon dioxide (CO2 ) lasers are widely used in materials processing, and have a 10.6
micron wavelength that cannot be profiled with most cameras. Slit scanners, therefore,
provide an convenient means of measuring high-resolution CO2 lasers with powers up
to and exceeding 1000 watts.

                                                                                                                Beam Analysis
                                                                                                               3.4

                                                                                             JANUARY 1, 2022   213
                               FOR LATEST UPDATES, PLEASE VISIT WWW.OPHIROPT.COM/PHOTONICS
3.4.1 NanoScan 2s

                   Scanning Slit Beam Profiler For High Accuracy Dimensional Measurement
                   NanoScan 2s combines the convenience and portability
                   of direct USB connectivity with the speed, accuracy, and
                   dynamic range that users have come to expect from the
                   Photon NanoScan slit based profilers. The NanoScan 2s is
                   available with a silicon, germanium or pyroelectric detector,
                   which allows it to profile lasers of any wavelength from UV
                   to far infrared, out to 100µm and beyond. With the new
                   NanoScan 2s software package, the user can configure
                   the display interface however it is desired; displaying those
                   results of most interest on one easy-to-read screen, or on
                   multiple screens.
                   The NanoScan slit profiler is the most versatile laser beam
                   profiling instrument available today: providing instantaneous
                   feedback of beam parameters for CW and kilohertz pulsed
                   lasers, with measurement update rates to 20Hz. The natural
                   attenuation provided by the slit allows the measurement of
                   many beams with little or no additional attenuation. The high
                   dynamic range makes it possible to measure beams while
                   adjustments to focus are made without having to adjust the
                   profiler. Just aim the laser into the aperture and the system
                   does the rest!

                   Capabilities
                   NanoScan 2s is a PC-based instrument for the measurement and analysis of laser beam spatial irradiance profiles in accordance with the
                   ISO standard 11146. The scan heads also measure power in accordance with ISO 13694.
                   NanoScan uses the scanning slit, one of the ISO Standard scanning aperture techniques. It can measure beam sizes from microns
                   to centimeters at beam powers from microwatts to over kilowatts, often without attenuation. Detector options allow measurement at
                   wavelengths from the ultraviolet to the infrared.
                   The NanoScan 2s digital controller has 16-bit digitization of the signal for enhanced dynamic range up to 35dB power optical. With the
                   accuracy and stability of the beam profile measurement you can measure beam size and beam pointing with a 3-sigma precision of
                   several hundred nanometers. The software controllable scan speed and a “peak-connect” algorithm allows the measurement of pulsed
                   and pulse width modulated lasers with frequencies of 10kHz and higher*. The NanoScan is also able to measure up to 16 beams, or
                   regions of interest, in the aperture simultaneously.

                   Benefits
                   • Measure any wavelength from UV to very far infrared (190nm to >100µm)
                   • Instantaneous real time display of results; beam found in less than 300ms and updated at up to 20Hz
                   • Waist location can be determined to within ±25µm due to the well-defined Z-axis datum plane of the NanoScan
                   • Measure pulsed and CW lasers
                   • For pulsed beams the pulse rate is measured and reported
                   • From as small as 7µm beams, can be measured directly with guaranteed accuracy and precision
                   • Additional high signal to noise ratio can be achieved with averaging
                   • Z-axis caustic measurements are available with built-in mechanical linear stage control
 Beam Analysis

                   • M2 propagation ratio values available with simple M2 Wizard included with the software.
                   • Any beam result can be charted and monitored over time
                   • Power levels can be monitored along with spatial measurements to determine if losses are introduced by beam adjustments
                   • Log results to text files for independent analysis
                   • Automate the system using optional ActiveX Automation commands, available with the PRO version software and scan heads Samples
                     of automation programs included for Excel, VBA, LabView and Visual Basic.net

                   * The minimum frequency is a function of the beam size and the scan speed. This is a simple arithmetic relationship; there must be a sufficient number of pulses
                   during the time that the slits sweep through the beam to generate a meaningful profile. Please refer to Photon’s Application Note, Measuring Pulsed Beams with a
3.4.1

                   Slit-Based Profiler.

      214        JANUARY 1, 2022
                                                                                FOR LATEST UPDATES, PLEASE VISIT WWW.OPHIROPT.COM/PHOTONICS
NanoScan 2s Configurable User Interface
In addition to new hardware, the
                                                         File Menu      Quick Access Toolbar
NanoScan 2s has an updated integrated                                                                                                     Standard Windows
                                                                Ribbon Tabs              Panel             Title Bar   Ribbon Bar              Controls
software package for the Microsoft
Windows Platform, which allows the user
to display any of the results windows on
one screen. The NanoScan 2s software
comes in two versions, STD and PRO.
The NanoScan 2s Pro version includes
ActiveX automation for users who want to
integrate the NanoScan into OEM systems
or create their own user interface screens
with C++, LabView, Excel or other OEM
software packages.

                                                                Results Window User Notes        Status Bar      Primary Dock Window (note tabs)

See Your Beam As Never Before
The new NanoScan 2s graphical user interface (GUI) allows the user to set the display screens to any appropriate configuration, displaying
those that are of interest and hiding what is not. This means that you can have the information that you want to see, uncluttered by
extraneous output, and you can have all the features you need, visible at once. The screens can be docked or floating with ribbon bars for
the controls that can be visible or hidden as desired. This allows you to take advantage of a large, multi-monitor desk top or maximize the
useful information on a small laptop display.

  Simple docked view of profiles and numerical results                            Both docked and undocked windows: profiles, results, and pointing

                                                                                                                                                                      Beam Analysis
                                                                                                                                                                     3.4.1

            Example of time charts used to monitor focusing process

                                                                                                                                                   JANUARY 1, 2022   215
                                   FOR LATEST UPDATES, PLEASE VISIT WWW.OPHIROPT.COM/PHOTONICS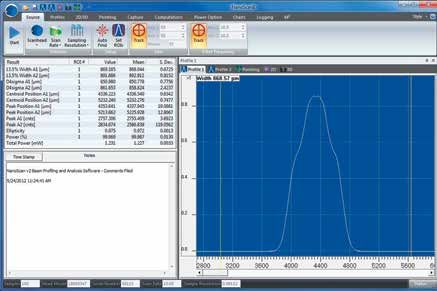
Integrated Power Meter
                   The silicon and germanium detector equipped
                   NanoScan 2s systems include an integrated 200mW
                   power meter.
                   The scanhead comes with a quartz attenuator
                   window that provides a uniform response across a
                   broad wavelength range.
                   This is a relative power meter that has better than            % of power within the aperture
                   1.5% correspondence when calibrated with a                     integrated power measurement
                                                                                  calibrated with customer
                   user-supplied power meter and used in the same                 power sensor
                   configuration as calibrated.
                   The power meter screen in the software shows both
                   the total power and the individual power in each of
                   the beams being measured.

                   Available Detectors
                   The NanoScan 2s is available with silicon, germanium
                   or pyroelectric detectors to cover the light spectrum
                   from UV to very far infrared.

                   Apertures and Slits
                   The NanoScan 2s is available with a variety of apertures and slit sizes to allow for the accurate measurement of varying beam sizes. The
                   slit width defines the minimum beam width that can be measured; due to convolution error, the slit should be no larger than ¼ the beam
                   diameter to provide a ±3% accurate measurement. For this reason the minimum beam diameter measureable with the standard 5µm
                   slit is 20µm. To measure beams smaller than 20µm it is necessary to use the small aperture 1.8µm slit instrument, providing a minimum
                   beam diameter of ~8µm. Because these slits are so narrow, the maximum length limits the aperture to 3.5mm. Contrary to many people’s
                   beliefs, these smaller slits do not improve the resolution of the measurement, only the minimum size of the beam. Therefore, unless it is
                   necessary to measure beams less than 20µm, one would be advised to stick with the 9mm/5µm configurations.

                   The Most Versatile and Flexible Beam Profiling System Available
                   With the available range of detectors, slit sizes and apertures the NanoScan 2s provides the
                   maximum versatility in laser beam profiling. NanoScan 2s adds the convenience and portability of
                   direct USB connectivity: no external controllers or power supplies required to operate the profiler. In
                   addition the rotation mount has been redesigned to provide a stand for vertical operation, if desired.
                   The mount can be positioned in one of two places. If vertical operation is desired the mount is
                   positioned toward the back of the scanhead to expose the stand, which can be affixed to the optical
                   table or stage. If standard horizontal operation is desired, then the rotation mount can be positioned
                   in the forward configuration, maintaining the original length and size of the scanhead.

                   For Higher Powers, Teams up the NanoScan with the LBS-300s
                   In order to measure powers and energies above the limits of the NanoScan, an LBS-300s of the
                   appropriate wavelength rang can be attached to the front of the NanoScan and measure powers
                   up to 1000W and more.
                   The C mount thread of the LBS-300s mates with the C mount thread of the NanoScan. There
 Beam Analysis

                   are various models of the LBS-300s ranging in wavelength from 190nm up to 1550nm and
                   beyond. Alternatively, the Stackable Beam Splitters can be attached to the NanoScan and used
                   to attenuate high power beams.
3.4.1

      216        JANUARY 1, 2022
                                                                         FOR LATEST UPDATES, PLEASE VISIT WWW.OPHIROPT.COM/PHOTONICS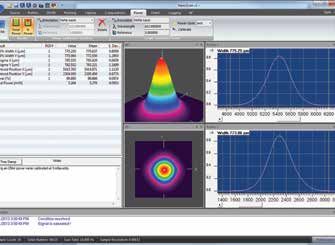
Measured Beam Results
From 1989 through 1996, John Fleischer, founder and past President of Photon Inc., chaired the working laser beam width ISO/DIN
committee that resulted in the ISO/DIN 11146 standard. The final approved standard, available in 13 languages. The standard governs
profile measurements and analysis using scanning apertures, variable apertures, area sensors and detector arrays. NanoScan 2s
measures spatial beam irradiance profiles using scanning slit techniques.

Results measured include:
• Beam Width at standard and user-definable clip levels, including 1/e² and 4σ
• Centroid Position
• Peak Position
• Ellipticity
• Gaussian Fit
• Beam Divergence
• Beam Separation
• Pointing Stability
• ROI Power
• Total Power
• Pulsed Laser Repetition Rate

   Knowing pointing stability is a critical factor in laser performance   Example of the many measurements that can be made and the precision you can expect

M2 Wizard
M-squared (M2) software Wizard is an interactive program for determining the “times diffraction limit” factor M² by the Rayleigh Method.
The M² Wizard prompts and guides the user through a series of manual measurements and data entries required for calculating M².
Used with a user-provided translation stage focusing lens and the M² Wizard in the NanoScan Analysis Software, the user can quickly
and easily determine the times-diffraction propagation factor (M2) of a laser. For automated and automatic M2 measurements the
NanoModeScan option is required.

Pulsed Laser Beam Profiling
In addition to profiling CW laser beams, NanoScan can also profile pulsed laser beams with repetition rate in the 10kHz range and
above. To enable the measurement of these pulsed lasers, the NanoScan profiler incorporates a “peak connect” algorithm and software-
controlled variable scan speed on all scanheads. The accuracy of the measurement generally depends on the laser beam spot size and
the pulse-to-pulse repeatability of the laser. The NanoScan is ideal for measuring Q-switched lasers and lasers operating with pulse width
                                                                                                                                                                    Beam Analysis
modulation power (PWM) control. In the past few years, lasers with pico- and femtosecond pulse durations have begun to be used in
many applications. Although these lasers add some additional complication to the measurement techniques, the NanoScan can also
measure this class of laser.
                                                                                                                                                                   3.4.1

                                                                                                                                                 JANUARY 1, 2022   217
                                      FOR LATEST UPDATES, PLEASE VISIT WWW.OPHIROPT.COM/PHOTONICS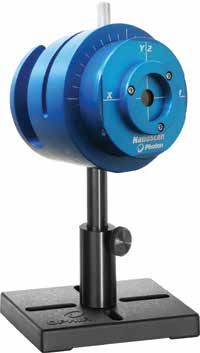
3.4.1.1 Software Comparison Chart

                   Use the Software specification from the existing NanoScan 2s data sheet

                    *Feature                                                                                                                   NanoScan Standard   NanoScan Professional
                    Controls
                    Source                                            ScanHead Select, Gain, Filter, Sampling Resolution, AutoFind,
                                                                      Rotation Frequency, Record Mode
                    Capture                                           Averaging, Rotation, Magnification, CW or Pulse Modes, Divergence,
                                                                      Gaussian Fit, Reference Position, Recompute
                    Regions of Interest (ROI)                         Single or Multiple, Automatic or Manual, Colors
                    Profiles                                          Vertical Scale (1´, 10´, 100´), Logarithmic Scale, Z & PAN (Automatic
                                                                      or Manual)
                    Computation: ISO 13694, ISO 11146                 Dslit, (13.5%, 50% 2 User Selectable Clip Levels), D4Ó, Width ratios,
                                                                      Centroid Position, Peak Position, Centroid Separation, Peak
                                                                      Separation, Irradiance, Gaussian Fit, Ellipticity, Divergence, Total
                                                                      Power, Pulse Frequency, % power
                                                                      Continuous, Rolling, Finite
                    Pointing                                          Centroid or Peak, Accumulate Mode, Beam Indicator, Graph Center,
                                                                      Colors
                    2D/3D                                             2D or 3D Mode, Linear or Logarithmic Scale, Resolution, Fill Contours,
                                                                      Solid Surface, or Wireframe, Clip Level Colors
                    Charts                                            Chart Select, Parameter Select, Aperture Select, Update Rate, Start
                                                                      and Clear
                    Logging                                           File Path/Name, Delimiter, Update Rate
                    M2                                                Rail Setup: Com Port and Length, Connect/Disconnect, Rail Control
                    Views
                    Profiles                                          Displays Beam Profiles for each axis, with optional Gaussian Overlays
                    Results                                           Displays Values and Statistics for Selected results
                    Pointing                                          Displays the XY position of the Centroid or Peak for each ROI,
                                                                      with optional overlays and Accumulate Mode
                    Charts                                            Displays Time Charts for User-selected results
                    2D/3D                                             Displays pseudo 2D/3D Beam Profile
                    M² Wizard                                         An interactive procedure for measuring M2 by the Rayleigh Method
                    File Saving
                    NanoScan Data Files
                    Text Files
                    Data Logging
                    Log to File
                    Reports
                    NanoScan Report
                    Automation Interface
                    ActiveX Automation Server
                    Minimum System Requirements
                    PC computer running windows 7 (32/64) Laptop or Desktop
                    A dual core processor CPU, 2GHz or better
                    2GB of RAM
                    1-USB 2.0 port available
                    At least 250MB of free HDD space
                    1400 x 900 display resolution or better
                    Graphics card w/hardware accelerator
                    DVD-ROM drive
                    Microsoft compatible pointing devices(e.g., mouse, trackball, etc)
                    *Download the NanoScan Acquisition and Analysis Software Manual for a complete description of all Software Features

                   Professional Version Automation Interface
                   For customer who want to incorporate the NanoScan 2s into an automated procedure or to create a customized user interface, the
                   PRO version scanheads include an ActiveX Automation Server that can be used by an Automation Client written in Visual Basic for
 Beam Analysis

                   Applications (VBA), C/C++ or by an application which supports ActiveX Automation, such as Microsoft Excel, Microsoft Word or National
                   Instruments’ LabVIEW. The software package include example of programs written in Excel and LabVIEW in the automation folder.
3.4.1.1

      218        JANUARY 1, 2022
                                                                                                FOR LATEST UPDATES, PLEASE VISIT WWW.OPHIROPT.COM/PHOTONICS
Specifications
Model                         Si/3.5/1.8μm                     Si/9/5μm                            Ge/3.5/1.8μm               Ge/9/5μm           Pyro/9/5μm
Wavelengths                   190-1100nm (1)                  190-1100nm (1)                       700-1800nm                 700-1800nm         190-100μm
Slit size                     1.8μm                           5μm                                  1.8μm                      5μm                5μm
Aperture size                 3.5mm                           9mm                                  3.5mm                      9mm                9mm
1/e2 Beam diameter range      7μm-~3mm                        20μm-~6mm                            7μm-~2.3mm                 20μm-~6mm          20μm-~6mm
Spatial sampling resolution                                                                              5.3nm-18.3μm
Scan frequency                                                                                        1.25, 2.5, 5, 10, 20Hz
Power reading                                                                                            User calibrated
Power aperture window                                                                                   Metalized Quartz (200mW upper limit)              N/A
Laser type                                                                                                CW or Pulsed
Operating range                                                                                   See Operating Space Charts
Damage threshold                                                                                  See Operating Space Charts
Rotation mount                                                                                               Standard
Bus interface                                                                                                USB 2.0
OS supported                                                                                     Windows 7 (64) and Windows 10
Signal digitization                                                                                            16bit
Maximum digitization clock                                                                                   21.4MHz
Maximum update rate                                                                                            20Hz
Data transfer                                                                                          Bulk Transfer Mode
On-board memory                                                                                       64MB mDDR SDRAM
Weight                                                                                                 434g (15.3 ounces)
Operating temperature                                                                                         0-50ºC
Humidity                                                                                              90%, non-condensing
Scanhead dimensions                                                                                  76.8mm L x 63.5mm Ø
Power                                                                                                 USB 2.0 Bus Powered
CPU clock                                                                                                    300MHz
Memory clock                                                                                                 264MHz
Scanning motor                                                                                        Brushed DC, 4W max
Compliance                                                                                           CE, UKCA, China RoHS
Note:                         (1) Between 950nm and 1100nm, there might be a degradation of system performance

Ordering Information
Supported software                            NanoScan Professional (1)                                                NanoScan Standard
Model                                         Item                                   P/N                               Item                    P/N
Si/3.5/1.8μm                                  NS2s-Si/3.5/1.8-PRO                    PH00464                           NS2s-SI/3.5/1.8-STD     PH00456
Si/9/5μm                                      NS2s-Si/9/5-PRO                        PH00465                           NS2s-SI/9/5-STD         PH00457
Ge/3.5/1.8μm                                  NS2s-Ge/3.5/1.8-PRO                    PH00467                           NS2s-Ge/3.5/1.8-STD     PH00459
Ge/9/5μm                                      NS2s-Ge/9/5-PRO                        PH00468                           NS2s-Ge/9/5-STD         PH00460
Pyro/9/5μm                                    NS2s-Pyro/9/5-PRO                      PH00470                           NS2s-Pyro/9/5-STD       PH00462
Software upgrades
NSv2 STD to NSv2 PRO Upgrade                  Upgrade NanoScan v2 Standard version software to the PRO version. This upgrade opens             PH00417
                                              the NanoScan automation feature for those users wanting to integrate or develop their own
                                              interface using Visual Basic for Applications to embed into such applications as LabView.
                                              Return scanhead to factory
Notes:                                        (1) Software includes ActiveX automation feature

                                                                                                                                                                                 Beam Analysis
                                                                                                                                                                                3.4.1.1

                                                                                                                                                              JANUARY 1, 2022   219
                                     FOR LATEST UPDATES, PLEASE VISIT WWW.OPHIROPT.COM/PHOTONICS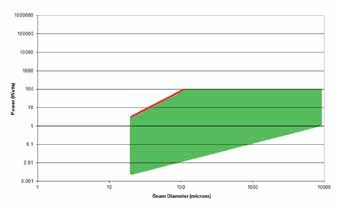
Typical NanoScan Operating Space Charts
                   Operating range is at peak sensitivity of detector. Operating space is NOT absolute.
                   THESE CHARTS TO BE USED AS A GUIDE ONLY.

                                              NanoScan Operating Space                                                      NanoScan Operating Space
                                                  Si/3.5mm/1.8μm                                                                Ge/3.5mm/1.8μm

                     Silicon Detector: Responsivity varies with wavelength. Detects between      Germanium Detector: Responsivity varies with wavelength. Detects between
                     400-1100nm. Peak responsivity is 0.7 amps/watt at 980nm. Detector to        800-1800nm. Peak responsivity is 1.05 amps/watt at 1550nm. Detector to
                     detector responsivity variation can be as great as ±20%.                    detector responsivity variation can be as great as ±20%.

                                                                                       NanoScan Operating Space
                                                                                            Pyro/9mm/5μm

                                                            Pyroelectric Detector: Uniform in response between 0.2 and 20 microns
                                                            wavelength.

                   Power: Average power in the laser beam.
                   Beam Diameter: Assumes a round beam. The operating point for an elliptic beam can be approximated by using the average diameter.
 Beam Analysis

                   For extremely elliptic beams (ratio >4:1), contact Spiricon.
                   Pulsed Operation (                  ): Upper limit of the operating space for pulsed laser measurements.
                   Black Coating Removed (                 ): Slits are blackened to reduce back reflections; blackening begins to vaporize near this line.
                   Slits in pyro detectors are not blackened.
                   Slit Damage (            ): Power density (watts/cm2) where one can begin to ablate and cut the slits.
                   Refer to Spiricon’s Damage Threshold with High Power Laser Measurements document.
                   Left Boundary: The left boundary is 4 times the slit width, where slit convolution error becomes significant to the 5% level for
                   reported 1/e2 diameter of a TEM00 Gaussian beam.
                   Right Boundary: The right boundary is the instrument entrance aperture diameter, which determines the largest beam profile and
3.4.1.1

                   diameter that can be measured. For a TEM00 Gaussian beam the 1/e2 diameter needs to be ≤1/2 the aperture diameter to measure and
                   see the entire profile out to the tails. Similarly for a Flat-top distribution the 1/e2 diameter needs to be ≤~95% of the aperture diameter.
                   To obtain any given clip level diameter for any beam (but not the full profile) ~95% of the aperture is useable.

      220        JANUARY 1, 2022
                                                                              FOR LATEST UPDATES, PLEASE VISIT WWW.OPHIROPT.COM/PHOTONICS
You can also read