885 Use and Verification of ECMWF products in Member and Co-operating States (2021)
←
→
Page content transcription
If your browser does not render page correctly, please read the page content below
885
Use and Verification of
ECMWF products
in Member and
Co-operating States
(2021)

Tim Hewson (Forecast Department)

September 2021
Series: ECMWF Technical Memoranda

A full list of ECMWF Publications can be found on our web site under:
http://www.ecmwf.int/publications/
Contact: library@ecmwf.int

© Copyright 2021

European Centre for Medium Range Weather Forecasts
Shinfield Park, Reading, Berkshire RG2 9AX, England

Literary and scientific copyrights belong to ECMWF and are reserved in all countries. The content of this
document is available for use under a Creative Commons Attribution 4.0 International Public License. See
the terms at https://creativecommons.org/licenses/by/4.0/.

The information within this publication is given in good faith and considered to be true, but ECMWF accepts
no liability for error, omission and for loss or damage arising from its use.
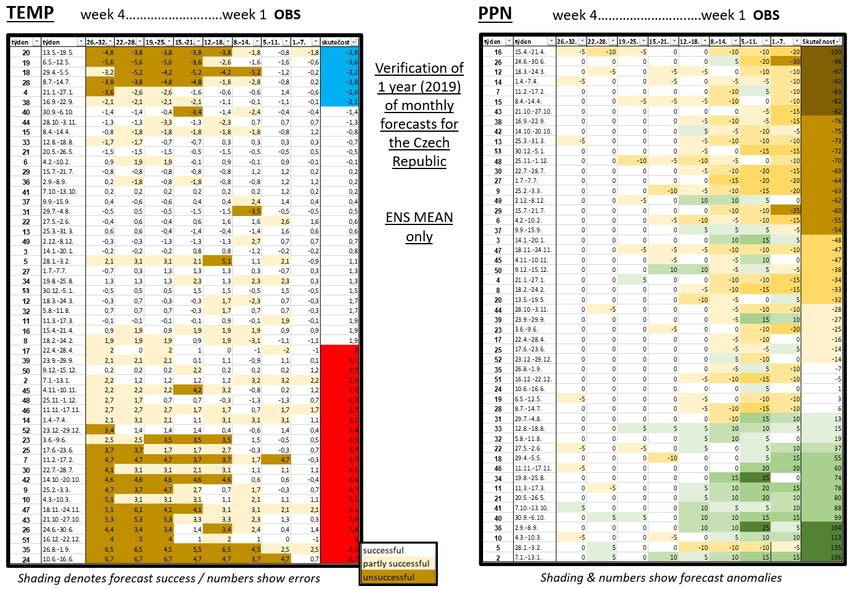
Use and Verification of ECMWF Products (2021)

Abstract
Every other summer Member and Co-operating States report on the application and verification of ECMWF’s
forecast products for the previous two years. ECMWF also gathers feedback in other fora throughout the year.
This report summarises feedback collected between summer 2019 and summer 2021.
Usage of ECMWF forecast products remains widespread across National Met Services (NMSs), from short range
through to seasonal timescales. Very favourable comments regarding outputs and accuracy are commonplace,
notably for the short range and the medium range. There are again plenty of examples of forecasting success in
severe weather situations, e.g. for wintry precipitation, but also some examples of events being missed. Flash
flooding remains very challenging for models in general, with moisture budget terms in certain situations still hard
to disentangle.
In the short range and early medium range ECMWF output is ordinarily used alongside the output of high
resolution, limited area, convection-resolving models (LAMs) and ensembles. Activities here that have expanded
since 2019 are the use of LAM ensembles, downscaling, and automated (and manual) blending techniques.
Blending is designed to extract maximum benefit, and seamlessness, from modelling systems with different
strengths. Post-processing (prior to any blending) is also commonplace, and there are again examples of simple
approaches like bias correction delivering significant gains. Machine-learning (ML) is still just on the horizon for
most NMSs, although Switzerland do already deliver some ML-based operational products. Switzerland are also
running what appears to be the highest resolution LAM ensemble (1.1km).
National Met Services have again performed comparative verification for LAMs, HRES (ECMWF’s 9km model)
and ENS (ECMWF’s 18km ensemble), notably for surface weather. The difference in spatial scale between LAMs
and global models can affect verification results, and countries use a variety of approaches to account for this.
Overall, using a neighbourhood approach and a combined index for precipitation and wind gust, France report
AROME-FRANCE consistently outperforms the global HRES and ARPEGE models. Israel report their LAM
ensemble to be clearly superior to ENS for all variables. More generally, relative to the IFS, LAMs have a clear
advantage for 10m wind prediction, especially for mountains, and some advantages for 2m temperature. Problem
areas for 2m temperature, for many models, are clear calm nights, hot sunny days, and springtime. The scale issues
noted above are especially relevant for fields exhibiting high spatial variability, such as precipitation (and some
other moisture-related variables). Nevertheless, even if not accounting for related ‘double penalty’ issues, the
reports generally show that the LAMs also perform well for precipitation, while for low-level moisture variables
results are less consistent, with IFS often performing better. Interestingly Belgium identified a multi-day drift in
several surface weather variables in IFS forecasts for Belgian sites; we had some awareness of these but are now
investigating further.
New and innovative NMS-designed diagnostics include fire ignition risk from Portugal, based on dry thunderstorm
probability, hail predictors developed in Hungary, and stacked probability bar charts for visibility from The
Netherlands. Services were very positive about ECMWF’s “progressive” forecast products, such as precipitation
type charts, ensemble vertical profiles and ecPoint output, but all manner of new requests continue to be lodged.
The ecCharts tool was widely praised, with a marked and reassuring reduction in the number of complaints about
speed. The Open Charts initiative was also warmly welcomed, even if some issues still need addressing.
There is some customer dissatisfaction with the weak or incorrect signals seen in extended range (monthly) and
(particularly) seasonal forecasts. This dissatisfaction seems to stem from unrealistic expectations linked to the

Technical Memorandum No.885                                                                                       1
Use and Verification of ECMWF Products (2021)

considerable societal benefits that could be realised if accuracy were achieved. Regular reference to verification
statistics alongside new forecasts could quell the misplaced optimism. ECMWF should make this easier; indeed
user desire for more and better verification data, for longer ranges, was highlighted by an online survey in 2021.
The increased uptake of certain Copernicus products (e.g. from ERA5 and CAMS-IFS) was very good to see,
although we would encourage NMSs to consider making more use of the C3S multi-model seasonal forecasts.

1.       Introduction
Every other summer ECMWF invites Member and Co-operating States to submit updated reports on the
application and verification of ECMWF’s forecast products. The NMSs (National Meteorological
Services) submitted their reports, which are now available here: https://www.ecmwf.int/en/publication
s/search?secondary_title=%22Green%20Book%202021%22.
Reports have been provided by Austria, Belgium, Croatia, Czech Republic, Estonia, France, Germany,
Greece, Hungary, Iceland, Ireland, Israel, Italy, Lithuania, Luxembourg, Netherlands, North Macedonia,
Portugal, Romania, Serbia, Slovakia, Spain, Sweden, Switzerland, Turkey and United Kingdom.
A summary of the reports is presented below. Content has been combined with some feedback from
ECMWF’s 2021 UEF meeting, held virtually, and from official triennial Member State/Co-operating
State liaison visits undertaken by ECMWF between July 2019 and June 2021. In chronological order,
“visits” were made to Austria, Lithuania, Latvia, Netherlands, Montenegro, Serbia, Ireland, Estonia,
Switzerland, Belgium, Luxembourg, Turkey, Norway, Sweden, North Macedonia and Finland. The
COVID pandemic led to many of the “visits” being virtual. In using the associated visit reports we
focussed on countries that did not send in an Application and Verification report.
Please note that this report generally only covers aspects recorded in the above fora, and indeed cannot
reproduce everything included there. So whilst we have tried to extract and summarise the most
important aspects in this Technical Memo many will inevitably not be referenced directly.
For the NMS reports contributions had been invited under the following headings:
          1. Summary of major highlights
          2. Use and application of products (direct and “other”)
          3. Verification of products (objective and subjective)
          4. Requests for additional output
          5. References to relevant publications
For section (2) ECMWF encouraged submission of details regarding post-processed products created
using Artificial Intelligence and/or Machine Learning techniques, and also feedback on ECMWF’s Open

2                                                                                Technical Memorandum No.885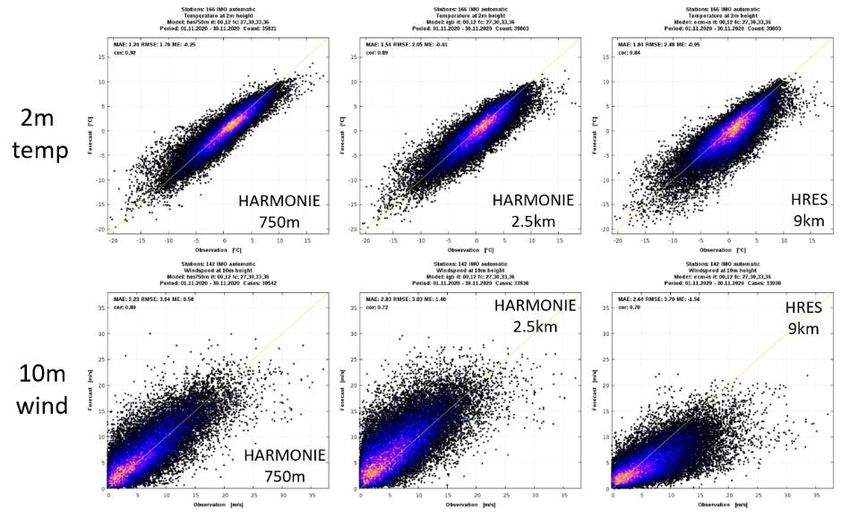
Use and Verification of ECMWF Products (2021)

Charts initiative, that went live in October 2020. For the verification section (3) we encouraged
submission of results from conditional verification, and from comparing Limited Area Ensemble
Prediction Systems (LAM-EPS) with the ENS.
Note also that the ECMWF IFS is generally upgraded each year, which naturally affects aspects of
performance in-year, so summary information presented here should be read with this in mind. During
the past 24 months two new cycles were introduced: 47r1 on 30 June 2020 and 47r2 on 11 May 2021.
Note that the results of ECMWF’s own objective verification are considered separately, in ECMWF
Technical Memorandum 884 (https://www.ecmwf.int/sites/default/files/elibrary/2021/20142-evaluatio
n-ecmwf-forecasts-including-2021-upgrade.pdf).

2.      Use and application of products
Strategies for using ECMWF model output for operational purposes depend largely on the lead time of
the forecasts. Although NMS reports and visits to Member and Co-operating States do not encompass
every forecasting activity, all 30 countries evidently do use IFS data for medium range forecasting, and
the majority also use ECMWF’s monthly (=extended range) and seasonal (=long range) forecasts for
operational purposes. There was also evidence that just about all 30 states represented use IFS data
directly in some way to prepare short range forecasts (up to, say, 48–72h ahead). Some NMS make less
use of ENS than one might expect, particularly for shorter leads. For example Austria indicate that ENS
is used as additional information [to HRES], mainly in critical weather situations, whilst Greece and
Finland highlight that ENS usage centres on day 4 onwards, with HRES output being the focal point at
shorter leads, along with LAMs. Norway indicate that ingesting into their workstations the vast data
volumes available for ENS is technically challenging. Note that with the resolution increases ECMWF
plans for 12-18 months’ time data volumes for ENS will increase markedly.
In the short range ECMWF IFS products are commonly used in conjunction with products from other
sources, notably deterministic Limited-Area Model (LAM) systems, but to an increasing extent LAM-
EPS too. In the vast majority of cases reported, ECMWF IFS data provides boundary conditions (BCs)
for these limited-area systems, which are commonly run four times per day (matching IFS run
frequency) but sometimes run more often, in, for example, ‘rapid update’ mode. Ordinarily LAM
systems use BCs from the “previous” set of IFS runs - typically 6 hours old - to ensure product
timeliness; this seemingly imperfect set up is probably unavoidable. Some LAM-EPS systems use BCs
from more than one global EPS system. In a quick tally of the resolutions reported for LAM systems
used operationally by NMS, the proportions were as follows: ≥4km - 15%; 2.1-3km - 55%; 1-2km -
25%;
Use and Verification of ECMWF Products (2021)

GLOSEA (from UK). Virtually all NMSs seem to provide forecasts of some sort up to lead times of 10
days. Whilst the main operational focus for all Member and Co-operating states is on local weather,
some also have international commitments, for land and sea areas across the world, for which ECMWF
forecasts are used in different ways.

2.1.     Direct use of ECMWF products
At shorter ranges, most NMS forecasters examine ECMWF products alongside output of their main
LAM-based systems, which themselves, as discussed above, usually also incorporate ECMWF input via
BCs. Around day 3 or 4 focus shifts onto using mainly or only ECMWF output. This all means that
ECMWF forecasts are vital for a vast range of operational functions in most if not all the Member and
Co-operating states. Very appreciative comments regarding ECMWF output can be found throughout
the NMS reports.
ECMWF facilitates direct product visualisation through static clickable images on the ECMWF website,
within ECMWF’s complementary tools “ecCharts”, and (related to this) “Dashboard”. All three web-
based tools continue to undergo upgrades and re-design work to improve usability.
A key upgrade to the static clickable image class took place in Autumn 2020 when “Open Charts” went
live; this provided new formats and layouts for pre-existing products, and some new products also, and
went hand-in-hand with opening up free access to a whole range of ECMWF forecasts around the world.
This year ECMWF specifically asked NMSs for feedback on Open Charts; this is summarised in
Section 2.1.5.
ECMWF output can also be viewed in static form on websites internal to NMSs. Some NMSs also
continue to use the ECMWF graphics tool Metview to create plots for forecasters.
ECMWF output is also often viewed directly by forecasters on independently developed dedicated
forecaster workstation systems (such as “NINJO”, “HAWK”, “Visual Weather”, “Synergie”). Most
countries ingest into these a range of ECMWF products (especially from HRES). These workstations
offer one major advantage: they allow many forecast relevant products to be overlaid (e.g. output from
multiple global and limited area models/ensembles, observations, satellite data). However, one
downside of this approach is that it may also ‘prevent’ access to the full range of ECMWF output:
Luxembourg for example highlighted that the “Synergie” system they use is not currently able to ingest
ENS data. Users are again reminded that ecCharts provides a WMS service to facilitate the transfer of
ECMWF data into local workstations.
2.1.1.   ENS and HRES
Whilst the ENS is central to ECMWF’s 10-year strategy it is again clear this year that our HRES
forecasts are still very widely used, and in some NMS, for various reasons, these are used in preference
to ENS output. Evidently the extra resolution provided by HRES brings benefits for many countries,
especially those that are topographically complex, and so it is more meaningful then to compare LAM

4                                                                         Technical Memorandum No.885
Use and Verification of ECMWF Products (2021)
forecasts with HRES than with ENS. Upgrading ENS resolution (to ~10km), as ECMWF will do in
cycle 48r1, should make its usage more appealing in this context.
2.1.2. Severe weather
Another key tenet of ECMWF strategy is to alert forecasters of potential severe events as early as
possible, to facilitate timely issue of accurate warnings. Referring to ECMWF forecasts Croatia say,
reassuringly, that there were “rarely severe weather situations it missed or in which it had big errors”.
The longest lead time at which official warnings can be issued still varies a lot by country; the maximum
seems to still be 7 days, in the UK. Because of these variations the extent to which ECMWF output is
actively used will also vary, with the output of Nowcasting tools and LAMs inevitably given a lot of
weight at short leads. Interpretation in terms of likely societal impact, the use of impact models and
consultancy with emergency services seem also to be growth areas when it comes to issuing warnings.
The UK, Italy and Iceland reference these.
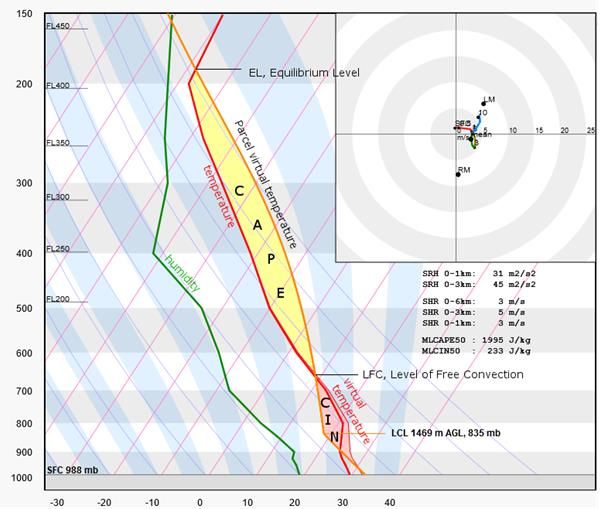
Figure 1: Vertical sounding (Skew-T-log-p), identifying some parameters used to anticipate severe
convective storms. New parameters in cycle 47r3 move away from using temperature in the
construction of CAPE and CIN (a computationally expedient approximation), and use instead virtual
temperature, which is physically correct.
Warning systems are becoming more probabilistic in nature, except perhaps at short leads, and overall
ENS usage seems to be increasing. Whilst the EFI and SOT, which are based on ENS, have been widely
Technical Memorandum No.885 5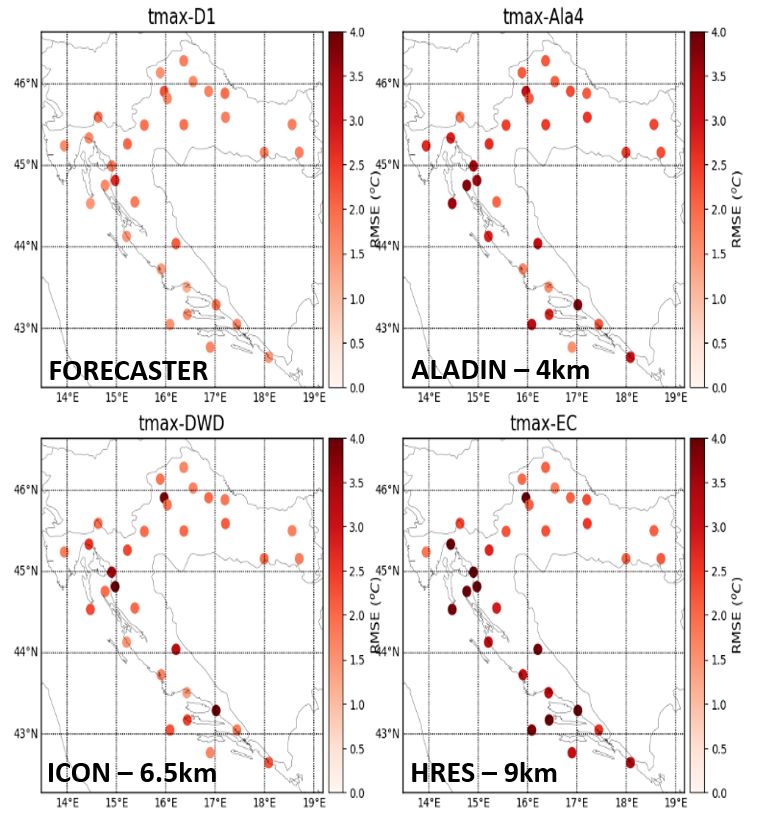
Use and Verification of ECMWF Products (2021)

used to alert forecasters to severe events for many years, usage continues to grow. Many NMS reports
include favourable comments about uptake and usefulness - Greece, Iceland, Ireland, Israel and Spain
all refer to using the EFI in their warning processes. ECMWF naturally encourages this, provided the
limitations are understood. There is an innate link between impacts and EFI/SOT, because of the return
period philosophy that underpins both. Indeed, the EFI should be able to assist with early warnings for
rain, wind, heat, cold and snow, and also, via the CAPE and CAPE-shear EFI/SOT parameters, for
hazards linked to severe convective outbreaks. Croatia give the impression that forecasters are less
happy with the CAPE-based EFI fields than they are with the other parameters. We reiterate that CAPE
is a complex field to deal with numerically, and that over some years, and in collaboration with ESSL,
ECMWF has been gradually upgrading many parameters related to CAPE and CIN. Many new variables
will become available with cycle 47r3 (Oct 2021), and in the following cycle, 48r1, the EFI fields related
to CAPE will also be upgraded (see Figure 1).
Meanwhile some NMSs report continuing usage of probability products (e.g. Spain), which can help
more with threshold-based warnings.
In the last 3 years (2018-2020) ECMWF received a lot of positive feedback regarding the mainly-ENS-
based precipitation type products (meteograms and maps) that had been introduced in 2017. These
products have been praised again, presumably as recognition, understanding and uptake have increased.
For example, in Finland these are viewed as an “excellent product” whilst Croatia say “hugely popular,
gold medal award”. Conversely in their report Estonia requested a probability product for “glaze”, due
to recent events with major impacts. Although glaze is technically freezing rain further investigation
identified that they were particularly interested in knowing when ice would accrete on specific surfaces
such as power lines or roads. Physically, power line accretion and road accretion are different; the former
can be expected when the IFS predicts freezing rain, for the latter the situation is much more complex.
It is now clear that we need to make this distinction clear to users, and so the Forecast User Guide will
be updated accordingly. This example also nicely re-emphasises the benefits of dialogue with users.
UEF provided many examples of positive feedback on ECMWF forecast performance for severe
weather events. For an extreme rainfall/snowfall/flooding case in late December 2020 Montenegro
described our forecasts as “very, very good”. For more examples, often related to severe weather, see
here: https://events.ecmwf.int/event/220/sessions/363/attachments/1222/2279/UEF2021_Hewson_upd
ated.pdf (specifically the answers to question 5).
2.1.3.   ecCharts
ecCharts is actively and increasingly used in many countries. It has many components, and along with
many favourable comments about the facility overall other aspects were singled out by users for special
praise, such as the precipitation-type-related charts, as outlined above, and the vertical profile products
also introduced relatively recently. Comments on these included “useful”, “particularly useful”, “of
great value” and “great potential” from Lithuania, Portugal, Croatia and Finland respectively. As in
previous years there have been some negative ecCharts comments too, about the slow speed, but the
prevalence of these is less, with Montenegro for example now highlighting how speed increased

6                                                                           Technical Memorandum No.885
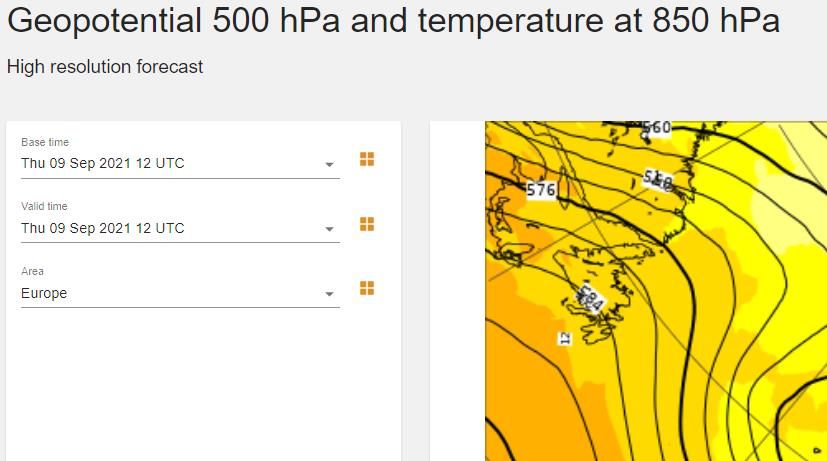
Use and Verification of ECMWF Products (2021)

markedly when they upgraded bandwidths. This indicates that speed is not always a software/ECMWF
issue, although we acknowledge that there is always room for improvement in our services. As usual
there have been many requests for expansions to ecCharts, e.g. changing to hourly data, including cross-
sections, adding a trajectory tool (see also Appendix 1).
2.1.4.   New Products
Many new products appear first within the ecCharts framework, whilst some go into Open Charts. For
example, in the last year extended range CDFs, for week-long time periods, for temperature and
precipitation anomalies, were introduced into ecCharts, whilst EFI and SOT for multi-day snowfall, to
mimic the multi-day precipitation EFI/SOT, are now available in Open Charts, following requests from
some mountainous countries. Feedback on these is encouraged. Meanwhile the cyclone database
products (which again received favourable comments), which have their own web platform, were
revamped in 2021 by ECMWF (see https://www.ecmwf.int/en/about/media-centre/focus/2021/ecmwf-
synoptic-style-weather-charts-set-tools-help-forecast-adverse), in a fashion that paves the way for
ingestion into ecCharts at some future point. ecCharts integration in this way is a long-standing request
from users.
In April 2019 ECMWF introduced a new experimental ‘point rainfall’ product into ecCharts (from a
suite called ‘ecPoint’). This post-processed product aims to deliver reliable and skilful probabilistic
forecasts of rain-gauge-measured rainfall. This is done by adjusting for expected weather-dependant
biases and sub-grid variability, that together make raw ENS forecasts of gridbox-average rainfall less
valid at points, especially in convective situations. In their reports both Switzerland and Hungary report
very positive results in formal assessments of these products - see verification section 3.2. Hungary
highlight that ecPoint product usage is “more and more integrated into the operational practice in general
forecasts and warnings”. Meanwhile Norway state that point rainfall is very useful and works well,
whilst UK say it is one of ECMWF’s more popular products. ECMWF work on creating WMO-
approved grib-format ecPoint files for MARS archiving is nearing completion.
2.1.5.   Open Charts
In the first instance Open Charts aimed to replicate the content of ECMWF’s pre-existing static web
chart offerings. Whilst NMS users had already had access to those, the fact that a login was no longer
needed with Open Charts was highlighted in reports as useful. Indeed, we received many appreciative
comments on the move to an open data policy, and on the Open Charts functionalities.
Regarding Open Charts functionality, the scalable SVG format output adopted was highlighted as
especially useful by several NMS. Meanwhile Portugal said the ability to now quickly intercompare
recent forecasts, for a given time, was also a valuable new tool. This feature is not clearly advertised
however: to access users need to click on the four orange squares next to the “valid time” drop down
menu                                                                                                   (
Figure 2). Some NMS stressed that they find Open Charts particularly useful for examining and

Technical Memorandum No.885                                                                             7
Use and Verification of ECMWF Products (2021)

preparing extended range forecasts - probably because there are more extended range chart offerings
than we had had hitherto.
Some issues with Open Charts have also been reported, related for example to legends, and to the overly
large “thumbnails” on the entry page which necessitated a lot of scrolling, thereby making accessing a
product more difficult than it used to be. Croatia complained about rather frequent error messages - e.g.
“We’re sorry. Package has not been found.” The absence of some metadata in some formats was also
criticised by Italy. Users should always have sight of the base time, the lead time and the step (e.g.
“T+120”), and this is not always the case - in full screen mode for example one cannot see the step or
the base time. Meanwhile the UK indicate that one frustration is that pop-up windows such as
Meteograms (triggered by clicking) do not always fit on the screen. They also requested a new feature -
to be able to set up a default area.

     Figure 2: Screen grab segment from an Open Charts product. Clicking on the clusters of orange
    squares helpfully triggers multiple plots on the same page - e.g. all forecasts for a given valid time.

As always ECMWF will continue investigating and addressing the issues and requests raised by users,
to the extent that resources permit. Related ongoing activities include better documentation for each
product (with links also to the online Forecast User Guide), and introduction of many more new
products. The overarching goal here is to provide, within Open Charts, in some format and with suitable
documentation, access to every variable currently available to ecCharts users (albeit without the
interactive functionality that ecCharts offers).
Finally, please note that ECMWF will soon be closing down the old static chart products web page.
Croatia advised that they are still using these, through “permalinks”, so users there and elsewhere are
strongly encouraged to migrate and change links as soon as possible.

2.2.      Other Uses of ECMWF Output
2.2.1.    Post-processing
Out of the 30 NMS referenced directly in this report, 19 report on activities involving post-processing
of model output. Not all such activities will have been described, so probably the true proportion is

8                                                                             Technical Memorandum No.885
Use and Verification of ECMWF Products (2021)
higher. Technique complexity ranges from simple bias correction, applied to some HRES output in
Iceland, through to advanced post-processing and blending of LAM and global ensembles, using EMOS
and some AI/ML techniques, in Switzerland. Note that simple bias correction can deliver big gains if
the biases are large, and relatively consistent, as in some mountainous countries like Norway and Iceland
where they are actively used. MOS (with deterministic, ensemble mean, or other output) and Kalman
Filter post-processing approaches are relatively common (cited by 4 NMS in each case). Indeed Figure
3 illustrates that Germany are applying MOS techniques to many forecasting challenges, whilst Figure
4 is a nice example of visibility probabilities, based on MOS, from The Netherlands.
Figure 3: The many MOS systems operational at DWD, comprising: terminal aerodrome forecast
(TAF) guidance, localised forecasts (MOSMIX), avalanche guidance (MOSMIX-SNOW), road
maintenance (SWSMOS), energy consumption (GPTMOS) and warning guidance (WarnMOS,
CellMOS).
Figure 4: Example of a KNMI post-processed (MOS) product: a site-specific time sequence of
visibility probabilities, for TAF creation.
Technical Memorandum No.885 9Use and Verification of ECMWF Products (2021)
Blending the output from multiple models / ensembles, to achieve accuracy and seamlessness, seems to
be a growth area (Croatia, Germany, UK, Portugal, Switzerland).
Whilst many variables can be post-processed, those used most often are simple variables where the gains
can be high, and for which extensive data for calibration exists, such as maximum and minimum 2m
temperature and 10m wind (an example is shown in Figure 5). Precipitation is more challenging, and
probably comes third in the list. Occasionally other variables are addressed - Ireland for example apply
a form of quantile regression to ENS solar radiation forecasts for a public web site.
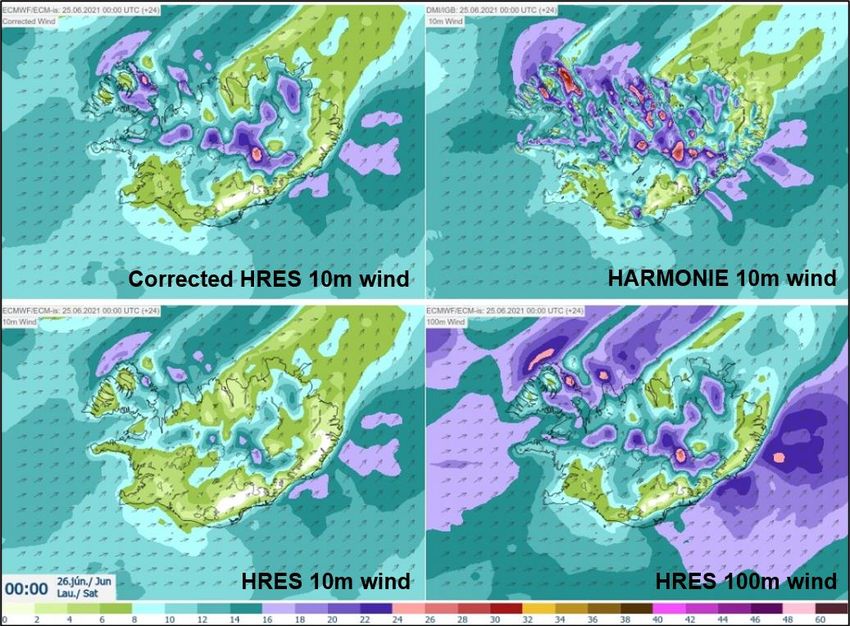
Figure 5: 24-hour forecasts valid on 26 June 2021 00 UTC, showing the effect of simple HRES wind
speed post-processing by Iceland. HARMONIE output, which exhibits small biases compared to
observations, is shown top right. Raw HRES 10m and 100m winds are shown bottom left and right
respectively, whilst the post-processed HRES 10m wind, which is based on these, is shown top left.
Scale shows speeds in m/s (valid for all panels).
References to operational use of AI/ML techniques are hard to find, except in Switzerland’s report.
Admittedly usage impressions depend on what one counts as AI/ML - for example should the decision
trees used by Italy to classify weather phenomena be counted as such? In any case some NMS are now
beginning to do research explicitly into new AI/ML techniques - so this is becoming a growth area.
Another growth area seems to be downscaling, of 2m temperature in particular. Austria again report on
this, with examples from their SAMOS initiative, still in pre-operational mode, which aims for example
to convert IFS output to a 1km grid (in complex terrain) using old 1km INCA analyses as truth for that
grid, for calibration. Spain meanwhile use a somewhat simpler approach to achieve the same goal: lapse
10 Technical Memorandum No.885Use and Verification of ECMWF Products (2021) rate adjustments based on altitude mismatch, combined with an observation-based bias correction. A somewhat similar activity has begun in Romania. For extended/seasonal ranges they now re-create, from forecast anomalies, expected true values of 2m temperature, rainfall, wind, and a drought index, for week-long periods, by post-processing forecasts using a reference 10km scale gridded climate. Care is taken to avoid negative precipitation. This is all aimed at users interested in absolute values but lacking the wherewithal to adjust anomalies themselves. The higher resolution will be an added advantage. The downside will be the low skill levels of seasonal forecasts. It seems the main users are in agriculture. Where post-processing does not deliver gridded forecasts, which is still true in most cases, output is usually provided for a set of sites for which there are observational records. The larger NMS’s site sets often cover the world, whilst smaller NMSs focus on Europe or just their own country. In some instances, the number of predictors used is extremely large: Germany say they are unique in having over 300. These will include not only raw model output but also derived parameters. 2.2.2. Derived Fields Derived products are generated locally in NMSs for many reasons: often for use by NMS forecasters, also for specific societal or economic applications, and sometimes for use by the public. Ordinarily derived products are quite different to those historically provided by ECMWF, although on occasion ECMWF outputs are re-derived in a way that is more tailored to local needs. The range of products offered by NMSs continues to grow slowly, in parallel with increased availability of more diverse raw model output, as the models themselves build in more and more earth system components, and handle those in increasingly realistic ways. Simultaneously users become ever more demanding in the diversity of their requests, and their expectations, as they realise what could be on offer. Discussion by Estonia of poor IFS handling of ice depth for large lakes is a case in point; this would not have even been contemplated 10 years ago. We expect the trends to continue. A step change in this regard will come, for example, when ECMWF introduces a multi-layer snow scheme in cycle 48r1; it is likely that any current usage of snow-cover-related output will then need to adapt. Convection-related indices continue to be generated in many Member and Co-operating States for forecasters (Croatia, Czech Republic, Hungary, Italy, Romania, Slovakia). Sometimes these are created within a forecaster’s workstation (e.g. Visual Weather was mentioned by Croatia, which can incidentally also deliver grib-format derived-field export). Such activities evidently reflect the lack of a discrete representation of the hazard at global model resolution and severe impacts that can arise (even if ECMWF’s point rainfall and lightning density products go some way to addressing such limitations). Due to COVID ECMWF’s plans to examine potential hail predictors were placed on hold, but we hope to restart soon. This could also be of interest for hail suppression activities carried out in some central and eastern European countries. Indeed, Hungary say that from 2021 they have been deriving and using, operationally, hail predictors based on IFS output, so there may be scope here for collaboration. Israel have now introduced a UV index based on the CAMS version of the IFS (C-IFS). Previously they used the standard IFS output; C-IFS output has the advantage of taking aerosol into account. Technical Memorandum No.885 11
Use and Verification of ECMWF Products (2021)
In regard to regime-style clustering of ENS output, ECMWF’s inevitably broadscale approach does not
necessarily suit the needs of every country, and this year several countries again highlight that they are
using local clustering to define locally relevant weather regimes. Some are using software provided by
ECMWF to do this - e.g. Austria, Spain. Austria are also computing probabilities - e.g. for rainfall - for
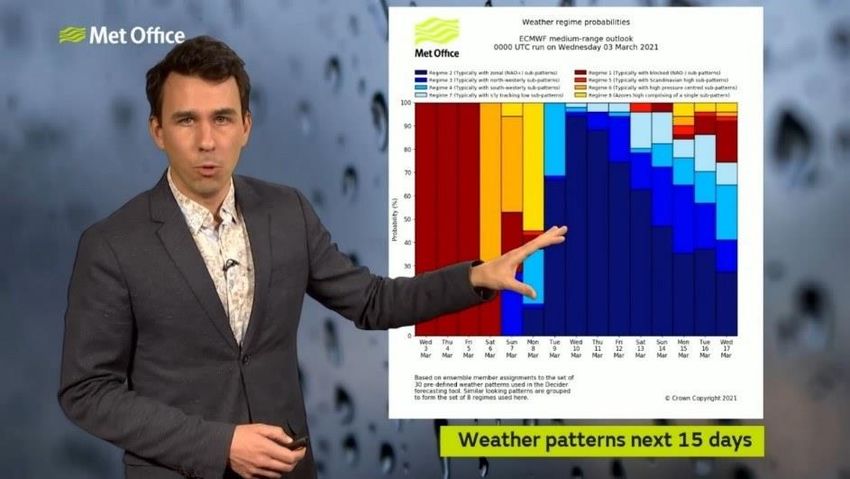
each cluster. This is an interesting new development. Germany are doing something similar. The UK
again report in detail on their own weather regime classification, show how it compares with ECMWF
and illustrate usage in public forecasts (Figure 6).
Figure 6: Aidan McGivern using stacked probability bar charts to highlight a likely change of regime
shown in ECMWF output. Regime definitions come from the Met Office DECIDER system.
Many NMS again list many other miscellaneous derived fields that they generate from IFS output. There
were strong similarities with what was reported in 2019, so for brevity details will not be reproduced
here. Please refer instead to Section 2.2.2 of the related 2020 Technical Memorandum #860:
https://www.ecmwf.int/sites/default/files/elibrary/2020/19461-use-and-verification-ecmwf-products-
member-and-co-operating-states-2019.pdf
2.2.3. Limited Area Modelling
ECMWF output, in one form or another, is used very widely to provide boundary conditions (BCs) for
running limited area models, and in some instances initial conditions (ICs) for the atmosphere and/or
the earth’s surface for those models too. Mostly this happens via the Optional “Boundary Conditions”
Programme which provides additional HRES and ENS forecasts from 06 and 18Z data times, at hourly
intervals.
12 Technical Memorandum No.885Use and Verification of ECMWF Products (2021) The “deterministic” LAM models that use ECMWF data, e.g. via the Boundary Conditions programme, and that are referenced this year, are ALADIN, AROME, ALARO, HARMONIE, COSMO, WRF. WRF-NMM, NMMB, ICON-LAM and INCA (nowcasting). Typically, these run 4x per day, although there is a lot of variability. The LAM-EPS systems, which are essentially based on versions of the above, have the acronyms: A- LAEF, C-LAEF, COSMO-E, MEPS, COSMO-ME EPS, COSMO-IT-EPS, COMEPS, AROME-EPS, IREPS. Sometimes these LAM-EPS systems use ENS data for boundary conditions, although creative alternatives also exist. Often the EPS versions have somewhat lower resolution than their “deterministic” counterparts, because of computational resources, though sometimes this challenge is instead met by running the ensemble much less frequently - e.g. just once per day. Whilst it is difficult to arrive at a representative figure the average maximum lead time for LAM and LAM-EPS systems seems to be ~60h, although the range is large, from 12h in a nowcasting mode (24x/day), out to 144h for one 4km model. Operational domains naturally vary, both in size and location. Most inevitably centre on European countries, though France run also for some overseas domains. The other modelling class where ECMWF forecast data is used, often much more directly, is trajectory, dispersion and air quality modelling. Activity in this field continues to grow but remains largely deterministic. The models/modelling tools referenced, which vary greatly in complexity, are called: NAME, HYSPLIT, MOCAGE, LAGRANTO, CMAQ, EMEP, LOTOS-EURO, FLEXTRA and FLEXPART (the last two come from ECMWF). Some of these run continuously, others can be triggered in the event of (e.g.) a dangerous chemical release. Initialisation data, in the form of chemicals and aerosol, is in some instances provided by C-IFS. Hydrological modelling is a more limited activity in NMS in general, in part because some NMS do not have this responsibility. Nonetheless, the operational MIKE11, DFFGS and HBV hydrological model systems (and one or two others that were unnamed) generally use ECMWF data in one way or another (e.g. to provide rainfall and other input directly, or BC data to a LAM that then provides these). Some NMSs described handling snowmelt and ice jams as problem areas. For countries with coastlines surge, wave and oceanographic modelling can be particularly important, and ordinarily this activity does come under NMS jurisdiction. Reference is made in reports to using the associated high resolution MFWAM, WWM, WW3, SWAN, TSSF, HYCOM and NEMO modelling systems, which in various ways are linked to ECMWF models, even though ECMWF does not perform surge modelling at this time. Norway have shown interest in using the IFS coupled system for storm surge modelling, highlighting that the already-predicted sea surface height takes into account Ekman transport but not the inverse barometer effect, and showing that output could be improved by integrating that too. Finally, Greece again note their use of the MOTHY sea pollution model which can be optionally driven by HRES forecast fields. Technical Memorandum No.885 13
Use and Verification of ECMWF Products (2021)

3.      Verification of ECMWF products
Most countries have reported results from the verification of ECMWF forecasts, generally by
comparison with observations in the local area of interest. Of relevance to interpretation are the dates of
the most recent upgrades to the IFS:

Cycle 46r1 became operational 11 June 2019

Cycle 47r1 became operational 30 June 2020

Cycle 47r2 became operational 11 May 2021

This means that in this year’s reports verification corresponds mainly to cycles 46r1and 47r1, half and
half where data presented is for 2020.
As always, year-on-year changes in IFS performance depend also on the prevalence of different synoptic
patterns, that can have different associated error characteristics, so apparent changes in performance
relative to “last year” need to be treated with caution. Internally, to assess the long-term skill evolution,
ECMWF often subtracts from statistics for the operational forecast the equivalent statistics derived from
a fixed model version run over the same period (currently based on ERA5), which can help eradicate
impacts of this type. Interestingly, the Switzerland report includes examples that use a similar approach.
And when considering a fixed verification period, there are likewise several reasons why one would not
necessarily expect consistency, a priori, in the verification results (e.g. bias, RMSE, etc.) reported by
different countries. Firstly, different weather patterns will have very probably prevailed in different
regions. Secondly, the impact that a certain weather type has on skill and biases will manifest itself
differently in countries with different (fixed) geographical characteristics. For example, issues handling
orographic rainfall, which we know exist, will clearly have little or no impact on a flat country, but can
have a substantial impact in mountainous regions. And thirdly, a range of “interpolation” and “site-
selection” techniques are being used. Full resolution IFS output is not always being exploited, and in
some reports received the method(s) of extraction and interpolation are not entirely clear.
A conditional verification approach (which is now being increasingly used at ECMWF) can help resolve
some of the issues listed above, and results deriving from that are presented below. To improve clarity
such results are now incorporated into sub-sections of 3.1, rather than being grouped in a sub-section of
their own.

3.1.    Direct ECMWF model output (HRES and ENS), and other NWP models

Many reports focus on comparing HRES with LAMs, and for this reason usually centre on the shorter
ranges (up to about 48/60h). However, care is needed in the direct comparison of verification results for
very different spatial resolutions. Different verification methods may be more appropriate to evaluate
high resolution outputs. In reports this has been addressed in different ways, for example to circumvent

14                                                                           Technical Memorandum No.885
Use and Verification of ECMWF Products (2021)

the well know ‘double penalty’ problem when verifying high resolution precipitation forecasts. Overall,
using a neighbourhood approach and a combined index for precipitation and wind gust, France report
AROME-FRANCE consistently outperforms the global HRES and ARPEGE models. Israel have
accounted for observation representativeness in the verification of several parameters. They report that
their LAM-EPS performs better than ENS over Israel for all evaluated variables.

As noted in Section 2, LAM systems often use boundary conditions from the “previous” set of IFS runs
(typically 6 hours old), which as reported by France can adversely affect LAM scores, especially in the
short range.

All the reported comparisons between LAM and ECMWF global model forecasts provided useful
feedback on the capabilities of the ECMWF system. However, given the above considerations, here we
refer to comparison with LAMs when it helps to illustrate particular issues with the ECMWF forecasts.
See the individual country reports for more detailed results.

A common finding, seen in virtually every verification result, for almost every sensible weather
parameter, was that biases in IFS forecasts have a diurnal cycle. Annual cycles are also often presented.
It is not that uncommon for the nature of these cycles to differ between countries. So for reasons of
brevity and clarity we do not discuss every diurnal and annual cycle that has been illustrated in NMS
reports.
Ultimately all models have their strong and weak points, and the impression one gets from the wealth
of statistics provided is that in the short ranges at least (where the bulk of the comparisons were
performed) a multi-model approach to forecasting continues to have considerable merit. Indeed, this fact
nicely underpins the growth in model output blending, discussed above in Section 2. Incidentally,
ECMWF has also had recent involvement in model blending in the EU-funded MISTRAL project (see:
https://rmets.onlinelibrary.wiley.com/doi/full/10.1002/met.2004). Multi-model approaches could be
even more valuable if one could vary weightings according to known synoptically varying performance
characteristics. Whilst such an approach is not yet commonplace in automated blending, it is
undoubtedly being used in subjective fashion by forecasters across Europe.
Verification details, by parameter, are given below. Some of the IFS issues arising here were known
about, and most of these are also listed in the ECMWF’s publicly accessible ‘Known IFS Forecasting
Issues’ web page at: https://confluence.ecmwf.int/display/FCST/Known+IFS+forecasting+issues,
which continues to be regularly updated.
‘Subjective verification’, that often reflects forecasters’ experiences, has again been incorporated in the
sub-sections of this section 3.1. This remains a logical step because perceptions usually mirror features
seen in verification statistics.

Technical Memorandum No.885                                                                             15
Use and Verification of ECMWF Products (2021)

3.1.1.   2 m temperatures
There was this year reasonable consistency in NMS comments regarding systematic errors in HRES.
Many reported that on average minima were not low enough and maxima not high enough. Mean biases
in this regard were of order fractions of a deg C, but in clear, calm conditions are typically much larger.
In such quiescent conditions error magnitude for individual sites is sometimes >10C for minima
(particularly in N Europe in winter), and >3C for maxima. These results tally with ECMWF’s own
verification, daily assessments and case studies, and we continue to work to rectify (for a detailed report
see https://www.ecmwf.int/sites/default/files/elibrary/2020/19849-addressing-near-surface-forecast-
biases-outcomes-ecmwf-project-understanding-uncertainties.pdf). Ireland nicely illustrated a particular
problem period, for minima, during the exceptionally frosty April we had in parts of NW Europe in
2021 (Figure 7). On this occasion the LAM performs slightly better than HRES.

  Figure 7: 2m temperature verification for 9 days in April 2021 (x-axis), for Dublin Airport (station
  03969), for HRES, and HARMONIE-AROME (2.5km resolution). This is based on averages from 4
   runs per day for each, up to T+48, so mostly using 8 values for each forecast data point (see also
                                          dashed grey line).

Regarding the performance of LAMs relative to HRES, as examined by many countries, the conclusion
is that overall LAMs have in general similar or smaller net errors and biases in their 2m temperature
forecasts. Interestingly Croatia show how the global ICON model performed better for Croatia, overall,
even though its resolution is not that different to HRES (Figure 8). In topographically complex countries,
such as Croatia, it may be that there are bigger gains for small resolution increases - on Figure 8 it is
mainly the coastal/island sites where ICON has its main advantage.

16                                                                          Technical Memorandum No.885
Use and Verification of ECMWF Products (2021)
Figure 8: 2m maximum temperature verification (RMSE) for day 2, for Croatia, for 2020, for different
models.
The benefits of higher resolution, even sub-km scale, for reducing errors in general, and indeed outlier
errors, in another mountainous country (Iceland) are nicely illustrated in scatterplot form on Figure 9.
There are some suggestions that spring is the most problematic season, at least in N Europe, for both
HRES and LAMs (Estonia and Sweden highlighted this), with a general cold bias prevailing then. The
difficulties of handling snowmelt and indeed patchy dense snow may be contributing.
Austria and Belgium referenced ENS 2 m temperature verification. Austria show overall slightly smaller
RMSEs, and slightly better (larger) spread, for the C-LAEFS 2.5km ensemble mean, versus the ECMWF
ENS mean (see also Figure 10b for some CRPS scores). Meanwhile Belgium show that ECMWF ENS
mean RMSE’s are comparable with HRES up to about day 3, and then better, at its selected sites. The
lack of a clear benefit from HRES’ higher resolution here may relate to (i) the (lack of) topographic
complexity around the selected sites, and/or (ii) the uncertainties captured by ENS.
Technical Memorandum No.885 17Use and Verification of ECMWF Products (2021)
Figure 9: Deterministic run verification scatterplots for Iceland, for 27-36h forecasts, for Nov 2020,
for 2m temperature and 10m wind speed (see annotation). Approximately 150 stations were used.
3.1.2. 10 m wind
Previous versions of this report highlighted some conflicting wind verification signals. This year there
is more unanimity, partly because some countries have performed more sophisticated investigations
(such as sub-setting by terrain characteristics) and so we can now summarise and itemise “pan-
European” wind forecast characteristics with more confidence:
• IFS generally over-forecasts wind speeds over relatively flat land areas (mean bias ~0.5-3 kts)
• IFS generally under-forecasts wind speeds over relatively mountainous areas (e.g. Figure 9)
• In the warmest part of the diurnal cycle speeds tend to have a negative or zero bias in all areas
• Whilst LAM / LAM ensemble performance varies, almost all such systems outperform the IFS
• IFS gusts are biased to be too strong (by ~2-6 kts on average)
For evidence supporting the penultimate point, from Austria, see Figure 10d, e. And regarding the final
point, note that in cycle 47r3 being implemented in October 2021 there will be a new gust
parametrisation which will reduce IFS gust speeds (see also the example on Figure 19).
A very curious feature seen in some results from Belgium is a gradual if small IFS drift (Use and Verification of ECMWF Products (2021)
ECMWF has followed up on a request by Iceland to reduce roughness lengths over Iceland, to remove
the negative IFS wind speed bias there. Results so far have been inconclusive but work continues.
Figure 10: Ensemble verification results (CRPS) for Austria, for Feb/Mar 2020, for 6 parameters
(panels (a)...(f) see annotation), versus lead time. Note the clear benefit, for 10m u and v wind
components, of 2.5km model resolution.
3.1.3. Precipitation
Precipitation verification results and feedback in 2021 reports have similarities with what has been
reported before, so some details are omitted this year. Readers wanting more information should refer
to earlier version of this memorandum, and this year’s individual reports. At the same time we note, and
appreciate, that more results from LAM-EPS systems are provided this year.
When forecast gridbox rainfall totals are verified against point observations, as is very commonly done
(at ECMWF also), the scale mismatch can result in somewhat negative conclusions regarding frequency
bias (FB), that ordinarily do not reflect true “model issues”. Indeed, LAMs will usually exhibit a “better”
FB than global models (for a current example see Figure 11, top panel), but that will be mainly because
their gridbox scale is closer to the observation scale. ECMWF is now allowing for resolution-dependant
“representativeness” errors in a new way in some of its verification (see: https://www.ecmwf.int/en/eli
brary/19544 accounting representativeness verification ensemble forecasts), and Israel have done this
for the verification of several parameters in their 2021 report (using “spread boost” following Klasa et
al, QJRMS, 2018) .
Technical Memorandum No.885 19Use and Verification of ECMWF Products (2021)
Figure 11: Frequency bias and SEDI (Symmetric Extremal Dependence Index) values of 24h
precipitation forecasts (T+6-30h) for 00 UTC runs of HRES (blue), ALADIN (green) and AROME
(red) models as a function of precipitation thresholds over Hungary for 2020 using SYNOP
observationsUse and Verification of ECMWF Products (2021)
A striking result from Belgium was the linear drift to drier conditions seen between days 1 and 7 in the
ensemble mean precipitation bias (=mean error) - e.g. green dashed lines on Figure 12. This warrants
further investigation by ECMWF, looking at longer leads and other areas.
Figure 12: 6h precipitation verification for Brussels, for Jul 2020 to Jun 2021, showing mean errors
(dashed lines) and mean absolute errors (solid lines), for HRES (blue) and ENS mean (green), for
data times 00UTC (dark) and 12UTC (light). A downward trend in ENS mean error is seen also at
other Belgian sites.
We conclude this sub-section by listing some IFS precipitation forecast characteristics reported by
NMSs (some objectively verified, some not):
i. Insolation-driven convective precipitation starts too early in the day
ii. Convective precipitation is too widespread
iii. Mountainous areas can be too wet / too dry (Norway/Spain respectively)
iv. Precipitation forecasts for some tropical regions are contaminated by biases
v. Unrealistically large totals tend to be predicted in the north-western Andes
vi. Instances of light coastal precipitation are predicted too often (Portugal)
vii. Forecast biases vary according to synoptic type in Greece (for details see Greece’s report)
Users should be ready for some noteworthy changes in IFS representation of precipitation, related to the
new moist physics, that will be seen in cycle 47r3 that goes operational in October 2021. In tandem there
will be changes in verification results, particularly when using short verifying periods. Regarding the
list above, we expect some improvement in aspects (ii), (iv) and (v).
Technical Memorandum No.885 21Use and Verification of ECMWF Products (2021) 3.1.4. Screen-level humidity Eight of the NMS reports referenced screen-level humidity verification, two more than in 2019. These were Austria, Belgium, Estonia, Greece, Hungary, Israel, Sweden and France. References are made to RH and/or dewpoint. Hungary cover both parameters, showing that a somewhat different picture can emerge depending on which parameter one chooses. This is because these variables have a different dependence on 2m temperature, and therefore on errors in that. Notwithstanding this issue, a fairly clear and consistent picture seems to emerge for Europe, similar to what we saw in 2019. This is that in spite of lower resolution the IFS components are very competitive compared to many LAMs, generally showing smaller net errors and smaller biases. However, Israel report that the 2.5km COSMO-based ensemble is consistently better than ENS, and France report that AROME-OM has better RMSE for 2m humidity for all lead times and all the overseas domains that it is used for. Belgium show a curious steady drift to a drier surface layer, on average, in both HRES and ENS (0.5⁰C per 7 days in dewpoint). This is undergoing further investigation by ECMWF. 3.1.5. Cloud This year, in contrast to 2019, we received no feedback on the quality of irradiance forecasts, and indeed also less feedback than in 2019 on cloud forecasts in general. Comments by Sweden strongly suggests that cloud verification really needs to be carefully stratified by weather situation - maybe more so than other variables - to provide meaningful physical insights. With objective evidence as support they say, for example, that in the IFS convective cloud is over-predicted in summer, but conversely that dissolution of such clouds late in the day is too rapid. With such complexities in mind and noting that in other NMS cloud verification was not generally stratified (except sometimes by season), we cautiously summarise the general findings. Norway, Estonia, Portugal and Spain all suggest, sometimes with objective evidence, that the IFS forecasts insufficient low cloud overall. Finland disagree, suggesting that low cloud amounts are too great in summer. In cycle 47r3 we expect low cloud, high cloud and total cloud amounts to all increase somewhat, as a result of the new moist physics package. It will be interesting to see if users notice, and what their reactions are. Finland have also noted that low cloud is over-forecast in very cold conditions in winter. This may be a feature peculiar to colder countries, as different physics can then come into play. Finland’s remark would also seem to be consistent with the prediction of insufficiently low minimum temperatures by the IFS in extreme winter-time conditions. There is clearly interest in cloud base forecasts, which seem to stem from aviation requirements, which can be quite precise. Israel for example suggest that bases tend to be too low along their coastal plains. A concerning IFS model drift is again in evidence in Belgium’s results; average amounts go up in the ENS by 5-10% between day 1 and day 7. 22 Technical Memorandum No.885
Use and Verification of ECMWF Products (2021)

We conclude this sub-section on positive notes: Croatia say that “all [Croatian forecasters] agree that
HRES is very good in differentiating between high, middle and low cloud cover and in cloudiness
forecasting in general” whilst results from Greece indicate that mean biases in HRES, in all seasons,
tend to be less than 5%.
3.1.6.   Sea Ice and Snow Cover
Very little was reported this year relating to verification of snow and sea ice. This may mean that there
were not many issues. However, Serbia highlighted that anticipating snowmelt, for use in hydrological
forecasts, is particularly difficult whilst Estonian forecasters rated the quality of snow depth and
particularly ice depth forecasts as "average”, and relatively low compared to other variables (Figure 13).
Furthermore, Estonia highlighted that ice depth prediction issues for the large lakes Peipus and
Võrtsjärv, and for the Baltic, were quite common, and that these tended to also impact negatively on
predictions of wind and 2m temperature.

  Figure 13: Summary of feedback from 14 Estonian forecasters on the quality of ECMWF forecast
parameters: 1=”very bad” to 5=”very good”. Means are shown, ranked, so left is worse and right is
                                            better.

3.1.7.   Forecaster Impact
Croatia and Hungary illustrate forecaster performance, compared to various global models and LAMs
and ensembles, for maximum and minimum temperatures predictions for sites within their respective
countries. In each case the forecasters perform, on average, better than all the other models. For Croatia
the forecasts are just for day 2; for Hungary they are for days 1 to 6. For Hungary the forecaster achieves
accuracy on day 5 that is, on average, on a par with model forecasts for days 2-4, with more added value
shown for minimum temperature. No post-processed or blended forecasts are included in the
comparisons.

Technical Memorandum No.885                                                                             23
Use and Verification of ECMWF Products (2021)
3.2. Post-processed Products and End Products delivered to users
Portugal describe a simple but effective system for blending post-processed HRES forecasts at short
leads with post-processed ENS mean forecasts at longer leads, for temperature at 700 Portuguese sites.
The system achieves both seamlessness and accuracy, with just a minor accuracy penalty introduced, to
achieve the seamlessness, during the blending stage. This is nicely illustrated in Figure 14 where the
final output (STA, pink) is derived from the green post-processed HRES forecasts on day 1, and the blue
post-processed ensemble mean forecasts from day 5, and a mix of the two (with tapered weighting) in-
between. Only on days 3 and 4 are the RMSEs of STA (slightly) above the most accurate forecast
component.
Figure 14: Accuracy of the various components in Portugal’s post-processing and blending system.
POST-PROC comes from post-processing HRES, MEAN is the ensemble mean value, ENS_BC is the
ensemble mean post-processed, STA is the final output.
Iceland show how their 10m wind post-processing system, illustrated on Figure 5, achieves the desired
speed-dependant bias-correction. And importantly, dangerously high speeds (>20m/s) are (correctly)
predicted to occur far more often than in raw HRES output.
Germany report that their MOSMIX (combined product of ICON-MOS and ECMWF-MOS) point
forecasts show clear advantages of post-processed and combined products (including ECMWF data),
especially for continuous parameters like temperature (less so for precipitation and wind gusts).
24 Technical Memorandum No.885You can also read