Broadly applicable oligonucleotide mass spectrometry for the analysis of RNA writers and erasers invitro
←
→
Page content transcription
If your browser does not render page correctly, please read the page content below
Published online 21 February 2020                                                                    Nucleic Acids Research, 2020, Vol. 48, No. 7 e41
                                                                                                                             doi: 10.1093/nar/gkaa091

Broadly applicable oligonucleotide mass spectrometry
for the analysis of RNA writers and erasers in vitro
Felix Hagelskamp1,† , Kayla Borland1,† , Jillian Ramos2 , Alan G. Hendrick                                                     3
                                                                                                                                   , Dragony Fu           2

and Stefanie Kellner 1,*
1
 Department of Chemistry, Ludwig Maximilians University Munich, Butenandtstrasse 5-13, 81377 Munich, Germany,
2
 Department of Biology, Center for RNA Biology, University of Rochester, Rochester, NY 14627, USA and 3 STORM
Therapeutics, Moneta Building, Babraham Research Campus, Cambridge CB22 3AT UK

                                                                                                                                                                  Downloaded from https://academic.oup.com/nar/article-abstract/48/7/e41/5742835 by guest on 13 April 2020
Received July 29, 2019; Revised January 23, 2020; Editorial Decision February 3, 2020; Accepted February 06, 2020

ABSTRACT                                                                                 (1,2) or transfer RNA (tRNA) (3,4). Many RNA modifying
                                                                                         enzymes add methyl groups to either the nucleobase or the
RNAs are post-transcriptionally modified by dedi-                                        ribose. For example, tRNA methyltransferase 1 (TRMT1)
cated writer or eraser enzymes that add or remove                                        is responsible for the dimethylation of guanosine to 2,2-
specific modifications, respectively. Mass spectrom-                                     dimethylguanosine in tRNA (m22 G) (5) and methyltrans-
etry (MS) of RNA is a useful tool to study the mod-                                      ferase like proteins 3/14 (METTL3/METTL14) methylate
ification state of an oligonucleotide (ON) in a sen-                                     position 6 of adenosine and the epitranscriptomic mark
sitive manner. Here, we developed an ion-pairing                                         m6 A forms in mRNA. In addition to RNA modification
reagent free chromatography for positive ion detec-                                      by methylation, the conversion of adenosine to inosine by
tion of ONs by low- and high-resolution MS, which                                        deaminases such as the adenosine deaminase tRNA spe-
does not interfere with other types of small com-                                        cific enzyme 2/3 (ADAT2/3) has been reported (6). Inter-
pound analyses done on the same instrument. We                                           estingly, many neurological diseases are connected with mu-
                                                                                         tations in RNA modifying enzymes such as TRMT1 (5)
apply ON-MS to determine the ONs from an RNase
                                                                                         and ADAT2/3 (7). In addition to the active decoration of
T1 digest of in vitro transcribed tRNA, which are                                        RNA with modifications, the removal by active demethy-
purified after ribozyme-fusion transcription by auto-                                    lation is also possible. Demethylation of m6 A and its ri-
mated size exclusion chromatography. The thus pro-                                       bose methylated variant m6 Am has been reported in hu-
duced tRNAVal AAC is substrate of the human tRNA                                         man mRNA (1,2). Bacterial RNAs, including tRNA and
ADAT2/3 enzyme and we confirm the deamination of                                         rRNA, are also methylated, however there are no reports of
adenosine to inosine and the formation of tRNAVal IAC                                    active demethylation of enzymatically methylated sites. In
in vitro by ON-MS. Furthermore, low resolution ON-                                       many bacteria, the methylation of adenosine at position N1
MS is used to monitor the demethylation of ONs                                           (1-methyladenosine, m1 A) is not found in DNA or tRNA.
containing 1-methyladenosine by bacterial AlkB in                                        However, alkylation stress can lead to direct m1 A formation
vitro. The power of high-resolution ON-MS is demon-                                      in DNA and RNA. Due to methylating agents, which chem-
                                                                                         ically methylate nucleic acids, bacteria have the ability for
strated by the detection and mapping of modified
                                                                                         active demethylation. This m1 A is removed by the alpha-
ONs from native total tRNA digested with RNase T1.                                       ketoglutarate-dependent dioxygenase AlkB (8). In human
Overall, we present an oligonucleotide MS method                                         tRNAs, m1 A is found in 42% of all tRNAs at position 58.
which is broadly applicable to monitor in vitro RNA                                      m1 A58 has been reported to be substrate to the human ho-
(de-)modification processes and native RNA.                                              mologues of AlkB, namely ALKBH1 (3) and ALKBH3 (9).
                                                                                            The detection of modified moieties in RNA is possible
INTRODUCTION                                                                             by chemical means (10), by sequencing (11) and mass spec-
                                                                                         trometry (MS) (12). Even with the ever-rising number of
Ribonucleic acids (RNA) contain a vast variety of chemi-                                 sequencing techniques, which detect modified nucleosides
cal modifications, which derive from the four canonical nu-                              in whole transcriptomes, MS remains the key technique for
cleosides adenosine, guanosine, uridine and cytidine. Mod-                               characterization of modified nucleosides. RNA MS analyt-
ifications are introduced by dedicated enzymes, sometimes                                ics can be subdivided into three major principles. The first
referred to as RNA writers. In analogy, RNA erasers exist,                               relies on complete enzymatic digestion of the RNA into
which demethylate adenosine in messenger RNA (mRNA)

* To   whom correspondence should be addressed. Tel: +49 089 2180 77724; Email: stkech@cup.lmu.de
†
    The authors wish it to be known that, in their opinion, the first two authors should be regarded as Joint First Authors.

C The Author(s) 2020. Published by Oxford University Press on behalf of Nucleic Acids Research.
This is an Open Access article distributed under the terms of the Creative Commons Attribution Non-Commercial License
(http://creativecommons.org/licenses/by-nc/4.0/), which permits non-commercial re-use, distribution, and reproduction in any medium, provided the original work
is properly cited. For commercial re-use, please contact journals.permissions@oup.com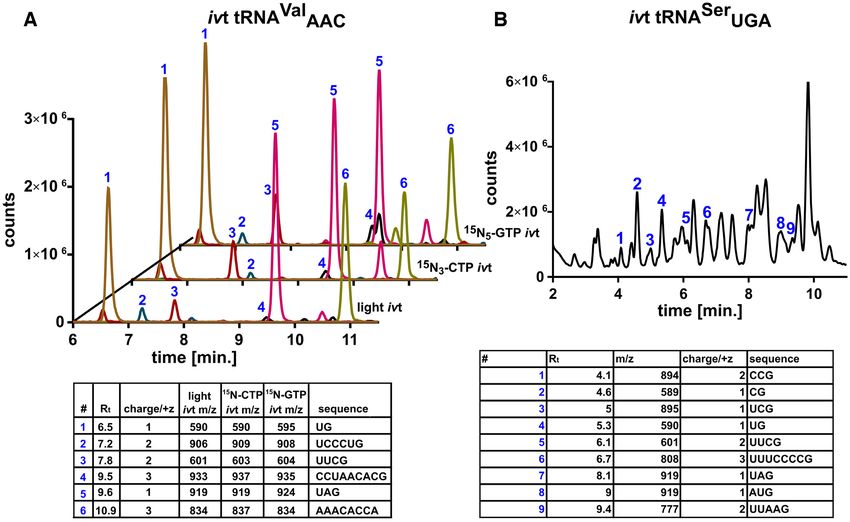
e41 Nucleic Acids Research, 2020, Vol. 48, No. 7                                                                 PAGE 2 OF 16

the nucleoside building block and is highly sensitive with        For other labs, the limitation of using ion-pairing reagents
lower limits of detection (LLOD) in the fmol and amol             is the difficulty of their removal from the instrument. Resid-
range (nucleoside-MS). This technique is commonly used            ual ion-pairing reagents stay on the LC system and interfere
for detection (12), quantification (13) or discovery (14,15)      with other types of chromatography and in addition they
of modified nucleosides. The second uses enzymes, which           reduce the sensitivity of the mass spectrometer. To over-
only partially digest the RNA and smaller oligonucleotides        come this problem ion-pairing reagent free chromatography
(ON) emerge (in this manuscript referred to as ON-MS).            can be used on a reverse phase (RP) column (34). Here, the
In the case of ON-MS, some of the sequence context sur-           retention behavior of oligonucleotides is unexplored. An-
rounding a modified nucleoside is preserved and the tech-         other alternative is chromatography on a hydrophilic inter-
nique is used to place modified nucleosides in known and          action liquid chromatography (HILIC) column which will
unknown RNA sequences. Here, the pioneering work of               allow separation in a similar fashion to ion-pairing chro-
the McCloskey (16,17), Limbach (18) and Suzuki (19) lab           matography (35). Both methods are reported in combina-
have largely contributed to the establishment of ON-MS.           tion with negative ionization mode MS detection and are

                                                                                                                                   Downloaded from https://academic.oup.com/nar/article-abstract/48/7/e41/5742835 by guest on 13 April 2020
Disadvantages of this bottom-up approach are the loss of          thus not applicable for labs with mass spectrometers that
(most) sequence information, congestion of peaks in a small       preferably operate in positive ionization mode. Recently, a
mass range, which mess up spectra, as well as the detec-          method was presented which used positive ionization detec-
tion loss of low-abundant-modified RNAs by domination             tion of oligonucleotides after ion-pairing chromatography
of their unmodified counterparts (20–22). The third princi-       (36). Thus, laboratories have currently the option of doing
ple of MS-based RNA analytics is the analysis of full-length      classical ON-MS (ion-pairing reagent chromatography in
RNAs (top-down-MS) at sophisticated mass spectrometers            negative ionization mode), ion-pairing reagent free ON-MS
which has been pioneered by the Breuker lab (23–26). Top-         in negative mode or ion-pairing chromatography in positive
down-MS of RNA is suited for many types of modifica-              mode. Thus, there is currently no method available which
tion and it reveals the sample heterogeneity. It provides a       overcomes both limitations for a broad application of ON-
high sequence coverage and information without a time-            MS.
consuming digestion step. The disadvantage of top-down               A general challenge for MS-based modification analysis
approaches is the need for RNA shorter ∼60 nts and the            is its non-quantitative nature. For quantification, the signal
available dissociation steps in the MS field are low-efficiency   intensity of an analyte must correlate with its concentration
processes. Another challenge is the underdevelopment of           or amount. In MS, the signal intensity depends of course
back-end bioinformatic tools. Nevertheless, quantitation of       on the amount of analyte, but in addition on a multitude
modified nucleobases has been also shown by top-down-             of other parameters such as salt load, ionization properties
MS (27). Both bottom-up- and top-down-MS approaches               of the analyte, instrument parameters and so on. These de-
utilize MS/MS analysis and the underlying RNA dissocia-           tection fluctuations make quantification by MS a challeng-
tion reactions have been reviewed (28). From the perspective      ing task, which can only be done by using stable isotope
of instrumentation, high-resolution mass spectrometers are        labeled internal standards (SILIS) of the analyte of inter-
ideally suited for the MS and MS/MS analysis of RNA and           est. For nucleoside-MS, this problem has been overcome by
its fragments. Instruments, such as time-of-flight, iontrap       synthetic (37) or biosynthetic (13,38) preparation of stable
or orbitrap MS, deliver the necessary resolution to deter-        isotope labeled nucleosides. For ON-MS, biosynthetic ap-
mine the charge state of the ONs and they allow sequence          proaches have been reported (39,40). Another elegant way
prediction based on their accuracy. Low resolution instru-        to solve the problem was presented by the Limbach lab
ments, such as triple quadrupole MS, are not commonly ap-         (41). They performed the enzymatic digest of the unknown
plied for oligonucleotide MS analysis as they lack the reso-      RNA in the presence of H2 18 O, which results in oxygen-18
lution to distinguish similar ONs and to clearly determine        incorporation into the oligonucleotide 3 -phosphate. As a
the charge state of an ionized ON.                                third option, in vitro transcribed RNA is prepared in the
   In contrast to top-down-MS, bottom-up-MS relies on             presence of stable isotope-labeled nucleoside triphosphates
the chromatographic separation of the ONs to solve the            (NTP) that is then used as an internal standard (42,43).
problem of congested MS spectra. The liquid chromatog-               Although ON-MS has become a powerful tool for anal-
raphy is achieved by using an RP-18-based column and              ysis of RNA modifications within their sequence context,
an ion-pairing reagent such as triethyl-ammonium-acetate          it is not commonly applied. Due to the benefits of ON-
(TEAA), which separates the oligonucleotides by their             MS, we developed a TEAA free chromatography, which
length. The eluting oligonucleotides are then analyzed in         separates the ONs not by length, but by chemical compo-
negative ionization mode by a high-resolution mass spec-          sition of the sequence. In this manuscript, we describe the
trometer and sequenced according to their fragmentation           development and separation principle of the method us-
pattern (29,30) or modification footprints (31). With TEAA        ing synthetic ONs. Detection is achieved by low-resolution
dependent flow chromatography (32), it is now possible to         and high-resolution MS in positive ionization mode. We
analyze 2–5 ng of purified tRNA isoacceptors (∼80–200             present MS/MS data for the analyzed ONs and determine
fmol pure tRNA) and determine the sequence and modifi-            the LLOD in various detection modes. We describe the au-
cation status of these tRNAs (33). Due to the common use          tomated purification of unlabeled and stable isotope labeled
of organic bases as ion-pairing reagents for ON separation        in vitro transcripts of tRNAVal AAC and tRNASer UGA by ri-
and thus negative ionization, oligonucleotide MS is mostly        bozyme fusion transcription. These in vitro transcripts and
used in labs with liquid chromatography coupled mass spec-        native tRNA from HEK cells are analyzed by our ON-
trometry (LC-MS) instruments dedicated for ON analysis.           MS method. To verify correct folding of the produced tR-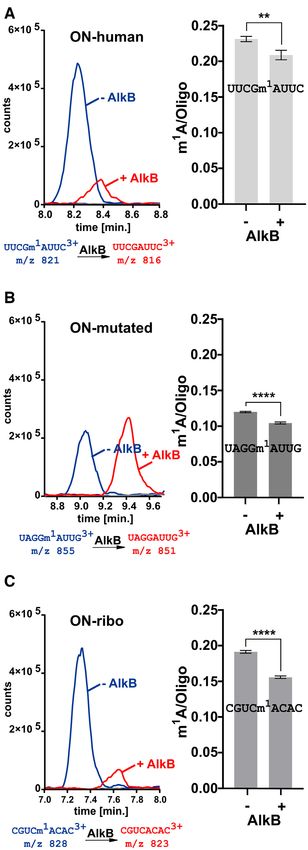
PAGE 3 OF 16 Nucleic Acids Research, 2020, Vol. 48, No. 7 e41
NAs, we use the adenosine-to-inosine deaminating enzyme 30 min at 3000 × g, or through single tubes (VWR, Part-
ADAT2/3 on tRNAVal AAC . Inosine formation is observed number: 516-0229) at room temperature for 7 min at 5000 ×
by both nucleoside-MS and ON-MS. Importantly, these ex- g. The filtrate was mixed with 1/10 Vol. of 10× yeast SILIS
periments are done on the same day using the same in- (stable isotope labeled internal standard) (38) for absolute
strument which highlights the compatibility of our ON-MS quantification.
method with sensitive small compound analysis. Further-
more, we use the developed ON-MS method to monitor
Nucleoside mass spectrometry
the demethylation of short oligonucleotides containing 1-
methyladenosine by bacterial AlkB in vitro. For nucleoside-MS measurements, a liquid chromatogra-
Overall, we provide a method for automated purifica- phy unit (1290 Infinity II, Agilent Technologies, Wald-
tion of RNA transcripts and a broadly applicable ON-MS bronn, Germany) equipped with a diode-array detector
method for instruments commonly used for other types of (DAD, Agilent Technologies) was used that was interfaced
small compound analysis, especially nucleoside analysis. with a triple quadrupole mass spectrometer (G6470A, Ag-
Downloaded from https://academic.oup.com/nar/article-abstract/48/7/e41/5742835 by guest on 13 April 2020
ilent Technologies) via an electrospray ionization (ESI)
MATERIALS AND METHODS source (Jet Stream, Agilent Technologies). For separation of
nucleosides, a Synergi Fusion-RP column (Phenomenex® ,
Salts, reagents and nucleosides Torrance, California, USA; Synergi® 2.5 m Fusion-RP
All salts, solvents and reagents were obtained from Sigma 100 Å, 150 × 2.0 mm) at 35◦ C and a flow rate of 0.35 ml/min
Aldrich (Munich, Germany) at molecular biology grade un- were used. The eluents were 5 mM NH4 OAc, brought to
less stated otherwise. All solutions and buffers were made pH 5.3 with glacial acetic acid (buffer A), and pure acetoni-
with water from a Millipore device (Milli-Q, Merck, Darm- trile (buffer B). The gradient started at 100% A for 1 min,
stadt, Germany). Nucleosides: adenosine (A), cytidine (C), followed by an increase of solvent B to 10% over 5 min.
guanosine (G) and uridine (U) were purchased from Sigma From 5 to 7 min, solvent B was increased to 40% and was
Aldrich. 1-methyladenosine (m1 A) and inosine (I) were pur- maintained for 1 min before returning to 100% solvent A
chased from Carbosynth (Newbury, UK). in 0.5 min and a 2.5 min re-equilibration period. The QQQ
mass spectrometer was operated in dynamic multiple reac-
tion monitoring (dMRM) mode between 1.1 min and 9 min
Oligonucleotides with a cell accelerator voltage of 5 eV. Operating parame-
All oligonucleotides were delivered in a stock concentration ters: positive-ion mode, skimmer voltage of 15 V, cell accel-
of 100 M in water and are listed in Supplementary Table erator voltage of 5 V, N2 gas temperature of 230◦ C and N2
S1. gas flow of 6 l/min, sheath gas (N2 ) temperature of 400◦ C
with a flow of 12 l/min, capillary voltage of 2500 V, nozzle
voltage of 0 V and nebulizer at 40 psi. The detailed mass
AlkB in vitro assay spectrometric parameters for each nucleoside are given in
An aliquot of bacterial AlkB protein (Peak Proteins, Supplementary Table S2.
Cheshire, UK) was thawed on ice. Every assay was per-
formed in a volume of 50 l with a final concentration of Calibration for nucleoside mass spctrometry
50 mM TRIS HCl pH 7.5, 15 mM KCl, 2 mM L-ascorbate,
300 M ␣-ketoglutarate, 300 M Fe(II) (NH4 )2 (SO4 )2 For calibration, synthetic nucleosides Cytidine, Uridine,
× 6H2 O. L-ascorbate, ␣-ketoglutarate and diammonium Guanosine, Adenosine, 1-methyladenosine (m1 A) and In-
iron (II) sulfate hexahydrate stock solutions were made osine (I) were weighed and dissolved in water to a stock
afresh. A total of 10 M of the synthetic RNA oligonu- concentration of 1–10 mM. Calibration solutions ranging
cleotide was incubated with 1 M AlkB enzyme. All assays from 0.15 to 500 pmol for each canonical nucleoside and
were incubated at 37◦ C for 1 h and immediately stopped af- from 0.15 to 500 fmol for each modified nucleoside were
terward by filtering through a molecular weight cut-off fil- prepared by serial dilution (1:10). The calibration solutions
ter (VWR, Partnumber: 516-0229) for oligonucleotides or were mixed with 1/10 Vol. of 10× yeast SILIS and ana-
RNA precipitation for tRNA in vitro transcripts, respec- lyzed by nucleoside-MS. Data were analyzed using Agilent’s
tively. Quantitative or Qualitative Software. The absolute amount
determined for m1 A and I was normalized to the amount
of injected RNA as determined by the absolute abundance
tRNA digestion for nucleoside mass spectrometry
of all four canonical nucleosides (38).
Up to 1 g RNA in 30 l aqueous digestion mix were di-
gested to single nucleosides by using 0.2 u Alkaline Phos-
Mammalian cells
phatase, 0.02 u Phosphodiesterase I (VWR, Radnor, PA,
USA) and 0.2 u Benzonase in 5 mM TRIS (pH 8.0) HEK 293T and HeLa ACC 57 cells (DSMZ, Braunschweig,
and 1 mM MgCl2 . Furthermore, 0.5 g tetrahydrouridine Germany) were cultured in Dulbecco’s Modified Eagle
(Merck, Darmstadt, Germany), 1 M butylated hydroxy- Medium (DMEM). DMEM medium was prepared by dis-
toluene and 0.1 g pentostatine were added. The mixture solving 8.4 g DMEM powder D5030 in 1 l pure water. Be-
was incubated with the RNA for 2 h at 37◦ C and filtered fore sterile filtration, carbonate and phenol red were added
through 96-well filterplates (AcroPrep™ Advance 350 10 K to a final concentration of 3.7 g/l NaHCO3 and 0.0159 g/l
Omega™, PALL Corporation, New York, USA) at 4◦ C for phenol red. Stocks of glucose (225 g/l) and L-glutamine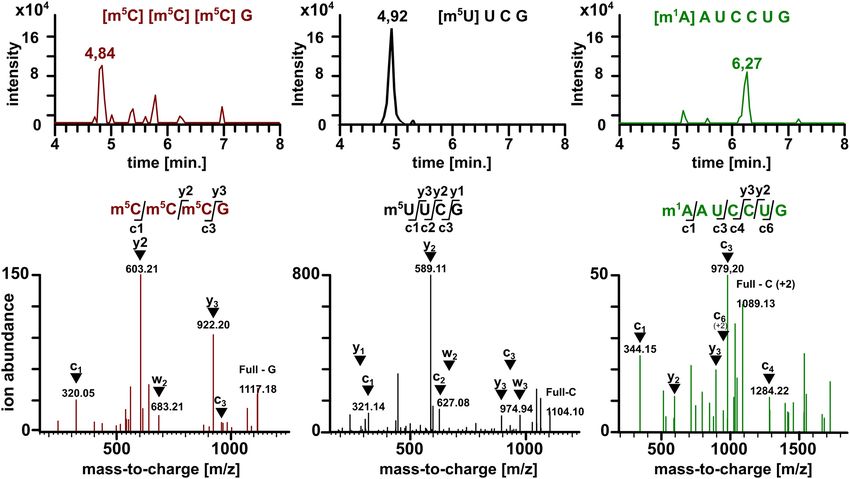
e41 Nucleic Acids Research, 2020, Vol. 48, No. 7 PAGE 4 OF 16
(15 g/l) were prepared and sterile filtered. These solutions incubation at −20◦ C. The RNA was pelleted by centrifuga-
were added to the DMEM medium before usage to a final tion (12 000 × g, 40 min, 4◦ C), washed with 70% ethanol
concentration of 4.5 g/l glucose, 0.584 g/l L-glutamine and and resuspended in 30 l water.
10% fetal calf serum (FCS). The methionine concentration
was 0.15 g/l in the final media. For splitting, the cells were Size exclusion chromatography (SEC)
treated with TrypLE Express (Gibco, Carlsbad, CA, USA).
The cells were incubated and cultivated at 10% CO2 atmo- For purification of tRNA from total RNA or purification of
sphere. tRNA in vitro transcripts from precursor products, size ex-
clusion chromatography (SEC) was used on an Agilent 1100
HPLC system (Degasser, G1279A; Quad Pump, G1311A;
RNA isolation ALS, G1313A; COLCOM, G1316A; VWD, G1314A; An-
alyt FC, G1364C). For method development, three columns
HEK and HeLa cells were harvested directly in cell culture
with 7.8 × 300 mm, 2.7 m particle size from Agilent
flasks using 1 ml TRI-Reagent® per 25 cm2 . Isolation was
Downloaded from https://academic.oup.com/nar/article-abstract/48/7/e41/5742835 by guest on 13 April 2020
(Waldbronn, Germany) were tested. The SEC-3 (Partnum-
performed according to the manufacturer’s protocol with
ber: 5190-2511 reported by Dedon lab (44)), the Advance-
chloroform (Roth, Karlsruhe, Germany). The RNA was fi-
Bio 300 Å (Partnumber: 1180-5301) and the AdvanceBio
nally dissolved in 30 l water.
130 Å (Partnumber: 1180-5350).
The column temperature was set to 40◦ C for native tRNA
PCR purification using the Advance Bio 300 Å and 60◦ C for in
vitro transcript purification using the AdvanceBio 130 Å.
All polymerase chain reactions (PCR) were performed in For elution, a 1 ml/min isocratic flow of 0.1 M ammonium
a total volume of 50 l with a final concentration of 1- acetate was used. Eluting RNA was detected at 254 nm with
fold Phusion Buffer HF (New England Biolabs, Ipswich, a diode array detector. The eluted RNA was collected by a
MA, USA) and 0.8 M forward and reverse primer. The fraction collector and the eluent was evaporated (GeneVac,
sequence of templates and primers are given in Supplemen- EZ-2 PLUS, Ipswich, UK) to a volume of ∼50 l before
tary Table S1. Additionally, 1 l dNTPs, 0.5 l Phusion ethanol precipitation. The purified RNA was dissolved in
polymerase and 100 ng of the desired DNA template were 30 l water for further enzymatic assays or MS analysis.
added. All samples were amplified with the same PCR pro-
gram: 95◦ C for 2 min, 95◦ C for 30 s for 20 amplification Handling guide for SEC columns
cycles, 57◦ C for 30 s for 20 times and 68◦ C for 1 min for
20 times. At the end of the program, the PCR reaction was For prolongation of the column lifetime, it is essential to
incubated at 68◦ C for 1 min and was cooled down to 4◦ C. avoid sudden pressure changes. Thus we recommend to run
Every PCR reaction was performed twice and pooled after- a conditioning method, which slowly increases the flow rate
ward for the T7 in vitro transcription. from 0 ml/min to 1 ml/min within 20 min. For tRNA pu-
rification from total RNA, a column temperature of 40◦ C
is sufficient. For purification of in vitro transcripts, 60◦ C
T7 in vitro transcription yielded better separation results. Note: Column lifetime is
The total volume of the T7 in vitro transcription was 200 l. shortened at 60◦ C and thus long exposures to high temper-
A total of 100 l PCR product were added to T7 buffer mix atures should be avoided. After use, the column was stored
and T7 enzyme (TranscriptAid T7 High Yield Transcription in 0.05% NaN3 .
Kit, Thermo Fisher Scientific, Waltham, MA, USA) and
1.6 l of each rNTP (14 N-rNTPs were provided by the kit, RNA concentration and quality measurements
15
N-rNTPs were purchased by Silantes, Munich, Germany, The RNA concentration was determined with an Implen
Partnumber.: 121306100). The mixture was incubated for Nanophotometer NP 80 (Munich, Germany). For quality
2 h at 37◦ C and 600 rpm. After 2 h incubation, the sample control of SEC purified in vitro transcripts, the Agilent 2100
was treated with 2 l T7 enzyme mix and 5 l 50 mM MgCl2 Bioanalyzer (Small RNA analysis chip, Partnumber: 5067-
and incubated for additional 2 h. After another 2 h incuba- 1548, Agilent, Waldbronn, Germany) was used.
tion, the sample was treated again with 2 l T7 enzyme mix
and 5 l 50 mM MgCl2 and incubated for additional 2 h
to improve the yield of the transcription. In total, the tran- Isoacceptor purification
scription was finished after 6 h. DNA template was removed The procedure was adapted from Hauenschild et al.
by addition of 4 l DNase 1, which is provided in the kit, (45). For tRNA isoacceptor purification, pre-purified to-
1 h at 37◦ C. In the next step, MgCl2 was added with a fi- tal tRNA was used. The sequence of the biotinylated 2 -
nal concentration of 5 mM and the sample was incubated deoxyoligonucleotide probes is listed in Supplementary Ta-
at 60◦ C for 1 h to auto-catalytically cleave the precursor in ble S1.
vitro transcript into its target tRNA. Prior to RNA precip-
itation, the sample was centrifuged at 5000 × g for 5 min at
Purification of ADAT2/3
room temperature to remove the insoluble pyrophosphate
of the transcription reaction. The supernatant was precipi- Open Reading Frame sequences encoding for human
tated by addition of 0.1 Vol. of 5 M ammonium acetate and ADAT2 and ADAT3 were cloned into the petDuet plas-
2.5 Vol. of ice-cold ethanol (100%) followed by overnight mid. ADAT2 was cloned into Multiple Cloning Site (MCS)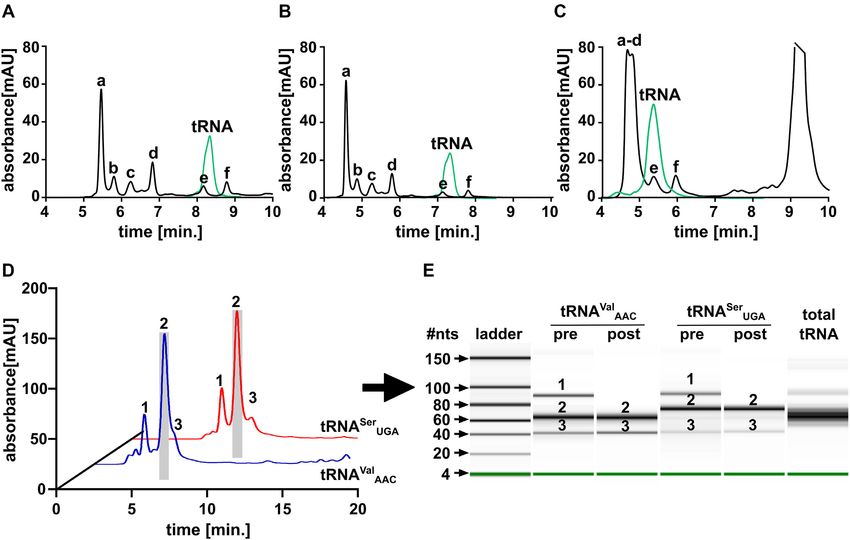
PAGE 5 OF 16 Nucleic Acids Research, 2020, Vol. 48, No. 7 e41
1 which allows fusion with a HIS tag. ADAT3 was cloned aration of oligonucleotides, a Synergi Fusion-RP column
into MCS2. BL21DE3 RIPL Escherichia coli cells (Agilent) (Phenomenex® , Torrance, CA, USA; Synergi® 2.5 m
were transformed with the above plasmid. Starter culture Fusion-RP 100 Å, 150 × 2.0 mm) at 35◦ C and a flow rate of
was grown to an O.D of 0.1–0.5, and inoculated into a 0.35 ml/min were used. The eluents were 10 mM NH4 OAc
larger culture to an O.D of 0.05 and cells were induced with (pH 7.0) (buffer A) and pure acetonitrile (buffer B) (Carl-
Isopropyl--D-thiogalactoside (IPTG) at an O.D. of 0.6– Roth, Karlsruhe, Germany; LC-MS grade, purity ≥95.95).
0.8. After induction, E. coli were grown at 20◦ C for 15 h. The gradient started at 100% buffer A, followed by an in-
Cells were harvested and lysed by sonication in a buffer con- crease of B to 5% over 10 min. From 10 to 12 min, buffer
taining 20 mM TrisHCl pH 7.6, 5% glycerol, 0.1% Triton, B was increased to 50% and was maintained for 1 min be-
1 mM Dithiothreitol (DTT), 0.1 mM (Phenylmethylsul- fore returning to 100% buffer A and a 4 min re-equilibration
fonylfluorid) PMSF, 500 mM NaCl, 25 mM imidazole. Cell period. For source optimization experiments a shorter gra-
lysates were oscillated with HisPur Colbalt Resin (Thermo dient was used starting at 100% buffer A, increased to 2%
Scientific # 89964) at 4◦ C for 2 h. Beads were washed 3× buffer A over 1 min, increased to 10% A by 4 min, then to
Downloaded from https://academic.oup.com/nar/article-abstract/48/7/e41/5742835 by guest on 13 April 2020
with buffer containing 20 mM TrisHCl pH 7.6, 5% Glyc- 50% A by 5 min, held at 50% A for 0.5 min then returned to
erol, 0.1% Triton, 1 mM DTT, 0.1 mM PMSF, 300 mM 100% A. The same re-equilibration period as the previous
NaCl and 25 mM imidazole. Elution of protein was car- method was used. The QQQ mass spectrometer was oper-
ried out with above buffer containing 300 mM imidazole. ated in full scan (MS2Scan), between 500–1000 m/z with
Elution buffer was exchanged to buffer containing 20 mM a fragmentor voltage of 100 V and a cell accelerator volt-
TRIS, 5% Glycerol, 0.1% Triton, 150 mM NaCl and 1 mM age of 5 V in positive ionization mode. For determination
DTT. Expression and purification was verified by sodium of CID spectra, collision energies of 5–40 eV were used and
dodecyl sulphate-PAGE (polyacrylamide gel electrophore- the instrument operated in Product Ion Scan mode. Mass
sis) followed by western blotting. Quantification of purified transition of ONs were used in a targeted MRM method.
protein was carried out by Coomassie with BSA size stan- Data were analyzed using Agilent’s Qualitative Analysis
dards. Final concentration of ADAT2/3 was ∼8 ng/l. Software.
High-resolution mass spectra of oligonucleotide ions
ADAT2/3 assay were recorded by a Thermo Finnigan LTQ Orbitrap XL
with a heated electrospray ionization (HESI) source was op-
An aliquot of ADAT2/3 protein was thawed on ice. A to- erated in positive ionization mode with a capillary voltage
tal of 6 l tRNA substrate (115 ng/l) were incubated in of −10 V and temperature of 310◦ C. The spray voltage to
6 l water and 6 l melting mix. The melting mix buffer was 3.3 kV, and the atmospheric pressure chemical ionization
prepared with 30 mM TRIS pH 7.5 and 1 mM ethylenedi- (APCI) temperature was set to 135◦ C. Sheath, auxiliary and
aminetetraacetic acid. To denature the tRNA, the mix was sweep gases were set to the following respectively 5, 35 and 7
heated to 95◦ C for 2 min and immediately placed on ice for arbitrary units. MS1 specta were collected from 200 to 1000
3 min for tRNA folding. In the next step, 3 l folding mix m/z and data-dependent acquisition (DDA) set to acquire
was added and incubated for 20 min at 37◦ C. The folding MS2 spectra of the top three most abundant ions. Data ac-
mix buffer was prepared with final concentrations of 333 quisition and analysis was completed on the Thermo Xcal-
mM HEPES pH 7.5, 20 mM MgCl2 and 333 mM NaCl. A ibur software platform.
total of 9 l of ADAT2/3 was added to obtain a total re-
action volume of 30 l and incubated for 1 h at 37◦ C and RESULTS
immediately stopped afterward by RNA precipitation with
300 l LiClO4 in acetone (2%). After incubation at room Exploring the applicability of a TEAA-free chromatography
temperature for 5 min, the sample was centrifuged at 5000 for oligonucleotide mass spectrometry
× g for 5 min. The supernatant was discarded and the tRNA In a first step, we wanted to find a TEAA (triethylammoniu-
pellet was solved in 20 l milliQ water for further analysis. macetate) and other ion-pairing reagents free chromatogra-
phy for separation of oligonucleotides which might be com-
tRNA digestion for oligonucleotide mass spectrometry patible with commonly used mass spectrometers and small
RNase T1 was diluted to a 10 U/l solution by mixing 2 l compound analysis. A literature search, to avoid ion-pairing
of the RNase T1 stock (186 U/l, Sigma-Aldrich, Munich, reagents, revealed a method from 1994, where an RP-18 col-
Germany) with 35.2 l TRIS pH 7.5 (25 mM). The diluted umn was used for separation of tRNA isoacceptors (46).
RNase T1 should be stored at 4◦ C. Up to 1 g RNA was Here, the elution was achieved by a gradient of simple am-
digested with RNase T1 at 37◦ C for 1 h in a total volume monium acetate and acetonitrile, which is comparable to the
of 50 l with final concentrations of 25 mM TRIS pH 7.5, separation procedure of nucleosides (38). Inspired by this
100 mM NaCl and 1 U/l RNase T1 and 0.2 u/l Alkaline early work, we tested the separation of synthetic oligonu-
Phosphatase. The digested samples were filtered through cleotides (ON) on our nucleoside column (Phenomenex,
a molecular weight 10 kDa cut-off filter (VWR, Dreieich, Fusion-RP) using a 10 mM ammonium acetate buffer and
Germany, Partnumber: 516-0229) and analyzed by MS. acetonitrile for elution. Due to the negatively charged phos-
phate backbone of RNA, we did not expect good reten-
tion on a hydrophobic RP-18 column. However, due to the
Oligonucleotide mass spectrometry
special column material of the tested column, we observed
For oligonucleotide MS measurements, the instrument de- excellent retention for the tested ONs. As the UV chro-
scribed in the nucleoside-MS section was used. For sep- matogram (260 nm) in Figure 1A shows, the tested 8-mere41 Nucleic Acids Research, 2020, Vol. 48, No. 7 PAGE 6 OF 16
Downloaded from https://academic.oup.com/nar/article-abstract/48/7/e41/5742835 by guest on 13 April 2020
Figure 1. Separation and detection of synthetic oligonucleotides (ON) by MS. (A) UV chromatogram ( 260 nm) of various ONs (20 pmol injection)
separated by our ion-pairing reagent free chromatography. (B) Detection of the ONs from (A) by MS using positive ionization. (C) Detection of the ONs
from (A) by MS using negative ionization. (D) Mass spectrum of the first eluting ON from (A) in positive ion mode (black) and negative ion mode (gray)
on a low-resolution triple quadrupole instrument. The charge state is determined by the pattern of sodium charges in the spectrum. (E) Mass spectrum of
the first eluting ON from (A) in positive ion mode (black) on a high resolution Orbitrap instrument.
ONs elute first, followed by 9-mer ONs and 5-mer ONs. To on the chemistry of the present nucleobases and not on the
understand which properties of the ONs influence the re- length of the ON. From our data, we conclude that the re-
tention behavior, we used ONs, which only differ in one nu- tention behavior of ONs in our TEAA-free system depends
cleobase in their sequence. As shown in Figure 1A, the cy- on two factors: the distribution of nucleobases and the se-
tidine containing 8-mer elutes first, while the exchange to quence. We observe no rules which allow prediction of ON
a uridine leads to better retention. The permutated 8-mer elution.
with adenosine is retained most on the column. In the 5- In a next step, we connected our developed chromato-
mer, we observe a better retention of the cytidine contain- graphic system with our low resolution triple quadrupole
ing ON compared to its U containing permutation. In case (QQQ) mass spectrometer. We tuned the instrument in both
of the 9-mer ONs, the deamination of one adenosine into negative and positive ionization mode using the tune mix
inosine leads to reduced retention. In these sequence con- supplied by the manufacturer and determined the opti-
texts, we clearly see a dependence of the retention behavior mal source parameters for sensitive detection of ON 13PAGE 7 OF 16 Nucleic Acids Research, 2020, Vol. 48, No. 7 e41
(CCUAACACG) (Supplementary Figure S1). With these described (47). On the low resolution QQQ instrument, we
parameters, we scanned for the eluting ONs in a mass range analyzed ON 13 and ramped CID energies from 0 to 30 eV.
of m/z 500–1000 in positive and negative ionization mode. The recorded product ion scans are displayed in Figure 2A.
We received MS signals of all tested ONs below 10 nt in With increasing collision energy, the signal of the precur-
both positive and negative ionization mode (Figure 1B/C). sor ion decreases, while multiple new signals appear in the
Our instrument is commonly operated in positive ionization spectra. At higher collision energies, the most prominent
mode, and thus it was no surprise to find a substantially product ions in positive ionization mode are protonated
higher sensitivity in positive ionization mode. We attribute nucleobase fragment ions. At energies around 15–20 eV, c
this observation to the fact that the instrument is only op- and y ions become apparent (Figure 2B). Due to the low
erated in positive ion mode with the respective buffers for resolution of a QQQ instrument, the charge state of these
ideal protonation in the ESI source. Thus, the ionization c- and y-ions cannot be determined and thus QQQ MS is
efficiency in negative ion mode is reduced. On other in- not suitable for de novo sequencing. The signal to fragment
struments, the sensitivity is higher in negative mode com- matching in Figure 2B and for other ONs in Supplemen-
Downloaded from https://academic.oup.com/nar/article-abstract/48/7/e41/5742835 by guest on 13 April 2020
pared to positive mode (47). We recommend assessment tary Figure S4 was only possible due to the known sequence
of the most sensitive ionization mode on every mass spec- of the ON and the use of the Mongo oligonucleotide tool
trometer by running a mixture of short synthetic ONs. The (https://mods.rna.albany.edu/masspec/Mongo-Oligo). CID
addition of the modifier 1,1,1,3,3,3-Hexafluor-2-propanol analysis on the high resolution MS produced more c- and
(HFIP) did not improve the detection in positive or neg- y- fragment ions of known charge states and thus de novo
ative ion mode. Due to the common use of our instru- sequencing is theoretically possible (Supplementary Figure
ment in positive ion mode and the higher sensitivity, we de- S5).
cided to use the positive ionization mode for further anal- Low resolution instruments such as our used QQQ mass
yses. We used the mongo-oligo mass calculator tool (https: spectrometer are commonly used for the sensitive detection
//mods.rna.albany.edu/masspec/Mongo-Oligo) to compare and quantification of small compounds. In our hands, the
our experimental signals with the predicted signals. For the LLOD and lower limits of quantification (LLOQ) of modi-
tested ONs, we observed the predicted m/z signals, com- fied nucleosides is in the single digit fmol range or even amol
monly of the +2 charge state for 5 mers, +3 charge for 8 range (38). For ON analysis, we injected dilutions of ON
mers and +4 charge for 10 mers (Supplementary Figure S2). 13 and ON 14 and found LLODs/LLOQs of 200 fmol in
The charge state of an ON is commonly calculated with the MS2Scan mode, 800 fmol in MS/MS mode and 800 fmol
natural abundance of carbon-13 on high-resolution instru- in Product Ion (PI) Scan mode for sequence determina-
ments. The difference between the 12 C-m/z value and the tion purposes (Figure 2C). For isolated tRNA isoacceptors,
13
C-m/z value is ∼1 in a +1 charge state, ∼0.5 in a +2 charge the lowest sensitivity was achieved with a TEAA dependent
state, ∼0.3 in a +3 charge state, etc. On a low-resolution in- nano-LC setup (33). With nano-LC, 2–5 ng tRNA (∼80–
strument, such as the used QQQ MS, the natural isotope 200 fmol) are sufficient for analysis which is comparable to
abundance is not resolved and cannot be used to predict our results.
the charge state. As an alternative, the difference between Although the sensitivity towards ONs is lower compared
the (multi-) protonated ion and the sodium charged ion can to small molecule analysis, it is sufficient to analyze ONs
be used. In a +1 charge state, the difference is 22 units, in derived from synthesis, in vitro experiments or potentially
a +2 charge state it is 11 units (charged by one protona- even native RNAs.
tion and one sodium cation), in a +3 charge state it is ∼7
units (two protons and one sodium cation), etc. Our mass
Preparation of in vitro transcribed tRNA by SEC
spectrum for the C-permutated 8-mer ONs revealed a main
signal at m/z 808.1 (protonated species) and a m/z 816 for To expand the field of application, we wanted to use our
the Na+ -charge and thus we conclude a +3 charge state of method on partial RNA digests of full-length in vitro tran-
this ON (see Figure 1D). For the 8-mer ONs, other charge scripts and also native RNAs. Thus, we decided to pro-
states are of minor abundance (see full mass spectra in Sup- duce two human tRNAs by ribozyme-fusion in vitro tran-
plementary Figure S3). scription and analyze the transcripts after RNase T1 di-
In addition to the analyses of ONs by low resolution MS, gestion by ON-MS. After transcription, the cleaved tran-
we wanted to test the compatibility of our method with a script is commonly purified by PAGE and the ribozyme and
high resolution mass spectrometer. The instrument was op- the full-length transcript are removed (49). However, PAGE
timized with the 9-mer ON 13 and the optimal parameters purified RNA always contains small amounts of polyacry-
were chosen according to the results given in Supplemen- lamide, which potentially interacts with later MS. Thus, we
tary Figure S1. As shown in Figure 1E and Supplementary adapted a previously described method based upon size ex-
Figure S2, all tested ONs were detectable by high-resolution clusion chromatography (SEC, SEC-3 column) that is rapid,
MS in positive ionization mode. On this instrument Na+ automatable and produces clean RNA (44). We have found
adducts were of minor abundance and protonated species the AdvanceBio SEC column to be more robust and thus
dominated the MS spectra. recommend this column for tRNA purification from total
MS of oligonucleotides is commonly used to determine RNA. We supply a detailed handling guide to prolong col-
the sequence and location of modified nucleosides (26,48). umn lifetime to several hundred injections in the materi-
For this purpose, fragmentation of the ONs by collision- als and methods section. A comparative profile of an RNA
induced-dissociation (CID) is a useful tool and the behav- ladder (1000 nts to 50 nts) loaded onto these two 300 Å
ior of ONs in positive and negative ionization mode is well columns is shown in Figure 3A and B. Especially at the usede41 Nucleic Acids Research, 2020, Vol. 48, No. 7 PAGE 8 OF 16
Downloaded from https://academic.oup.com/nar/article-abstract/48/7/e41/5742835 by guest on 13 April 2020
Figure 2. Collision-induced dissociation (CID) and sensitivity of oligonucleotides on a low resolution triple quadrupole mass spectrometer (30 pmol
injection). (A) MS/MS spectra of the 8-mer CCUAACACG at various collision energies (CID 0–30 eV). The emergence of base fragments is indicated
with [B+H]+ . (B) MS/MS spectrum of CCUAACACG at a CID energy of 15 eV. The resulting fragments are assigned to the known sequence by using
(https://mods.rna.albany.edu/masspec/Mongo-Oligo). Base fragments are abbreviated with C––cytosine, A––adenine and G––guanine. (C) LLOD for the
ONs U(U/C)UCCCCG in MS scan mode (left), targeted MS mode (middle) of the mass transition 808.1→112 and 808.5→112 and MS/MS scan mode
using the precursor m/z 808.1 and 808.5. The upper graphs are above the LLOD, the lower graphs are just below the LLOD.
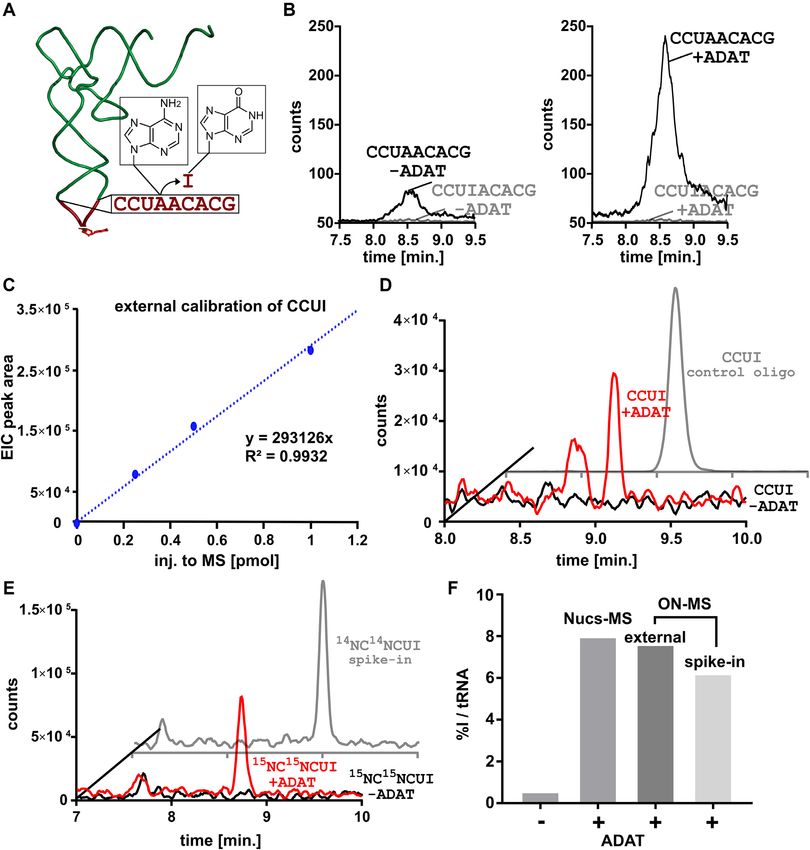
column temperature of 60◦ C, both columns nicely separate For the sake of column preservation, we tested the chro-
the 50 and 80 nts marker from the longer RNAs >150 nts. matographic resolution at lower temperatures. We find suf-
As expected, native tRNA elutes at the same time as the 80 ficient separation of the small 80 nts from the larger RNAs
nts marker, which indicates that secondary structures play (>150 nts) at 40◦ C (Supplementary Figure S7). We have ap-
no role in the separation of RNAs. Thus, these columns plied the AdvanceBio 300 Å SEC column at 40◦ C in several
are ideal for separation of large RNAs such as ribosomal studies for the purification of tRNA from total RNA (5,50–
RNA (rRNA) and mRNA from the smaller tRNAs. The 51). The purification was always reliable and thus we recom-
AdvanceBio column is also available with a 130 Å pore size. mend this column with the developed parameters for tRNA
We tested the separation efficiency of this column with the purification.
ladder and as it is to be expected, the large RNA markers For the purification of tRNA from ribozyme-fusion in
can no longer be separated due to reduced interaction with vitro transcription, both 300 Å and 130 Å pore size columns
the smaller pores (Figure 3C). The 130 Å column is less suit- have been tested. tRNASer UGA is an 85 nts long tRNA
able for the separation of total RNA. However, it has a po- and fused with the ribozyme fusion transcript is 135 nts in
tential for the separation of RNAs smaller 80 nts, e.g. tRNA length. The fusion transcript auto-catalytically cleaves itself
and tRNA-derived fragments (tRF or tiRNA) (Supplemen- into the 85 nts long tRNA and the 40 nts long ribozyme.
tary Figure S6). As shown in Figure 3D, the tRNA peak is separated fromPAGE 9 OF 16 Nucleic Acids Research, 2020, Vol. 48, No. 7 e41
Downloaded from https://academic.oup.com/nar/article-abstract/48/7/e41/5742835 by guest on 13 April 2020
Figure 3. SEC of RNA for automated purification (A)-(C) Separation of an RNA ladder (black) of a: 1000 nts, b: 500 nts, c: 300nts, d: 150 nts, e: 80 nts
and f: 50 nts. For comparison, the elution of total tRNA is shown in green. (A) SEC-3, 300 Å (B) AdvanceBio SEC 300 Å (C) AdvanceBio SEC 130 Å (D)
Purification of T7 in vitro transcribed tRNAVal AAC (blue) and tRNASer UGA (red) on a 130 Å column at 60◦ C. Peak 1: tRNA-ribozyme fusion product,
Peak 2: tRNA, Peak 3: ribozyme; (E) Quality control of the T7 transcription mix before purification (pre) and after SEC separation (post) for tRNAVal AAC
and tRNASer UGA on an automated gel-electrophoresis system. 1: tRNA-ribozyme fusion product, 2: tRNA, 3: ribozyme
the full-length transcript, while the cleaved ribozyme partly Overall, SEC purification of ribozyme-fusion transcribed
co-elutes with the tRNA (130 Å column at 60◦ C). We col- tRNAs is an alternative to purification by PAGE. The com-
lected the tRNA peak and analyzed the fraction by high- plete transcription mix can be loaded onto the SEC column
resolution automated electrophoresis (Bioanalyzer). Here, without pre-purification and within 20 min the pure tRNA
we find that some of the ribozyme (40 nts) is still detectable fraction is received in a volume of 500–1000 l in 0.1 M
in the tRNA fraction but the full-length transcript (135 nts) ammonium acetate. Concentration of the tRNA product is
is completely removed (Figure 3E). If necessary, the collec- possible by subsequent solvent evaporation and/or ethanol
tion of the tRNA peak is possible in a smaller time win- precipitation.
dow or second purification round and thereby the ribozyme
can be completely removed (Supplementary Figure S8). Af- Analysis of RNase T1 treated tRNA by oligonucleotide mass
ter successful purification of the comparably long tRNASer , spectrometry
we were curious whether purification of a tRNA with short
variable loop is possible by our automated system. For this With the tRNA transcripts in hand, we were ready to test
purpose, we prepared a fusion-transcript of tRNAVal AAC . our LC-MS method by injecting a partial digest of the pro-
The full-length transcript is 124 nts long, the tRNA itself 76 duced tRNAs. For this purpose, 1 g of each transcript
nts and the ribozyme again 40 nts. For this tRNA, the size was incubated with RNase T1. The enzyme was removed by
difference between tRNA and the ribozyme is only 36 nts. molecular weight cut-off filtration and 200 ng (∼8 pmol) of
As a rule of thumb, SEC separation of biomolecules is pos- the resulting ON mixture were injected onto the LC-QQQ
sible as long as they differ in size by a factor of two. This pre- set-up in scanning mode. As expected from our experiments
requisite is not met in case of tRNAVal and as expected, the with synthetic ONs, we observe separation of the RNase T1
separation of the produced tRNA and the ribozyme is not derived ON mixture as seen for the total ion chromatogram
possible (Figure 3D, blue chromatogram). The ribozyme shown in Figure 4A (tRNAVal AAC ) and 4b (tRNASer UGA ).
co-elutes as a shoulder and subsequently, more ribozyme The color-coded tRNA sequences are shown in Supplemen-
can be found in the purified tRNA transcript (Figure 3E). tary Figure S9. For tRNAVal AAC , we prepared transcripts
Similar to the presented solution for tRNASer , a reduced containing stable isotope labeled nucleotides 15 N3 -cytidine
collection time window can help to remove the remaining or 15 N5 -guanosine. The fragments of the unlabeled and la-
ribozyme if complete removal of the ribozyme is necessary beled transcripts elute at the same retention time. The low
for subsequent experiments. resolution mass spectra of the eluting peaks allowed the as-e41 Nucleic Acids Research, 2020, Vol. 48, No. 7 PAGE 10 OF 16
Downloaded from https://academic.oup.com/nar/article-abstract/48/7/e41/5742835 by guest on 13 April 2020
Figure 4. MS chromatograms of in vitro transcribed (IVT) tRNAs after RNase T1 digestion. (A) Extracted ion chromatograms of tRNAVal AAC IVT
without stable isotopes (light ivt), with 15 N3 -Cytidine or 15 N5 -Guanosine. The sequences of the numbered peaks were determined by low resolution MS.
The retention time (Rt ), charge state and m/z values for the unlabeled and stable isotope labeled sequences are given in the table. (B) Total ion chromatogram
of tRNASer UGA IVT. The sequences of the numbered peaks were determined by low-resolution MS and are listed below the chromatogram.
signment of the ON sequences, which are derived from var- we could identify several modified ONs from total tRNA.
ious sequences of the tRNA. As expected, we observe dif- The corresponding chromatograms and MS/MS spectra
ferences in the m/z value due to the stable isotopes in the are shown in Figure 5.
15
N containing fragments compared to the unlabeled frag-
ments (Figure 4A). Thus, our method is capable of sepa-
rating RNase T1 derived tRNA digests. In this context, we
observed a low MS abundance of the 9 mer fragment (#4) ADAT2/3 deaminates tRNAVal AAC at position 34 in vitro
compared to the 8 mer fragment (#6) from tRNAVal . This Since tRNA modifying enzymes depend on a correctly
is explained by the different amount of acetonitrile (ACN) folded tRNA substrate for their activity, we tested whether
at these retention times. While the 9-mer elutes at around the SEC purified IVTs fold into the expected tRNA shape
4.5% ACN, the 8-mer elutes later and with ∼ 25% ACN. and are thus usable in in vitro modification assays. For these
With higher amounts of ACN, the ionization efficiency is assays, we used human ADAT2/3 enzyme, which has been
increased and thus later eluting compounds have a higher shown to catalyze the deamination of wobble adenosine at
signal intensity. When the gradient is eliminated by direct position 34 of in vitro transcribed tRNAVal AAC to inosine
injection of ONs or elution at isocratic ACN conditions (52). We incubated tRNAVal AAC with purified ADAT2/3 ex-
(Supplementary Figure S2), the abundance of all injected pecting deamination of A34 to I34. The presumably deami-
synthetic ONs is comparable and thus we conclude that the nated tRNA was digested by RNase T1 and we screened for
ionization efficiency is not majorly impacted by the compo- the tRNA sequence covering position 34, namely CCUAA-
sition of canonical nucleosides. CACG and CCUIACACG (see Figure 6A). Surprisingly,
RNA and especially tRNA are heavily post- we only found the unmodified sequence CCUAACACG
transcriptionally modified. To study the applicability and not the inosine containing sequence (Figure 6B). Due
of our method to native RNA, we treated total tRNA to this unexpected result, we digested an aliquot of the
from HEK cell culture with RNase T1, separated the ADAT2/3 treated tRNA to nucleosides and switched to
resulting fragments with our chromatographic method quantitative nucleoside analysis. While no inosine was de-
and analyzed the effluent by high-resolution MS. Here, tected in the untreated tRNA by nucleoside MS, we could
the mass resolving power of the Orbitrap instrument is detect an 8.0% conversion of adenosine to inosine per
necessary to confirm the sequence and modification status tRNA molecule in the ADAT2/3 modified transcript (Fig-
of the observed tRNA derived ONs. With this approach, ure 6F). From this finding we conclude that our SEC puri-PAGE 11 OF 16 Nucleic Acids Research, 2020, Vol. 48, No. 7 e41
Downloaded from https://academic.oup.com/nar/article-abstract/48/7/e41/5742835 by guest on 13 April 2020
Figure 5. Extracted ion chromatograms and MS/MS spectra of modified RNA fragments from HEK 293 cell total tRNA digested with RNase T1. Spectra
were recorded on a high-resolution Orbitrap instrument at CID energies of 35 eV. Fragments were assigned using (https://mods.rna.albany.edu/masspec/
Mongo-Oligo) calculations from known modified tRNA sequences (acquired from modomics database).
fied tRNA folds correctly and is thus recognized as a sub- both guanosine and inosine containing RNA sequences
strate by the tRNA modifying enzyme ADAT2/3. which impacts bottom-up oligonucleotide mass sepctrom-
Intrigued by the absence of the inosine modified ON in etry. Based upon our results, the substrate preference of
the Oligo-MS analysis and with the goal to assign the lo- RNase T1 can now be summarized as G > I > A.
cation of the A-to-I editing in tRNAVal AAC , we utilized In case of tRNAVal AAC , RNase T1 will then result in an
the synthetic 9-mer ONs presented in Figure 1A. These additional cleavage after I34 (Supplementary Figure S12).
ONs represent the sequences expected from an RNase We re-analyzed ADAT2/3 treated and untreated tRNA by
T1 digestion of tRNAVal AAC (unmodified: CCUAACACG oligonucleotide MS and screened for the newly identified
and modified: CCUIACACG). RNase T1 is a commonly ONs. We detected the CCUI fragment in unlabeled and
15
used endoribonuclease, which specifically cleaves RNA af- N-Cytidine-labeled tRNA digests after ADAT2/3 treat-
ter guanosine moieties. Guanosine and adenosine differ at ment, which indicates the A-to-I conversion of position 34
position 6 and position 2 of their purine structures. Ino- of the tRNA. Due to the similar mass of the CCUI and
sine and guanosine are identical at position 6 but differ at the CCUA fragment (1 Da), the result must be confirmed
position 2. Due to the high chemical similarity of inosine in the +1 charge state on a low resolution instrument or
and guanosine, we wondered whether RNase T1 is capa- by high resolution MS. Analysis of the sample on the Or-
ble of inosine recognition and subsequent cleavage. A lit- bitrap instrument revealed indeed formation of CCUI and
erature search revealed that the detection of inosine by se- thus confirms our findings from low resolution MS (Sup-
quencing is commonly done utilizing RNase T1 (53,54). plementary Figure S13). For quantification of the deami-
In MS-based RNA modification studies, this knowledge is nation reaction, we used the synthetic ON CCUIACACG
not yet widespread. To test the impact of RNase T1 on I and prepared an external calibration with its RNase T1 di-
containing RNA in MS, we incubated the A and I con- gest and re-analayzed the samples on the QQQ MS. We de-
taining ONs with RNase T1 and analyzed the resulting tected 7.6% inosine formation using this external calibra-
mixture. For CCUAACACG, we observe one prominent tion method (Figure 6C and D). Mass spectrometric quan-
peak which corresponds to the full-length ON and a sec- tification is ideally done using stable isotope labeled inter-
ond peak (less than 30%), corresponding to the 3 cleavage nal standards. Here, we used our 15 N3 -cytidine labeled tran-
product ACACG (Supplementary Figure S11). In contrast, script of tRNAVal as the substrate and the unlabeled syn-
full-length CCUIACACG, is barely detectable after RNase thetic ON as the internal standard. With this method, we
T1 treatment. Instead, two new peaks are found (Supple- find a 6.2% conversion of A34 to I34 (Figure 6E). This re-
mentary Figures S10 and 11). One corresponds to the 3 sult is 1.3-fold lower compared to our accurate nucleoside-
fragment ACACG and the other to the inosine contain- MS method (Figure 6F), which is acceptable for most po-
ing 5 cleavage product CCUI (Supplementary Figure S10). tential applications of our method. Our data suggests that
From our observation it is now clear, that RNase T1 cleaves our method is capable of absolute quantification, but fur-e41 Nucleic Acids Research, 2020, Vol. 48, No. 7 PAGE 12 OF 16
Downloaded from https://academic.oup.com/nar/article-abstract/48/7/e41/5742835 by guest on 13 April 2020
Figure 6. In vitro modification of tRNAVal AAC by ADAT2/3. (A) 3D structure of tRNAVal AAC in green. In red, the RNase T1 fragment of the ADAT2/3
target site is shown. (B) RNase T1 digest of untreated (left) and ADAT2/3 treated (right) tRNAVal AAC . In black, the signal for the resulting A-containing
ON is shown and in gray, the signal of the I-containing ON. (C) Calibration curve of the CCUI fragment for external calibration quantification by low-
resolution oligonucleotide MS. (D) Extracted ion chromatograms of RNase T1 digested tRNAVal AAC before (black) and after (red) ADAT2/3 treatment.
In gray the synthetic CCUI oligo is shown as a retention time control. (E) Extracted ion chromatograms of RNase T1 digested 15 N3 -cytidine-labeled
tRNAVal AAC before (black) and after (red) ADAT2/3 treatment. In gray the signal of the spiked in synthetic CCUI oligo is shown. (F) Quantification of
ADAT2/3 treated tRNA reveals the abundance of inosine per tRNA (%I / tRNA). Quantification was achieved by isotope dilution MS of a complete
nucleoside digest (Nucs-MS), by external calibration and by isotope standard spike-in for oligonucleotide MS.PAGE 13 OF 16 Nucleic Acids Research, 2020, Vol. 48, No. 7 e41
ther studies using internal standards as suggested by (39–
43) must be performed to determine the accuracy and pre-
cision for a given biological context.
The activity of AlkB is sequence dependent
Another context which benefits from ON-MS on a low
resolution MS, is in vitro modification/demodification ex-
periments. Here, we applied our method to the analysis
of 1-methyladenosine (m1 A)-modified ONs to study the
demethylation by AlkB (8). With the goal to study the sub-
strate specificity of AlkB by ON-MS, we designed three
Downloaded from https://academic.oup.com/nar/article-abstract/48/7/e41/5742835 by guest on 13 April 2020
m1 A-containing ONs. In human tRNA, m1 A is commonly
found at position 58. Sequence overlay of 13 random hu-
man tRNAs revealed the weight matrix of the nucleobases
surrounding m1 A58 in human tRNAs (Supplementary Fig-
ure S14). The first ON (UUCG(m1 A)UUC), was designed
to match this sequence surrounding m1 A58 from human
tRNAs and is thus referred to as ON-human. The sec-
ond ON reflects a mutated version of the ON-human,
where three preserved bases are exchanged (ON-mutated,
UAGG(m1 A)UUG). The last ON, ON-ribo, reflects the se-
quence surrounding the only possible m1 A site of E. coli
16S rRNA; (CGUC(m1 A)CAC). This site is found to be
methylated in bacteria resistant to certain antibiotics (55).
With this experiment, we wanted to evaluate the activity of
AlkB toward these three ONs and whether a sequence de-
pendence is observable.
All three ONs were incubated with 10 M AlkB. The
subsequent ON-MS analysis revealed the formation of
demethylated ONs as shown in Figure 7A–C. The demethy-
lated ONs elute at a later retention time compared to the re-
spective m1 A modified ONs on our TEAA-free chromatog-
raphy due to the lost positive charge of m1 A. For ON-
human and ON-ribo, we observe only trace formation of the
demethylated ON (Figure 7A/C). In contrast, we observed
more demethylated ON for ON-mutated. At first glance,
our observation indicates that the m1 A site of E. coli rRNA,
and the ON with the sequence of eukaryotic tRNA m1 A58
are less suitable substrates to AlkB compared to the com-
pletely unnatural substrate, ON-mutated. However, with-
out the use of stable isotope labeled internal standards, MS
is non-quantitative and the data may not be interpreted in
such a way.
To provide a quantitative method, we digested the AlkB
treated and untreated ONs to nucleosides and performed
nucleoside-MS with our established stable isotope dilution
MS (38). For this purpose, we equilibrated the system for
1 h by flushing the instrument with our aqueous nucleoside-
MS buffer and performed our quantitative nucleoside ex-
periments. Before AlkB treatment, we find 0.23 m1 A per
ON-human, 0.12 m1 A per ON-mutated and 0.19 m1 A per
ON-ribo. At a low AlkB concentration (1 M), we observe
9.8% demethylation for the ON-human (P = 0.0067). The
ON-mutated shows 12.9% demethylation (P < 0.0001) and Figure 7. in vitro AlkB assay with different m1 A containing oligonu-
the ON-ribo 18.6% demethylation (P < 0.0001). The ab- cleotides (ON) (A–C) left: ON-MS of m1 A containing ONs after incuba-
solute quantification data is in stark contrast to the non- tion with 10 M AlkB and their assigned m/z values, charge states and
sequences. (A–C) right: amount of m1 A per ON determined by isotope
quantitative results observed by the oligonucleotide MS. In- dilution MS of fully digested ONs with and without 1 M AlkB treat-
triguingly, AlkB seems to prefer the only potential m1 A site ment; bars represent the mean, error bars the standard deviation, n = 3
found in bacteria, namely m1 A1408 of the 16 S rRNA. Our biological replicates, a two-tailed, unpaired students t-test was performed
observation is confirmed by incubation of the same ONs (ON-human: P = 0.0067; ON-mutated: P < 0.0001; ON-ribo: P < 0.0001).You can also read