90-90-90 by 2020? Estimation and projection of the adult HIV epidemic and ART programme in Zimbabwe - 2017 to 2020
←
→
Page content transcription
If your browser does not render page correctly, please read the page content below
Bansi-Matharu L et al. Journal of the International AIDS Society 2018, 21:e25205
http://onlinelibrary.wiley.com/doi/10.1002/jia2.25205/full | https://doi.org/10.1002/jia2.25205

   RESEARCH ARTICLE

90-90-90 by 2020? Estimation and projection of the adult HIV
epidemic and ART programme in Zimbabwe – 2017 to 2020
Loveleen Bansi-Matharu1§ , Valentina Cambiano1 , Tsitsi Apollo2, Raymond Yekeye3, Jeffrey Dirawo4,
Sithembile Musemburi4, Calum Davey5, Sue Napierala6, Elizabeth Fearon7 , Amon Mpofu3, Owen Mugurungi8,
James R Hargreaves7, Frances M Cowan4,9 and Andrew N Phillips1
§
 Corresponding author: Loveleen Bansi-Matharu, UCL Centre for Clinical Research, Epidemiology, Modelling and Evaluation (CREME), Royal Free Hospital Campus,
Rowland Hill Street, London NW3 2PF, UK. Tel: +44 7931 782678. (l.bansi-matharu@ucl.ac.uk)

  Abstract
  Introduction: The 90-90-90 targets set by the United Nations aspire to 73% of people living with HIV (PLHIV) being virally
  suppressed by 2020. Using the HIV Synthesis Model, we aim to mimic the epidemic in Zimbabwe and make projections to
  assess whether Zimbabwe is on track to meet the 90-90-90 targets and assess whether recently proposed UNAIDS HIV tran-
  sition metrics are likely to be met.
  Methods: We used an approximate Bayesian computation approach to identify model parameter values which result in model
  outputs consistent with observed data, evaluated using a calibration score. These parameter values were then used to make
  projections to 2020 to compare with the 90-90-90 targets and other key indicators. We also calculated HIV transition metrics
  proposed by UNAIDS (percentage reduction in new HIV infections and AIDS-related mortality from 2010 to 2020, absolute
  rate of new infections and AIDS-related mortality, incidence–mortality ratio and incidence–prevalence ratios).
  Results: After calibration, there was general agreement between modelled and observed data. The median predicted out-
  comes in 2020 were: proportion of PLHIV (aged 15 to 65) diagnosed 0.91 (90% uncertainty range 0.87, 0.94) (0.84 men,
  0.95 women); of those diagnosed, proportion on treatment 0.92 (0.90, 0.93); of those receiving treatment, proportion with
  viral suppression 0.86 (0.81, 0.91). This results in 72% of PLHIV having viral suppression in 2020. We estimated a per-
  centage reduction of 36.5% (13.7% increase to 67.4% reduction) in new infections from 2010 to 2020, and of 30.4%
  (9.7% increase to 56.6% reduction) in AIDS-related mortality (UNAIDS target 75%). The modelled absolute rates of HIV
  incidence and AIDS-related mortality in 2020 were 5.48 (2.26, 9.24) and 1.93 (1.31, 2.71) per 1000 person-years respec-
  tively. The modelled incidence–mortality ratio and incidence–prevalence ratios in 2020 were 1.05 (0.46, 1.66) and 0.009
  (0.004, 0.013) respectively.
  Conclusions: Our model was able to produce outputs that are simultaneously consistent with an array of observed data and pre-
  dicted that while the 90-90-90 targets are within reach in Zimbabwe, increased efforts are required in diagnosing men in particular.
  Calculation of the HIV transition metrics suggest increased efforts are needed to bring the HIV epidemic under control.
  Keywords: HIV care continuum; public health; testing; treatment; viral suppression

  Additional Supporting Information may be found online in the Supporting information tab for this article.

Received 22 June 2018; Accepted 16 October 2018
Copyright © 2018 The Authors. Journal of the International AIDS Society published by John Wiley & Sons Ltd on behalf of the International AIDS Society
This is an open access article under the terms of the Creative Commons Attribution License, which permits use, distribution and reproduction in any medium,
provided the original work is properly cited.

1 | INTRODUCTION                                                                        much progress has been made to meet them. However, there
                                                                                        is still room for further advancement. In Zimbabwe, a 2016
In 2014, the United Nations Programme on HIV and AIDS                                   population-based survey (Zimbabwe Population-Based HIV
introduced the 90-90-90 targets by 2020, 90% of people living                           Impact Assessment (ZIMPHIA)) suggests that a quarter of
with HIV (PLHIV) will be diagnosed, of those diagnosed 90% of                           PLHIV were not aware of their HIV status in 2016 [2],
people will be receiving antiretroviral treatment and among                             although there is likely to be some under-reporting of HIV
those receiving treatment, 90% will be virally suppressed [1].                          diagnosis [3]. Of those reporting having been diagnosed, 86.8%
While it is arguable whether the 90-90-90 targets should be a                           self-reported use of antiretroviral therapy (ART) and, among
primary target for a healthcare system, in so far as they do not                        these people, 86.5% had viral suppression [2]. The 90-90-90
distort rational resource allocation between healthcare options                         target amounts to 73% of PLHIV achieving viral suppression by
in countries, such targets can have a galvanizing effect and                            2020. In ZIMPHIA, the corresponding estimate was 60.4% [2].

                                                                                                                                                          1
Bansi-Matharu L et al. Journal of the International AIDS Society 2018, 21:e25205 http://onlinelibrary.wiley.com/doi/10.1002/jia2.25205/full | https://doi.org/10.1002/jia2.25205 Prevalence rates (henceforth referred to as ‘prevalence’) the calibration, including the number of data items included in and incidence estimates are crucial to understand the current the original calibration score are given in Data S2. status of the HIV epidemic and, in particular, to identify The aim of the calibration process was to find 500 parame- whether trends suggest an improving epidemic, as was ter sets that yielded an overall calibration score of
Bansi-Matharu L et al. Journal of the International AIDS Society 2018, 21:e25205
http://onlinelibrary.wiley.com/doi/10.1002/jia2.25205/full | https://doi.org/10.1002/jia2.25205

Table 1. Comparison of latest available observed and modelled data for components of the original c-score

                                                                                       Observed data

Components included in the original calibration                                          Year of                           Modelled estimate across runs
score                                                          Source                  comparison   Estimate (95% CI) %         Median (90% range)

Prevalence – men 15 to 49                                      ZIMPHIA [2]             2016.25      0.11 (0.10, 0.12)     0.10 (0.08, 0.13)
Prevalence – women 15 to 49                                    ZIMPHIA [2]             2016.25      0.17 (0.16, 0.17)     0.16 (0.13, 0.21)
Prevalence – men 15 to 24                                      DHS [5]                 2015.75      0.03                  0.02 (0.01, 0.04)
Prevalence – women 15 to 24                                    DHS [5]                 2015.75      0.07                  0.05 (0.02, 0.08)
Prevalence – FSWs 15 to 65                                     Cowan 2017 [13]         2013.75      0.58 (0.43, 0.79)     0.47 (0.26, 0.72)
Incidence per 100 person-years – men 15 to 49                  ZIMPHIA [2]             2016.25      0.28 (0.06, 0.50)     0.50 (0.20, 0.96)
Incidence per 100 person-years – women 15 to 49                ZIMPHIA [2]             2016.25      0.67 (0.37, 0.97)     0.76 (0.27, 1.53)
Number of HIV tests – all 15 to 49                             GARCPR [9]              2016.5       22,01,246             23,59,360 (17,06,740, 30,28,040)
Proportion diagnosed of those with HIV – men 15                ZIMPHIA [2]             2016.25      0.697                 0.77 (0.70, 0.84)
  to 64
Proportion diagnosed of those with HIV – women                 ZIMPHIA [2]             2016.25      0.771                 0.92 (0.87, 0.96)
  15 to 64
Number on ART3 – men 15 to 64                                  MoH [11]                2015.75      3,01,650              2,70,100 (2,09,875, 3,38,720)
Number on ART3 – women 15 to 64                                MoH [11]                2015.75      5,16,557              5,23,775 (4,08,435, 6,44,590)
Number on 2nd line – all 15 to 64                              MoH [12]                2014.75      12,696                14,965 (0, 36,135)
Proportion suppressed of those with HIV – men 15               ZIMPHIA [2]             2016.25      0.53 (0.51, 0.58)     0.57 (0.48, 0.64)
  to 64
Proportion suppressed of those with HIV – women                ZIMPHIA [2]             2016.25      0.64 (0.62, 0.67)     0.67 (0.60, 0.71)
  15 to 64
Proportion with resistance at ART initiation – all 15          WHO Resistance          2010.5       0.09 (0.03, 0.22)     0.04 (0, 0.10)
  to 64                                                           reporta,b [10]
Number of FSW 18 to 49                                         Cowan[14]               2017.25      73,270b               1,27,385 (60,225, 2,00,020)
Number of pregnancies 15 to 49                                 UN [15]                 2013.5       3,98,474              4,58,440 (2,10,240, 7,65,040)
Other variables of interest
  Proportion suppressed of those on ART – men                  ZIMPHIA [2]             2016.25      0.84                  0.88 (0.80, 0.94)
     15 to 64
  Proportion suppressed of those on ART – women                ZIMPHIA [2]             2016.25      0.88                  0.86 (0.81, 0.92)
     15 to 64
  Proportion with resistance at ART initiation – all           WHO Resistance          2016.5       0.11 (0.07, 0.16)     0.07 (0, 0.18)
   15 to 64                                                     report [28]
  Number of circumcisions per year                             GARCPR [9]              2015.5       1,06,286              1,16,800 (89,060, 1,44,540)

ART, antiretroviral therapy; FSW, female sex workers; ZIMPHIA, Zimbabwe Population-Based HIV Impact Assessment.
a
 WHO Resistance Report 2017 was published after completion of the calibration process hence was not included in the calibration score; bsee
“Description of Model Calibration” document for FSW calculation.

3 | RESULTS                                                                             of all other items in the score and the extent to which the
                                                                                        observed data are underestimates is unclear. The modelled
Of the 500 runs that had a c-score of
Bansi-Matharu L et al. Journal of the International AIDS Society 2018, 21:e25205
http://onlinelibrary.wiley.com/doi/10.1002/jia2.25205/full | https://doi.org/10.1002/jia2.25205
Median modelled prevalence across runs in 2017 and 2020 Median modelled incidence across runs in 2017 and 2020
among men and women aged 15–49 among men and women aged 15–49
Incidence per 100
0.25
1.5
person-years
Prevalence
0.2
0.15 1
0.1
0.5
0.05
0 0
Men Women Men Women
Median ∆ = –0.01 (–0.02, –0.00) Median ∆ = –0.01 (–0.02, –0.00) Median ∆ = –0.05 (–0.13, 0.02) Median ∆ = –0.07 (–0.22, 0.06)
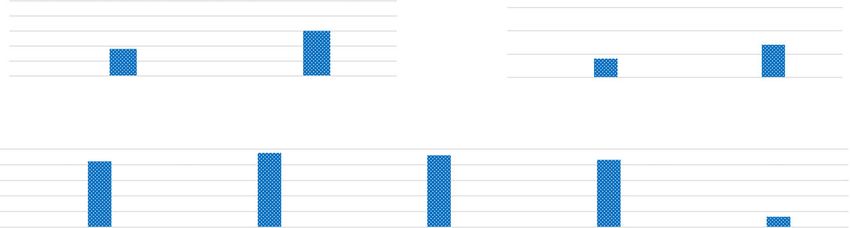
Median modelled proportions across runs in 2017 and 2020 amongst people aged 15–64
1
0.8
Proportion
0.6
0.4
0.2
0
Diagnosed (men) Diagnosed (women) On treatment of diagnosed (all) Suppressed of those on ART (all) NNRTI resistance (all)
Median ∆ = 0.05 (0.02, 0.07) Median ∆ = 0.02 (0.00, 0.04) Median ∆ = 0.02 (0.01, 0.06) Median ∆ = –0.01 (–0.02, 0.01) Median ∆ = 0.07 (0.01, 0.16)
Figure 1. Median (90% range) modelled projections at 2017 and 2020.
In the second phase of the analyses, we projected forward 8760, 29,200) in 2017 and (18,051 (90% range: 11,680,
to 2020 and analysed results at 2017 and at 2020 (Figure 1). 25,882); change of 0 (95% range: 8893, 78310).
We predict little change in the prevalence of HIV from 2017 Finally, we calculated a modelled percentage reduction in
to 2020, though predict incidence to fall by a mean of 0.06/ new infections from 2010 to 2020 of 36.5% (90% range:
100 person-years, albeit with substantial uncertainty in this 13.7% increase to 67.4% reduction), and in AIDS-related mor-
trend (90% range: 0.16, 0.03). With continuation of current tality of 30.4% (90% range: 9.7% increase to 56.6% reduction.
testing rates, the overall predicted proportion of PLHIV diag- The interim impact target for both these measures agreed by
nosed by 2020 is estimated to be 0.91 (90% range: 0.87, the United Nations Assembly was a 75% reduction. The abso-
0.94). We predict a mean 0.05 absolute increase (90% range: lute rates of modelled incidence and AIDS-related mortality in
0.02, 0.07) in the proportion of men diagnosed and a 0.02 2020 were 5.48 (90% range: 2.26, 9.24) and 1.93 (1.31, 2.71)
absolute increase (90% range: 0.00, 0.04) in the proportion of per 1000 person-years respectively. The modelled incidence–
women diagnosed, resulting in an overall proportion of 0.84 mortality ratio and incidence–prevalence ratios in 2020 were
(90% range: 0.78, 0.90) of men diagnosed with HIV and 0.95 1.05 (90% range: 0.46, 1.66) and 0.009 (90% range: 0.004,
(90% range: 0.91, 0.97) of women diagnosed in 2020. The 0.013) respectively.
proportion of HIV-positive people diagnosed with HIV receiv-
ing ART is expected to increase by 0.02 (90% range: 0.01,
0.06), resulting in 0.92 (90% range: 0.90, 0.93) of diagnosed 4 | DISCUSSION
people on treatment in 2020. Of those receiving ART, there is
minimal predicted change in the proportion of people with viral Using an individual-based model and a range of observed data
suppression. The overall proportion of people with viral sup- in Zimbabwe, we were able to mimic the current HIV epidemic
pression in 2020 is predicted to be 0.86 (90% range: 0.81, and project future trends in key indicators, including the 90-90-
0.91); 0.87 (90% range: 0.78, 0.92) of men and 0.86 (90% 90 targets. The UNAIDS 90-90-90 targets in 2020 are within
range: 0.82, 0.91) of women had viral load suppression in reach according to our projected trends, given increased efforts
2020. Of those aged 15 to 49 living with HIV (undiagnosed as in diagnosing men in particular. While we predict 90.7% of
well as diagnosed), 0.37 (90% range: 0.31, 0.43) had unsup- adults with HIV overall will be diagnosed in 2020, the respec-
pressed viral load in 2017, compared to a predicted 0.30 (90% tive estimates for men and women are 84% and 95%. We esti-
range: 0.25, 0.36) in 2020. The proportion of people with mate that 92% of people diagnosed will be receiving treatment,
non-nucleoside reverse transcriptase inhibitors (NNRTI) resis- and of these, 86% will be virally suppressed (although may
tance at time of starting ART is expected to increase markedly potentially be biased due to people under-reporting treatment).
in three years time, from 0.05 (90% range: 0.01, 0.13) in 2017 Ninety per cent is within our uncertainty range; and continued
to 0.13 (90% range: 0.05, 0.23) in 2020; a change of 0.07 commitment to the Extended Zimbabwe National HIV and
(0.01, 0.16). Modelled estimates in 2017 and in 2020 using AIDS Strategic Plan [17] may increase this estimate further.
the three alternative calculations were in line with those calcu- The United Nations Assembly have suggested a target of a
lated using the original score and are shown in Data S3. 75% reduction in new infections and AIDS-related deaths
There was little difference in the projected number of between 2010 and 2020. In Zimbabwe, the percentage reduc-
PLHIV: 1,130,770 (90% range: 881,840, 1,394,665) in 2017 tion for both these modelled outputs wasBansi-Matharu L et al. Journal of the International AIDS Society 2018, 21:e25205
http://onlinelibrary.wiley.com/doi/10.1002/jia2.25205/full | https://doi.org/10.1002/jia2.25205
person-years. Rates below 1/1000 person-years have been initiation is also projected to increase by 9% to an overall 15%
used to define elimination of HIV [18], and UNAIDS have also by 2020. This is of particular concern in this setting, given the
suggested that rates below 1/1000 person-years could be rel- limited access and availability of alternative first line regimens.
evant in higher incident and prevalence settings [6]. Potential Adherence counselling and efforts to increase testing have,
issues with our projected incidence measure are discussed and are currently taking place but continued effort in these
later in this section and so though it is considerably higher areas is needed to ensure transmitted drug resistance does
than 1/1000 person-years our model may not reflect the true not become an issue that is unable to be effectively addressed.
incidence. Our modelled incidence–mortality ratio was 1.05. WHO guidelines have changed the national first line ART regi-
UNAIDS do state a benchmark of one for this transition men in new initiators to be dolutegravir, rather than efavirenz,
metric; however, this is only relevant with a measure of low containing in countries with pre-ART NNRTI resistance >10%
mortality among PLHIV or high ART coverage, defined as [20], and it is predicted this change would be both effective
>81% of PLHIV (P Ghys, personal communication). Zimbabwe, and cost-effective [21]. The Zimbabwe treatment guidelines
according to the ZIMPHIA estimates, does not currently meet have not yet incorporated this change [16]. Recent data sug-
the 81% ART coverage. However, using estimates from our gesting a potential risk of neural tube defects in women who
model, we predict 84% ART coverage and in this case, the are on dolutegravir at the time of conception create doubt
incidence–mortality ratio implies that there are more new over the timing and nature of dolutegravir introduction [22].
infections than deaths per year. Hence, it is likely that, despite Generally, the estimates obtained using the alternative cali-
the reduction in prevalence, the number of PLHIV is on the bration scores are in line with our original calibration score,
rise, due to population growth. The modelled incidence–preva- suggesting that the weights and data items used in our origi-
lence ratio takes into account duration of life after HIV acqui- nal score are robust. This implies that if the assumptions hold
sition. Our projected output was below the target suggested, (in terms of testing, number of circumcisions, number of peo-
of 0.03, based on an average survival of people with HIV of ple receiving treatment, etc.) our projections to 2020 are
33 years after acquisition. This transition metric suggests that likely to be in line with observed data in the future or may
the total number of PLHIV will eventually fall, and hence, the even be an underestimation of the potential benefits, particu-
epidemic is in a “state of control.” This interpretation is not in larly since there are ongoing efforts to improve the status of
line with the interpretation of the three metrics prior to this the HIV epidemic in Zimbabwe.
(percentage reduction in new infections/AIDS-related deaths, When comparing observed and modelled outputs, we found
the absolute rates of new infections/AIDS-related mortality a good fit across the majority of components included in the
and the incidence–mortality ratio) which suggest that score. We did however see a higher predicted HIV incidence
increased efforts are needed to bring the HIV epidemic under (within the 95% observed CI for women but not for men) and
control. This also suggests that even if the 90-90-90 targets a higher predicted proportion diagnosed compared to those
were achieved, the HIV transition metrics are unlikely to all reported in ZIMPHIA. There is particular uncertainty over the
be met, and hence, there may be a lack of consistency current incidence since the only data source to inform this is
between the two sets of targets, certainly in the short term. the recent ZIMPHIA estimate [2], which was calculated using
Our modelled estimate of prevalence of HIV in women who the recent infection algorithm [23]. There are concerns of
had greater than three condomless sex partners in the past using a single method to estimate incidence [24]; hence, the
three month period was lower than observed data among ZIMPHIA estimate should be interpreted with caution. In con-
FSWs [13]. This may be due to differences in the make-up of trast, the prevalence estimates are informed by three DHS
these two groups: for example, our modelled estimate for the surveys as well as ZIMPHIA [5,25,26], and we did indeed see
number of FSWs was markedly higher than the empirical esti- a good fit when comparing our modelled prevalence data to
mate on the number of FSWs, which itself is difficult to accu- observed data. Our estimate for proportion of PLHIV who
rately estimate. To reflect this uncertainty, we allowed have been diagnosed is higher than that seen in ZIMPHIA [2],
substantial variability over model runs in sexual behaviour which was the only data source available for this item. Our
parameter values which determine the number of women with modelled estimate was a result of a good agreement of all
greater than three condomless sex partners within the model. other components of the score. Furthermore, the results from
When projecting forward to 2020 using the original calibra- ZIMPHIA on HIV status are based on self-reported data and
tion score, HIV incidence was projected to drop by 0.06 per hence must be interpreted with caution. It is highly likely that
100 person-years. Given the uncertainty around the incidence not all people diagnosed with HIV report as having been diag-
estimate, the degree of decrease is difficult to accurately quan- nosed when asked; this has been demonstrated in other sur-
tify. We project that by 2020, the proportion of people diag- veys [3] and if this is the case, it would result in an
nosed with HIV will increase, particularly in men, assuming the underestimation in the proportion diagnosed.
rate of testing remains at the current level. This may be due to
a lower proportion of men diagnosed in 2017 compared
to women, and hence, there is more scope for this estimate to 5 | CONCLUSIONS
increase. It is hoped that these estimates may increase even
further, in line with increased efforts in testing for HIV in men, It is essential to have reliable observed data in order to cali-
within for example the circumcision programme currently brate models well to specific settings and hence accurately
underway in Zimbabwe [19] and with the planned rollout of replicate past trends in order to predict future trends. While
HIV self-testing which is likely to attract a significant propor- our score proved to be robust, there are some data items that
tion of men (TA, Zimbabwe MoH, personal communication). are both difficult to model and obtain reliable data on. Surveys
The proportion of people with NNRTI resistance at ART like the DHS and ZIMPHIA are invaluable in terms of the
5Bansi-Matharu L et al. Journal of the International AIDS Society 2018, 21:e25205
http://onlinelibrary.wiley.com/doi/10.1002/jia2.25205/full | https://doi.org/10.1002/jia2.25205
information they provide and are a good indication of whether indicator survey 2012: relevance to national targets for HIV diagnosis and
treatment programmes are working. However, it is likely that treatment. AIDS. 2016;30(17):2685–95.
4. UNAIDS. AIDSInfo HIV Indicators. 2017.
some of the outputs reported in these surveys, for example, 5. Zimbabwe National Statistics Agency and ICF International. Zimbabwe
the proportion of people diagnosed with HIV, and the propor- demographic and health survey 2015: final report. Rockville (MD): Zimbabwe
tion of people receiving treatment are underestimated due to National Statistics Agency (ZIMSTAT) and ICF International; 2016.
stigma surrounding a HIV diagnosis and hence failure to dis- 6. UNAIDS. Consensus Building Around What We Mean By “Epidemic Control”.
2017.
close status. Further data collection, perhaps in the form of
7. Cambiano V, Bertagnolio S, Jordan MR, Lundgren JD, Phillips A. Transmission
complete healthcare provider records, together with commit- of drug resistant HIV and its potential impact on mortality and treatment out-
ment to the Monitoring and Evaluation Plan as outlined in the comes in resource-limited settings. J Infect Dis. 2013;207 Suppl 2:S57–62.
National Strategic Plan [17] would be necessary to fully under- 8. Beaumont MA, Zhang W, Balding DJ. Approximate Bayesian computation in
stand the impact of HIV in Zimbabwe and work towards population genetics. Genetics. 2002;162(4):2025–35.
9. UNAIDS. Global AIDS Response Progress Report 2016. 2016.
achieving and surpassing the 90-90-90 UNAIDS target. Con- 10. WHO. WHO HIV Drug Resistance Report 2012. 2012.
siderable efforts are needed to reach the benchmarks sug- 11. Apollo T. Number of adults on 1st line ART by gender. 2017.
gested by the UN when calculating the HIV transition metrics, 12. Joseph M. Numbers of adults on 2nd line ART. 2015.
and in particular, to achieve the recommended 75% reduction 13. Cowan FM, Davey CB, Fearon E, Mushati P, Dirawo J, Cambiano V, et al.
The HIV care cascade among female sex workers in Zimbabwe: results of a pop-
in the number of new HIV infections. It is important to recog-
ulation-based survey from the sisters antiretroviral therapy programme for pre-
nize that while continued efforts in testing are likely to reduce vention of HIV, an integrated response (SAPPH-IRe) trial. J Acquir Immune
the number of people with undiagnosed HIV, the proportion of Defic Syndr. 2017;74(4):375–82.
these people that are hard to reach is likely to increase and 14. Cowan FM. Cowan_Feedback from Sisters Programme 29 Sep 2017. 2017.
hence increased resources may be required for outreach 15. Population Division DoEaSAUN. World Population Prospects: The 2012
Revision. Zimbabwe. 2012.
testing to maintain current testing rates. Furthermore, while 16. National Medicines and Therapeutics Policy Advisory Committee (NMTPAC)
continued efforts are needed to diagnose and treat those and The AIDS and TB Directorate MoHaCCZ. Guidelines for Antiretroviral Ther-
with HIV, resources also need to be used to maximize preven- apy for the Prevention and Treatment of HIV in Zimbabwe. 2016.
tion of HIV [27], provided that the use of such resources is 17. Ministry of Health Z, National AIDS Council of Zimbabwe. Extended Zim-
babwe National HIV and AIDS Strategic Plan (ZNASP) 2015–2020. 2015.
cost-effective.
18. Granich RM, Gilks CF, Dye C, De Cock KM, Williams BG. Universal voluntary
HIV testing with immediate antiretroviral therapy as a strategy for elimination of
AUTHORS’ AFFILIATIONS
HIV transmission: a mathematical model. Lancet. 2009;373(9657):48–57.
1
Institute for Global Health, UCL, London, UK; 2Department of HIV/AIDS and 19. Feldacker C, Makunike-Chikwinya B, Holec M, Bochner AF, Stepaniak A,
STIs, Ministry of Health and Childcare, Harare, Zimbabwe; 3Zimbabwe National Nyanga R, et al. Implementing voluntary medical male circumcision using an
AIDS Council, Harare, Zimbabwe; 4Centre for Sexual Health, HIV/AIDS innovative, integrated, health systems approach: experiences from 21 districts in
Research Zimbabwe, Harare, Zimbabwe; 5Faculty of Public Health and Policy, Zimbabwe. Glob Health Action. 2018;11(1):1414997.
London School of Hygiene and Tropical Medicine (LSHTM), London, UK; 6RTI 20. WHO. Consolidated guidelines on the use of antiretroviral drugs for treat-
International, San Francisco, CA, USA; 7Department of Social and Environmental ing and preventing HIV infection recommendations for a public health approach.
Health Research, London School of Hygiene & Tropical Medicine, London, UK; 2nd ed. Geneva: WHO Press; 2016.
8
TB and AIDS Unit, Zimbabwe Ministry of Health, Harare, Zimbabwe; 9Depart- 21. Phillips AN, Cambiano V, Nakagawa F, Revill P, Jordan MR, Hallett TB, et al.
ment of International Public Health, Liverpool School of Tropical Medicine, Cost-effectiveness of public-health policy options in the presence of pretreat-
Liverpool, UK ment NNRTI drug resistance in sub-Saharan Africa: a modelling study. Lancet
HIV. 2018; 5(3):e146–e154.
22. WHO. Statement on DTG - Geneva 18 May 2018. 2018.
COMPETING INTEREST
23. SACEMA’s online resource for incidence estimation. Incidence Inference
Frances Cowan received a donation of Truvada from Gilead Health Sciences as Based on Cross-Sectionally Obtained Biomarkers for ‘Recent Infection’. 2017.
the Principal Investigator for a PrEP Demonstration Project incorporated in the 24. Ghys PD, Kufa E, George MV. Measuring trends in prevalence and inci-
SAPPH-IRE trial. dence of HIV infection in countries with generalised epidemics. Sex Transm
Infect. 2006;82 Suppl 1:i52–6.
AUTHORS’ CONTRIBUTION 25. Central Statistical Office (CSO) [Zimbabwe] and Macro International Inc.
Zimbabwe demographic and health survey 2005–06. Calverton (MD): CSO and
All authors have read and approved the final manuscript. LBM performed the
Macro International Inc; 2007.
analyses and wrote the paper. VC and AP designed the research question,
26. Zimbabwe National Statistics Agency (ZIMSTAT) and ICF International.
extensively reviewed the analyses and the paper. TA, RY, JD, SM, CD, SN, EF,
Zimbabwe demographic and health survey 2010–11. Calverton (MD): ZIMSTAT
AM, OM, JRH and FC reviewed the paper.
and ICF International Inc; 2012.
27. Bekker LG, Alleyne G, Baral S, Cepeda J, Daskalakis D, Dowdy D, et al.
Advancing global health and strengthening the HIV response in the era of the
ACKNOWLEDGEMENT Sustainable Development Goals: the International AIDS Society-Lancet Commis-
sion. Lancet. 2018;392(10144):312–58.
FUNDING 28. WHO, United States Centers for Disease Control and Prevention, The Glo-
Bill & Melinda Gates Foundation and the STAR Initiative, funded by UNITAID. bal Fund to Fight AIDS TaM. HIV Drug Resistance Report 2017. 2017.
The funders had no role in the study design, data collection and analysis,
decision to publish or preparation of the manuscript.
SUPPORTING INFORMATION
REFERENCES Additional Supporting Information may be found in the online
1. UNAIDS. 90-90-90: An ambitious treatment target to help end the AIDS version of this article:
epidemic. 2014. Data S1. Calibration to Zimbabwe.
2. Zimbabwe Ministry of Health. Zimbabwe Population-Based HIV Impact
Data S2. Description of model calibration.
Assessment ZIMPHIA 2015–2016. 2016.
3. Kim AA, Mukui I, Young PW, Mirjahangir J, Mwanyumba S, Wamicwe J, et al. Data S3. Alternative methods of calculating the calibration
Undisclosed HIV infection and antiretroviral therapy use in the Kenya AIDS score.
6You can also read