Exploring Wardriving Potential in the Ecuadorian Amazon for Indirect Data Collection
←
→
Page content transcription
If your browser does not render page correctly, please read the page content below
IOP Conference Series: Earth and Environmental Science

PAPER • OPEN ACCESS

Exploring Wardriving Potential in the Ecuadorian Amazon for Indirect
Data Collection
To cite this article: Fabián Santos et al 2021 IOP Conf. Ser.: Earth Environ. Sci. 690 012054

View the article online for updates and enhancements.

                                This content was downloaded from IP address 46.4.80.155 on 09/09/2021 at 19:08
2020 International Symposium on Water, Ecology and Environment                                                 IOP Publishing
IOP Conf. Series: Earth and Environmental Science 690 (2021) 012054                        doi:10.1088/1755-1315/690/1/012054

       Exploring Wardriving Potential in the Ecuadorian Amazon
       for Indirect Data Collection

                          Fabián Santos*, Pablo Pesantes and Santiago Bonilla-Bedoya
                          Centro de Investigación para el Territorio y el Hábitat Sostenible (CITEHS),
                          Universidad Tecnológica Indoamérica, Machala y Sabanilla, 170301, Quito, Ecuador
                          *Email: ernestosantos@uti.edu.ec; fabian_santos_@hotmail.com

                          Abstract. Digital inclusion in the Ecuadorian amazon is known as a problem, which
                          intensified with the pandemic. Since social distance is now the norm, we constructed a
                          WiFi access point (WAP) scanner to map and analyze its data. We correlated it with
                          ancillary geoinformation to observe its potential and limitations as a method for indirect
                          data collection. Our result indicate that WAP correlate weakly but positively with
                          nightlight, young population, accessibility to economical centres, and negatively with
                          slope. Moreover, we differentiated vulnerability naming patters from Service Set
                          Identifiers (SSDI) and differentiated the number of WAPs according to land cover for
                          differentiate urban from rural areas. This output is now offering increasing applications
                          to get updated rought estimates of internet activity and indirectly correlations to socio-
                          economic conditions, technology practices, and opportunities for natural language
                          processing. Therefore, we conclude that wardriving offer interesting opportunities for
                          mapping social data but also concerns as an indirect data collection method.

1. Introduction
The diminished or null digital inclusion is a condition for many people, which contributes to isolate and intensify
existing inequalities [1]. In this context, produce updated spatial statistics for digital inclusion is highly required to
find areas where this service is absent. Nevertheless, direct data collection approaches implies interviews which can
put people at risk due to the pandemic, while on-line methods [2] may offer a solution but not necessarily with a
spatial reference. Therefore, indirect data collection methods used in projects like Google Maps and Street View [3]
or wardriving in WiGLE [4] offer new opportunities for multiple research disciplines; however, with restrictions
and limited data availability [5].
     Wardriving implies mapping the WiFi access point (WAP) from routers, computers mobiles, or any device
using a location-based service (e.g. GPS, GLONASS, Galileo, BeiDou) attached to a car or other platform (when it
is attached to bikes or persons it is named warbiking and warwalking, respectively). An example of this is given by
Sapiezynski et al., [6] who collect time series from location beacons to map human mobility using data from
smartphones but with some concern about its privacy. While the latter is a pending issue [7] , data generated by
mobile networks has been proposed as a census alternative to analyze urban dynamics [8]. This approach is
interesting, as the availability of a mobile network can reflect a socio-economic status, while its type of connection
(i.e. mobile-only or computer) is associated to differentiated digital skills [9]. These findings highlight that the type

              Content from this work may be used under the terms of the Creative Commons Attribution 3.0 licence. Any further distribution
              of this work must maintain attribution to the author(s) and the title of the work, journal citation and DOI.
Published under licence by IOP Publishing Ltd                          1
2020 International Symposium on Water, Ecology and Environment                                       IOP Publishing
IOP Conf. Series: Earth and Environmental Science 690 (2021) 012054              doi:10.1088/1755-1315/690/1/012054

and the number of network connections could help to find people excluded from information technologies, specially
in developing countries [10].
    While wardriving has been more often applied in urban areas, here we explore its use in rural and periurban
areas. Following an approach similar to Saad et al. [11], we collected and mapped WAPs using a Raspberry Pi and
a GPS device from a car to count how many of these WAPs happen along an altitude gradient in Ecuador. This data
is described with ancillary geoinformation to observe its interaction and discuss its potential uses and limitations.
Therefore, this short paper starts describing: (i) the study area and the procedure applied to build the WAP scanner;
and (ii) its results as summary statistics to discuss and conclude its relevance as a method for indirect data collection.

2. Material and Methods

2.1. Study Area
We conducted our data collection in the Amazonian region of Ecuador, along an altitude gradient from 529 to 2213
m.a.s.l. (Figure 1). This route had an extension of 81.1 Kms. And it was traveled in August of 2019. This study area
is specifically in the Napo province, a territory with higher rural (61.7%) than urban (38.2%) population, which
accounts less cropland area (13.1%) than natural vegetation (85%) [12,13]. Its dramatic land occupation associated
to colonization policies and oil extraction is today expressed with higher levels of poverty and environmental
degradation, principally among indigenous territories [14]. While the government have introduced policies to
palliate its historic development gap, digital inclusion is still a pending issue in this region [15].

2.2. WAP Scanner
Wireless network or WiFi is a family of wireless network protocols used for Internet and network connections.
Since WiFi networks do not need a physical connection, any device with an adapter can be potentially detected.
Based in this principle, we used a Raspberry Pi Model 3B V1.2, which includes an 2.4 GHz 802.11n wireless adapter
(Figure 1) to execute a Python script and run the command iwlist from the wireless tools for Linux [16]. This
software scans available WAPs in the vicinity together with other information about their settings. With a sampling
rate of 5 seconds (to not overload Raspberry Pi performance), we scanned 3191 WAPs and filtered the next
information: 1) software runtime; 2) Service Set Identifier (SSDI); 3) overall quality of the link (converted to
percentages); and 4) received signal strength (measured in decibel-milliwatts or dBm). These four features were
stored in a text file for each iwlist execution. As multiple WAPs of a same SSDI occurred, we filtered the one with
the highest quality, reducing our dataset to 298 Aps. To link them with a geographic position, we simultaneously
used a GPS Garmin GPSMAP 64s to collect a track during WAPs scanning. For this, we synchronized their clocks
to link their time stamps and get a relative position of WAPs. To conveniently analyze these results, we stored them
as a spatial database to operate with QGIS [17] and the R language [18].

2.3. Ancillary Geoinformation and Data Analysis
To check results collected with the WAP scanner, we reviewed Google Earth Engine datasets [19] and other sources
for collect ancillary geoinformation (Table 1). For the data analysis, we conveniently divided the GPS track into
segments of 250 mts., extracting and averaging ancillary geoinformation. For this, we applied a buffer distance of
50 mts. from each segment to counted how many WAPs occurred and correlate later with the extracted
geoinformation. This buffer distance was considered enough, as our WAP scanner (see section 2.2) can detect points
at maximum 250 mts. but in ideal conditions (i.e. open space and a direct line of sight), which did not often happened
in our case as the study area relief was irregular. Moreover, for test correlation, we followed recommendations of
Puth et al. [20] and used a Kendall test, since our data do not show normality. Furthermore, as we included a land
cover map for stratify WAPs, we just extracted land cover classes for each point, applying a buffer distance of 250
mts. to capture the landscape context of WAPs. We used the mode during data extraction to store the dominant land
cover class and derived statistics for each class. As part of the data collected by the WAP scanner included SSDIs,
we also collected male and female spanish names from Kaggle [21] to classify SSDIs and see naming patterns used
in detected devices.

                                                             2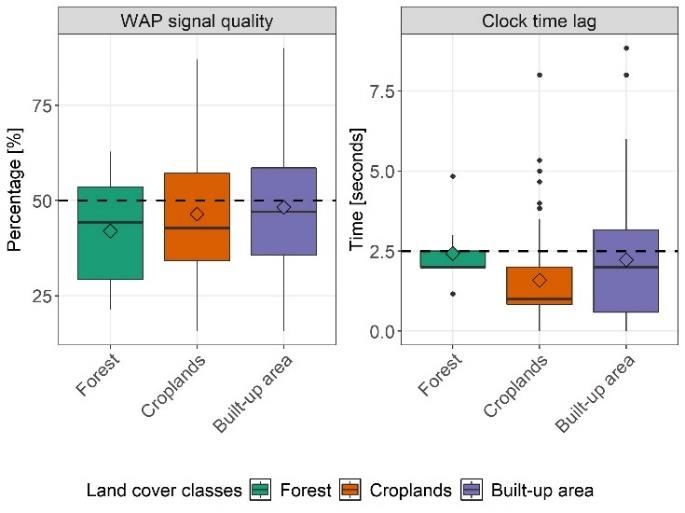
2020 International Symposium on Water, Ecology and Environment                                                 IOP Publishing
IOP Conf. Series: Earth and Environmental Science 690 (2021) 012054                        doi:10.1088/1755-1315/690/1/012054

                      Figure 1. Location of the study area and detail of the WAP scanner. Data:
                      Google satellite [3] and OpenStreetMap [22].

                                                  Table 1. Ancillary geoinformation.
             Name                               Description                         Year     Resolution [mts.]   Source
                           Constitute local population density and demographic
      Population density
                           estimates derived from machine learning, satellite
        (youths, 15-24                                                              2020            30            [23]
                           imagery and population data. Measured as inhabitants
            years)
                           / 30 mts2.
                           A composite using cloud-free average radiance
                           monthly images from nighttime data from the Visible
          Nighlight                                                                 2019           450            [24]
                           Infrared Imaging Radiometer Suite (VIIRS).
                           Measured in nanoWatts / cm2 / sr.
                           Terrain slope derived from the Shuttle Radar
             Slope         Topography Mission (SRTM) digital elevation              2000            90            [25]
                           dataset. Measured in degrees.
          Access to
                           Accessibility to economical centers calculated as time
         economical                                                                 2015            30            [26]
                           used in travelling. Measured in minutes ranges.
           centers
                           Land cover classification from satellite imagery for
                           different thematic levels. Here we is used the first
         Land cover                                                                 2014            30            [27]
                           classification level, which is adapted from
                           Intergovernmental Panel on Climate Change (IPCC)

3. Results

3.1. WAPs Quality by Land Cover Category
A summary of WAPs signal quality and clock time lag between WAP scanner and the GPS are shown in the Figure
2. They are stratified for the three land cover classes occurring in the study area, which accounted 7, 101 and 190

                                                                           3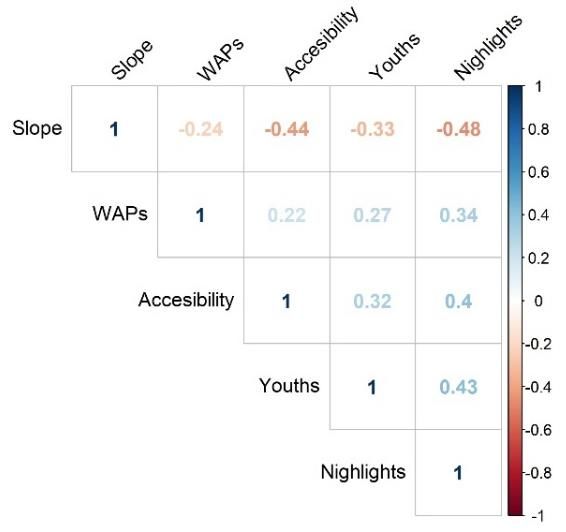
2020 International Symposium on Water, Ecology and Environment                                  IOP Publishing
IOP Conf. Series: Earth and Environmental Science 690 (2021) 012054         doi:10.1088/1755-1315/690/1/012054

WAPs for forest, cropland, and built-up areas, respectively. These values show us that WAP scanner detected more
points in urban areas than in periurban and rural areas, as is normally expected. Nevertheless, the WAP quality
indicates that all land cover cases were in average less than 50%, i.e. half of the information packets sent by the
WAP scanner were not retransmitted by scanned devices. This traduce in a poor to fair internet surfing experience
and limited online information accessibility. This was also observed for the signal strength, which was just enough
for communication, considering all land cover classes (-76±10.84 dBm). Respect to the clock time lag, most of
WAPs failed with around 2.5 seconds respect to the GPS clock; therefore, we can expect that their exact location
do not match with the one recorded by the WAP scanner. This introduced some uncertainty in our results, which
was helpful to hide location of WAPs but still allow our analysis.

                         Figure 2. WAPs signal quality and clock time lag between the
                         WAP scanner and GPS, stratified by land cover classes.

3.2. SSDI Naming Patterns Observed in WAPs
Using the SSDI, we tabulated some features that reveled some patterns about naming practices in the study area
(Figure 3). First, we only identified 6 WAPs with hidden names, i.e. their SSDI is not explicit showed but in any
case, they are still detectable by the WAP scanner. This was different when we compare SSDI names with the
spanish names, as they were larger. The rest of WAPs, showed different kind of naming practices, being surprising
its ability to reveal specific places, frequent internet providers, devices types (e.g computers, mobiles, routers,
printers) and even personal mobile numbers.

                     Figure 3. Frequent SSDI naming practices in the study area.

                                                         4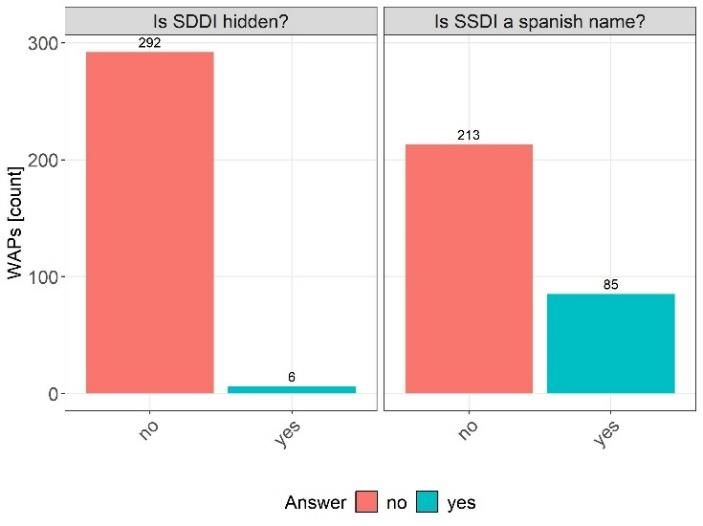
2020 International Symposium on Water, Ecology and Environment                                     IOP Publishing
IOP Conf. Series: Earth and Environmental Science 690 (2021) 012054            doi:10.1088/1755-1315/690/1/012054

                     Figure 4. Correlogram between WAPs and ancillary geoinformation.

3.3. Correlation Analysis and Significance of WAPs with Ancillary Geoinformation
With the ancillary geoinformation extracted for each segment, we constructed the correlogram to estimate how
WAPs relate to each dataset (Figure 4). The Kendall test indicates that correlations were significant in all cases (p-
values < 0.05) but those related to WAPs were weakly correlated (< 0.34). The order observed in this result,
indicated that correlation follows the next sequence (higher to lower): nightlights, youths, accessibility, and slope.
The latter was the only one with a negative value, i.e., do not relate to WAPs.

4. Discussion and Conclusions
We observed that this method as indirect data collection approach offers some opportunities to develop but also
some warnings. First, we live in environments flooded by signals of different type (e.g WiFi, television, radio, etc.),
which interfere other systems, including health related sensors [28], insects [29], and even drones shows [30]. Map
these signals and show where are they agglomerated, should be considered as an indicator not only of environmental
quality but also as a socio-economic condition. Here, we showed that WAPs where more often found in built-up
areas, rather than other land cover classes. Moreover, these areas showed a better quality, suggesting faster (and
more expensive) internet services. This observation compares well with correlation observed between WAPs,
nightlight, and accessibility to economical centres datasets; and negatively with slope (see Figure 5). These datasets
are advised as indicators of economic growth [31]; therefore, WAPs could allow to discover capital accumulation
sites with more precision but more research is required to explain this. Furthermore, the youth population density
and its positive correlation with WAPs provide evidence about population structure in this study area. With the
pandemic, this pattern made us think about the feasibility of tele-education and tele-medicine, since we found that
internet services are not the best here. In this sense, wardriving should be considered as a fast (one-day campaign
can map around 500-800 kms. tracks), cheap (
2020 International Symposium on Water, Ecology and Environment IOP Publishing
IOP Conf. Series: Earth and Environmental Science 690 (2021) 012054 doi:10.1088/1755-1315/690/1/012054
Figure 5. Regional context of the study area using the nighlight composite for 2019 as background, where Quito
(capital of Ecuador) is located at the west of the study area. The two photos are cockpit views during data
collection with the WAP scanner, where first show a hilly landscape near Jondachi, and the second a flat area
near Archidona.
Finally, it can be mention that online mapping, such as the collection of WAPs or wardriving, offers new
oportunities to explore the vast variability of existing sensors. This is interesting for automatize data collection using
variate platforms such as other project suggests [34]; and supply data needs for different scientific disciplines.
5. Acknowledgements
The author thanks to Finca Saquifrancia, Tomás and Marina Rouo for their hospitality during fieldwork. This
research was financed by the Indoamerica University.
References
[1] UN 2020 The Sustainable Development Goals Report 2020
[2] Sheehan K B and Hoy M G 1999 Using E-mail to Survey Internet Users in the United States: Methodology
and Assessment J. Comput. Commun. 4
[3] Google 2020 Google Maps Street View
[4] WiGLE Development Team 2020 WiGLE: Wireless Network Mapping
[5] Vandeviver C 2014 Applying google maps and google street view in criminological research Crime Sci. 3
1–16
[6] Sapiezynski P, Stopczynski A, Gatej R and Lehmann S 2015 Tracking human mobility using WiFi signals
PLoS One 10 1–11
[7] Cheng R, Zhang Y, Bertino E and Prabhakar S 2006 Preserving User Location Privacy in Mobile Data
Management Infrastructures BT - Privacy Enhancing Technologies ed G Danezis and P Golle (Berlin,
Heidelberg: Springer Berlin Heidelberg) pp 393–412
[8] Reades J, Calabrese F, Sevtsuk A and Ratti C 2007 Cellular Census: Explorations in Urban Data Collection
IEEE Pervasive Comput. 6 30–8
[9] Correa T, Pavez I, Contreras J and Correa T 2020 Digital inclusion through mobile phones ?: A comparison
between mobile-only and computer users in internet access , skills and use skills and use
[10] Rouvinen P 2004 Diffusion of digital mobile telephony: Are developing countries different? ETLA Discuss.
Pap. 901
[11] Saad A, Amran A R and Hasan M N A 2017 WarBox: Portable wardriving over Raspberry PI ICICTM 2016
- Proc. 1st Int. Conf. Inf. Commun. Technol. 227–35
[12] Arias-Gutiérrez R, Herrera Sorzano A and González Sousa R 2016 Poblamiento indígena amazónico y
62020 International Symposium on Water, Ecology and Environment IOP Publishing
IOP Conf. Series: Earth and Environmental Science 690 (2021) 012054 doi:10.1088/1755-1315/690/1/012054
desarrollo local en Pastaza, Ecuador Noved. en población 12 24 –34
[13] GADPN 2018 Proyecto de Actualización Plan de Desarrollo y Ordenamiento Territorial de la provincia
de Napo
[14] Wasserstrom R and Southgate D 2013 Deforestation, Agrarian Reform and Oil Development in Ecuador,
1964-1994 Nat. Resour. 04 31–44
[15] Apolo D, Melo M, Solano J and Aliaga-Sáez F 2020 Pending issues from digital inclusion in Ecuador:
challenges for public policies, programs and projects developed and ICT-mediated teacher training Digit.
Educ. Rev. 2020 130–53
[16] Tourrilhes J 2007 Wireless-Tools version 30
[17] QGIS Development Team 2019 QGIS Geographic Information System
[18] R Core Team 2015 R: A Language and Environment for Statistical Computing
[19] Gorelick N, Hancher M, Dixon M, Ilyushchenko S, Thau D and Moore R 2017 Google Earth Engine:
Planetary-scale geospatial analysis for everyone Remote Sens. Environ. 202 18–27
[20] Puth M-T, Neuhäuser M and D.Ruxton G 2015 Effective use of Spearman’s and Kendall’s correlation
coefficients for association between two measured traits Anim. Behav. 102 77–84
[21] Gil M 2018 Spanish Names | Kaggle Kaggle
[22] OpenStreetMap OpenStreetMap
[23] Facebook 2019 Using HDX to Access High Resolution Population Density Maps and Demographic
Estimates - Facebook Data for Good
[24] NOAA 2020 Version 1 VIIRS Day/Night Band Nighttime Lights
[25] Jarvis A, Reuter H I, Nelson A and Guevara E 2008 Hole-filled SRTM for the globe Version 4, available
from the CGIAR-CSI SRTM 90m Database
[26] SIGTIERRAS U-M-P 2015 Metodología Accesibilidad. Proyecto: “Levantamiento de cartografía temática
escala 1:25000, lote 2”. Temáticas Nacionales.
[27] MAE-MAGAP 2015 Protocolo metodológico para la elaboración del Mapa de cobertura y uso de la tierra
del Ecuador continental 2013-2014, escala 1:100.000 (Ministerio del Ambiente (MAE), Ministerio de
Agricultura, Ganadería, Acuacultura y Pesca (MAGAP))
[28] Kim Y, Lee S and Lee S 2016 Coexistence of ZigBee-Based WBAN and WiFi for Health Telemonitoring
Systems IEEE J. Biomed. Heal. Informatics 20 222–30
[29] Cammaerts M and Johansson O 2014 Ants can be used as bio-indicators to reveal biological effects of
electromagnetic waves from some wireless apparatus 8378 282–8
[30] El Comercio 2020 Show fallido en Guayaquil generóla caída de 65 drones al río Guayas | El Comercio
[31] Henderson J V, Storeygard A and Weil D N 2012 Measuring Economic Growth from Outer Space Am.
Econ. Rev. 102 994–1028
[32] Hawkins I 2018 WiFi Tracker - Apps on Google Play
[33] Rau L F 1991 Extracting Company Names from Text 29–32
[34] Open Data Kit 2017 ODK Collect — Open Data Kit Docs
7You can also read